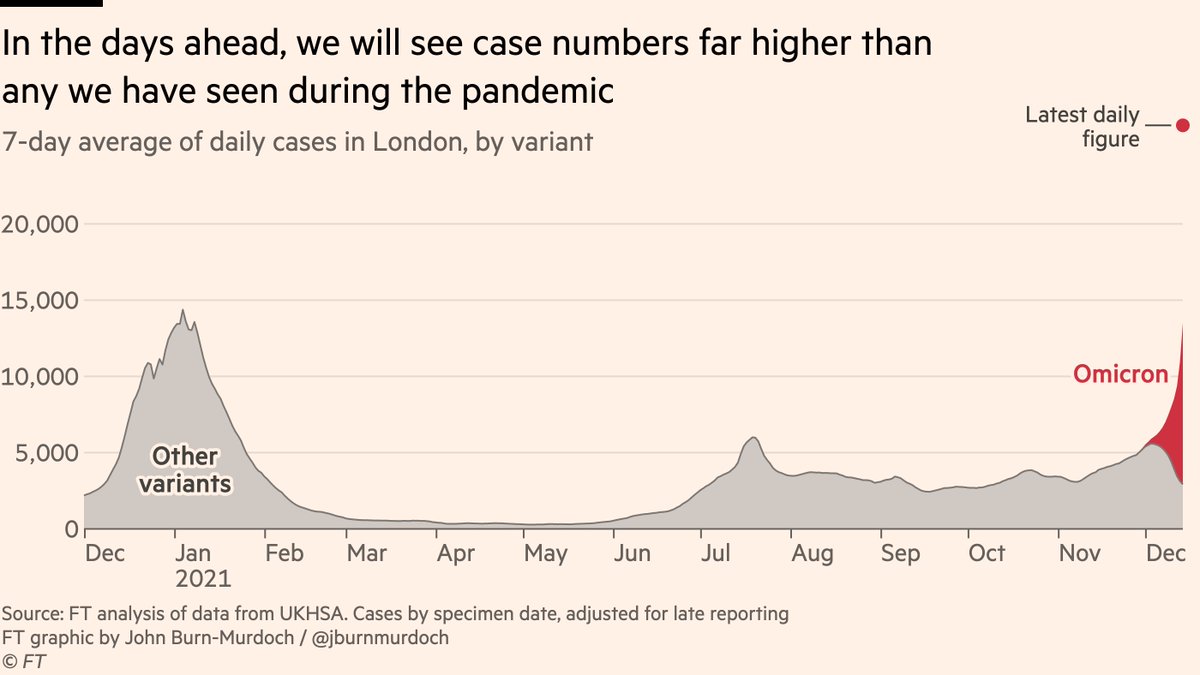
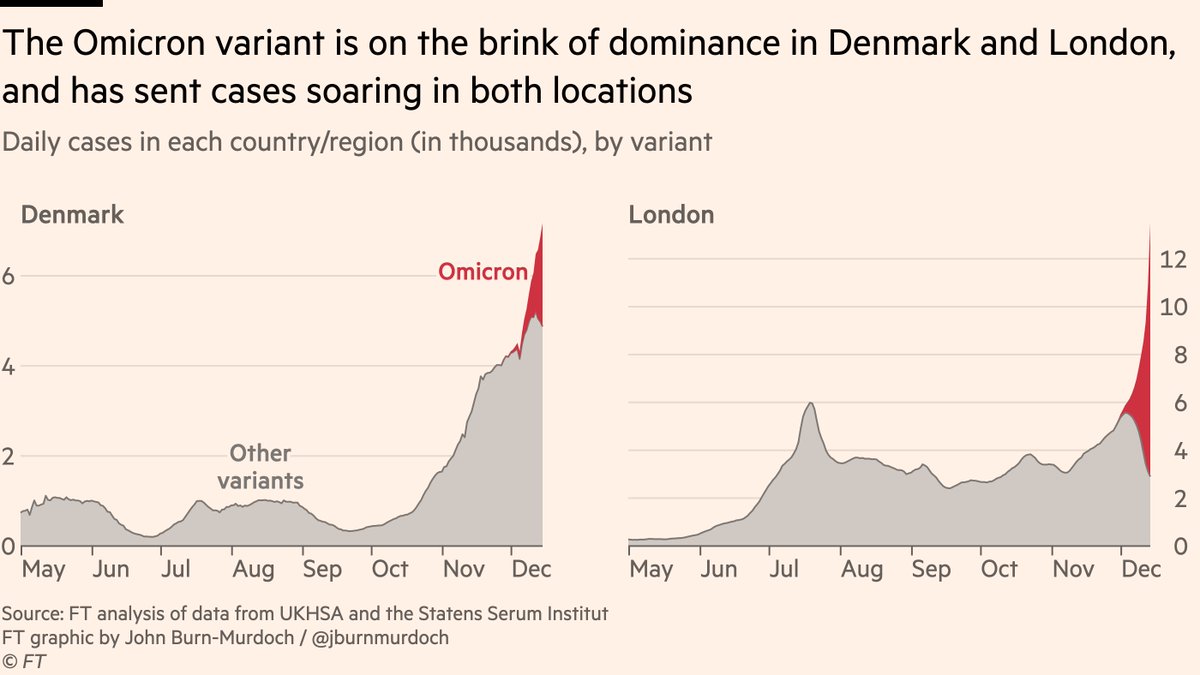
NEW: here’s a chart showing daily cases by specimen date in London, broken down by variant.
This is what is coming to ~every country across the world in the coming weeks.
This is what is coming to ~every country across the world in the coming weeks.
Let’s go deeper:
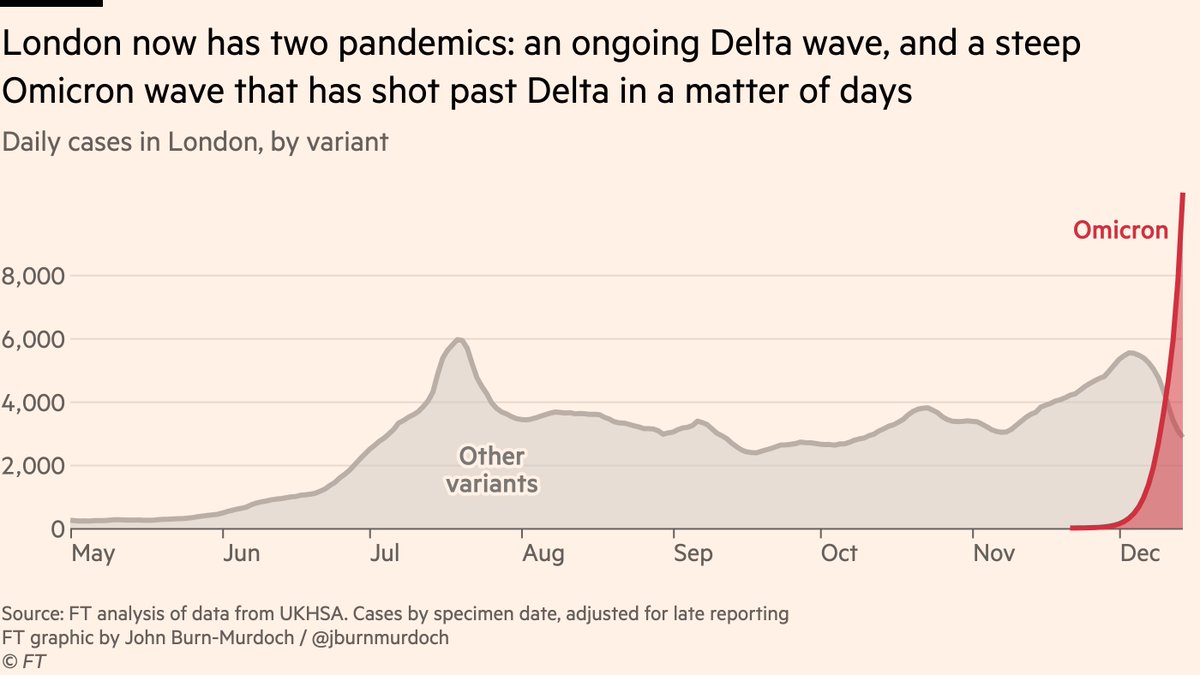
First, how are cases suddenly shooting up this fast?
Simple: just as we saw with Alpha and Delta, we’re now seeing two epidemics alongside one another. The recent steady rise of Delta masked the take-off of Omicron beneath. There’s no masking it any more.
First, how are cases suddenly shooting up this fast?
Simple: just as we saw with Alpha and Delta, we’re now seeing two epidemics alongside one another. The recent steady rise of Delta masked the take-off of Omicron beneath. There’s no masking it any more.
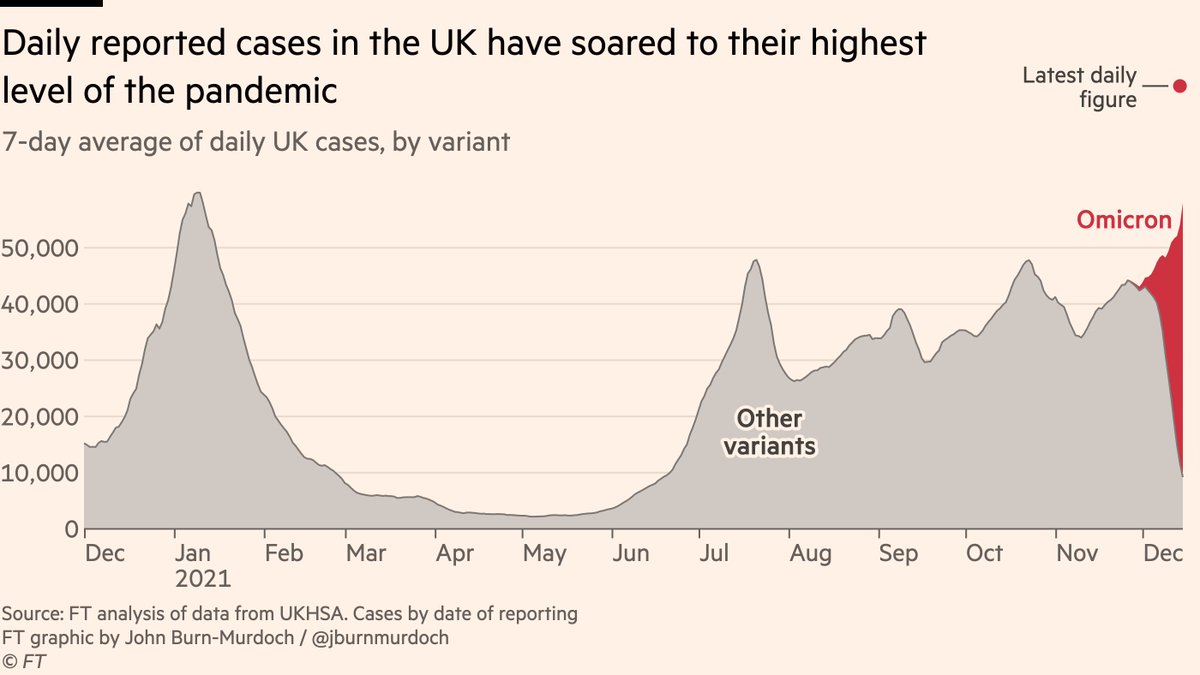
How about the rest of the UK?
Same story, just a few days behind London (the hot new thing always comes to London first).
Record-high UK-wide reported cases today, and that will rise *a lot* in the coming days.
Same story, just a few days behind London (the hot new thing always comes to London first).
Record-high UK-wide reported cases today, and that will rise *a lot* in the coming days.
So, a lot of cases! But do we need to worry? Isn’t it mild?
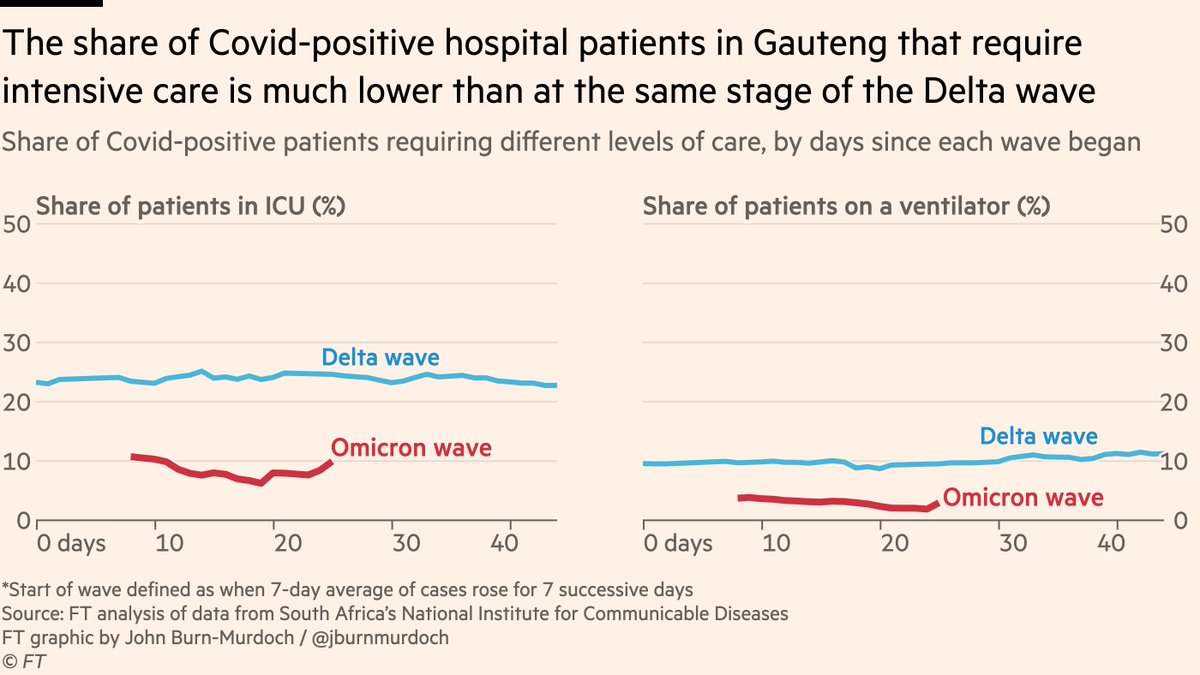
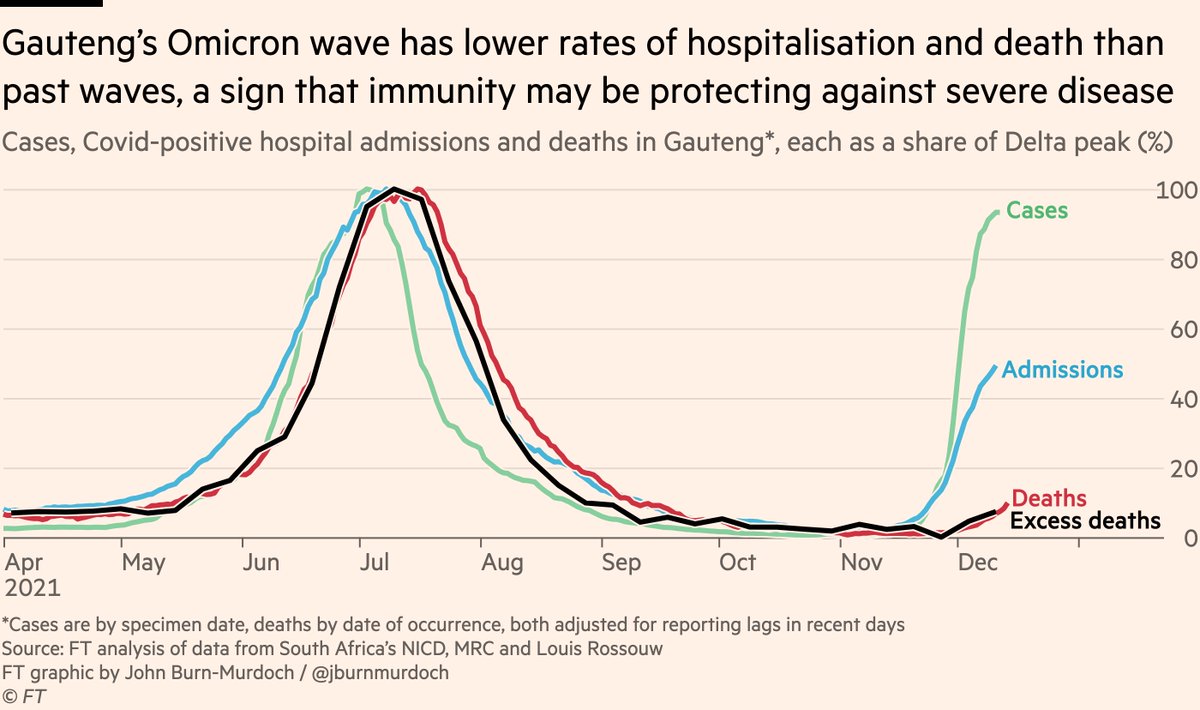
Well. Lots of ways into this, but let’s start with a visit to South Africa, where new excess deaths data is out, i.e tracking the extent to which more people are dying than usual for the time of year.
Well. Lots of ways into this, but let’s start with a visit to South Africa, where new excess deaths data is out, i.e tracking the extent to which more people are dying than usual for the time of year.
I’ve added Gauteng excess deaths to my chart tracking all of its metrics, and here’s the result:
Are outcomes in this wave less severe? Yes, definitely.
But so far excess deaths track Covid deaths, which have climbed to 10% of their Delta peak and are still rising.
Are outcomes in this wave less severe? Yes, definitely.
But so far excess deaths track Covid deaths, which have climbed to 10% of their Delta peak and are still rising.
What can we take from this?
@tomtom_m is optimistic that this means we will see a much lower death toll from this wave than those before
As always, I agree with Tom, but I’m not sure the prognosis for the UK is necessarily "cool so it’s way more mild".
@tomtom_m is optimistic that this means we will see a much lower death toll from this wave than those before
https://twitter.com/tomtom_m/status/1471137299526266883
As always, I agree with Tom, but I’m not sure the prognosis for the UK is necessarily "cool so it’s way more mild".
Right now, cases in Gauteng are 95% of the Delta peak, and deaths are 10%.
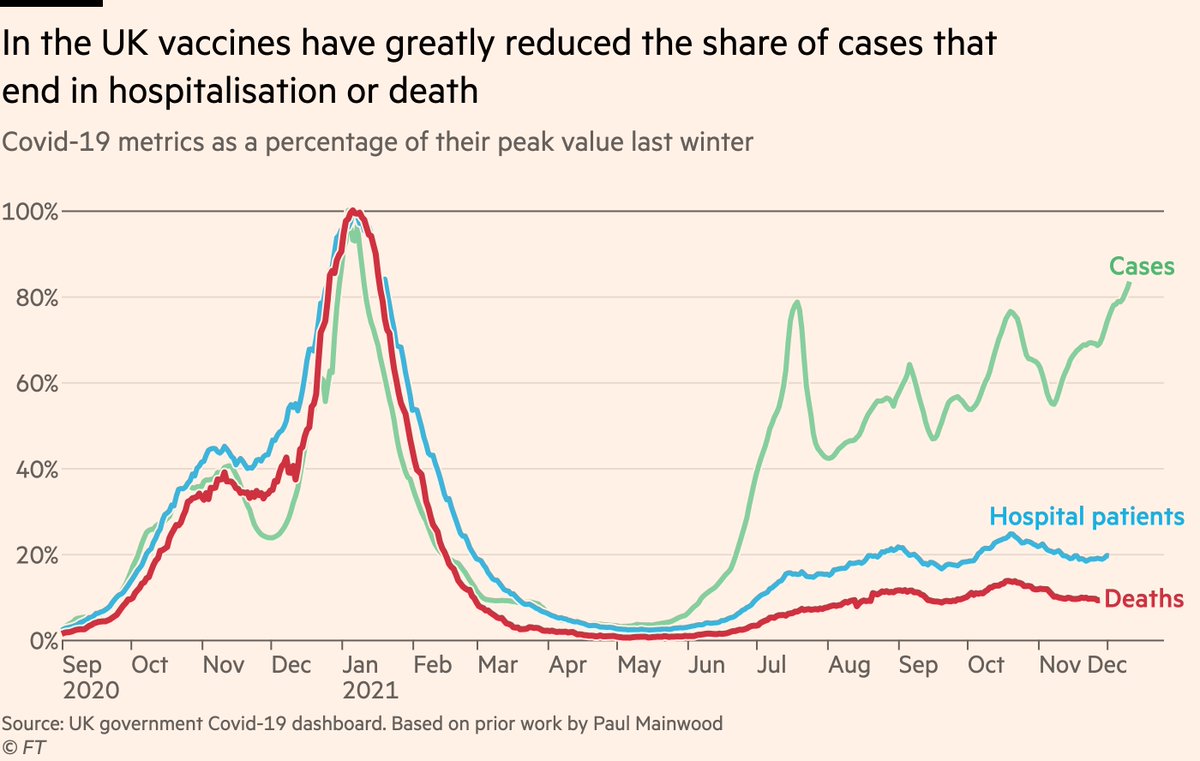
As it happens, the picture in the UK is very similar: vaccines — and immunity more generally — mean that although cases are now approaching record levels, deaths are only at 10%.
As it happens, the picture in the UK is very similar: vaccines — and immunity more generally — mean that although cases are now approaching record levels, deaths are only at 10%.
That’s good news! But:
1) What we’re attributing in SA to "mildness", we put down in UK to immunity. So from this data alone it’s not clear that it *is* inherently milder.
It might be, but that’s still being worked out, and immunity alone could explain a lot of this pattern.
1) What we’re attributing in SA to "mildness", we put down in UK to immunity. So from this data alone it’s not clear that it *is* inherently milder.
It might be, but that’s still being worked out, and immunity alone could explain a lot of this pattern.
2) We’ve already bagged that "immunity -> lower share of severe disease" benefit in UK, so not clear why our case-fatality-rates would fall further with Omicron *if it isn’t more mild*
e.g if UK cases triple from ~90% of previous peak to 270%, deaths could triple from 10% to 30%
e.g if UK cases triple from ~90% of previous peak to 270%, deaths could triple from 10% to 30%
But, regardless of Omicron’s inherent severity, what we do have working in our favour is boosters. The UK’s immunity wall against severe disease is now very high, and it’s possible boosters could further suppress rates of severe disease relative to cases
https://twitter.com/jburnmurdoch/status/1469427353117986829
That might mean, for example, that cases could go from 90% of last winter’s peak to 540% (6x), with deaths still peaking at around 30% (3x).
Still a significant amount of severe disease, but much less than if the cases:deaths ratio stays fixed.
Still a significant amount of severe disease, but much less than if the cases:deaths ratio stays fixed.
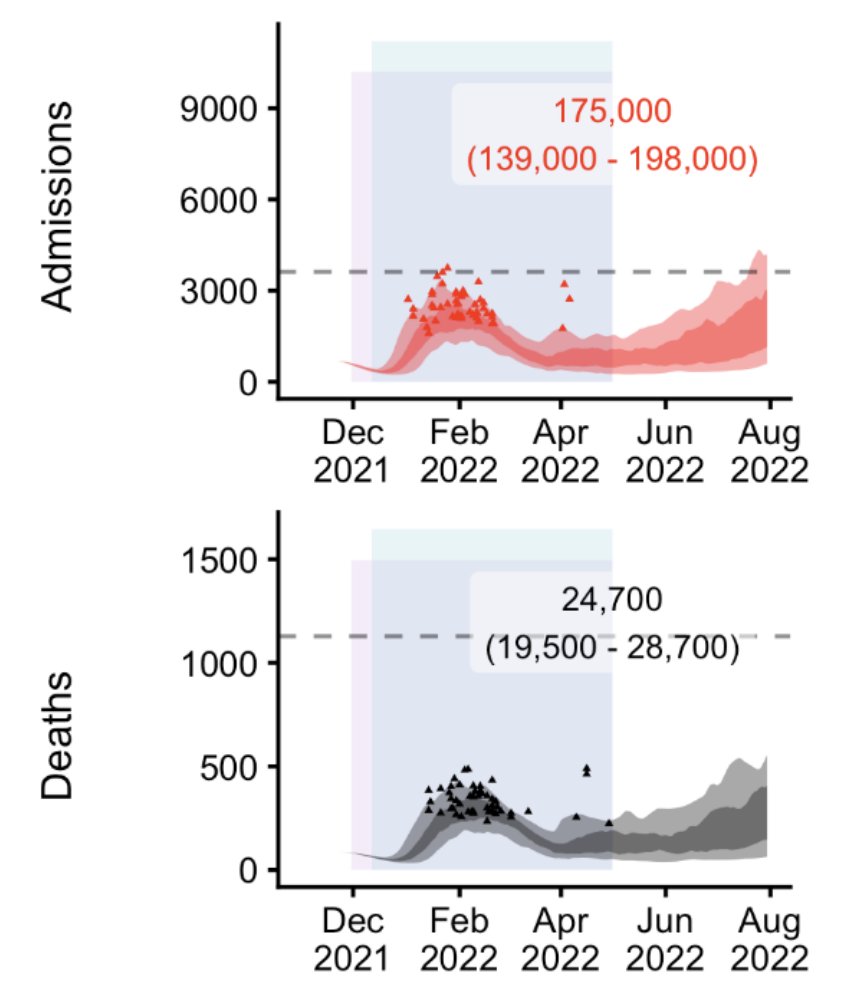
Incidentally, those outcomes are in the same sort of ballpark that the @cmmid_lshtm team estimate in their latest modelling paper: hospital admissions peak just above half of last winter’s peak, and deaths at around 30-40% cmmid.github.io/topics/covid19…
And think about what @nataliexdean says here. A lot of the cases we’re seeing now are essentially "additional" mild cases in people who we can expect to have very good protection against severe disease. So it follows that ratio of cases:severe could fall
https://twitter.com/nataliexdean/status/1468988174693289994
So right now, my overall sense is that:
• Case numbers are going to get very, very high. As high as testing capacity will allow, perhaps
• Hospital admissions (*for* Covid, not just with) and deaths will also rise
• But boosters may weaken the link between the two further
• Case numbers are going to get very, very high. As high as testing capacity will allow, perhaps
• Hospital admissions (*for* Covid, not just with) and deaths will also rise
• But boosters may weaken the link between the two further
1) To finish, a roundup of other Omicron developments:
It’s not just the UK. Denmark is at similar stage of its Omicron wave, with a clear Omicron-driven surge visible in its total case counts in recent days.
It’s not just the UK. Denmark is at similar stage of its Omicron wave, with a clear Omicron-driven surge visible in its total case counts in recent days.
2) Sticking with Denmark, some said its data on hospitalisations suggest Omicron is *more* severe. This is highly misleading
It’s based on very crude calculations on tiny numbers. Far more time needed, and in latest data the claim itself is no longer true files.ssi.dk/covid19/omikro…
It’s based on very crude calculations on tiny numbers. Far more time needed, and in latest data the claim itself is no longer true files.ssi.dk/covid19/omikro…
3) It now seems clear, after adjusting for testing volumes, that Gauteng’s Omicron wave of cases is roughly at its peak. The share of tests coming back positive is no longer rising and may be falling
https://twitter.com/tomtom_m/status/1471137254118670355
4) While there is still no solid evidence that Omicron is inherently less severe than prior variants, there is now a plausible mechanism for how it could be. Again, this doesn’t mean it is
https://twitter.com/mugecevik/status/1471088950324383745
5) It’s vital to bear in mind the UK’s health service is already extremely stretched, and as Omicron infects ~everyone, a lot of healthcare staff will have to isolate. This lowers the threshold at which the NHS gets into trouble and patient outcomes suffer
https://twitter.com/ShabirMadh/status/1469391696131764231
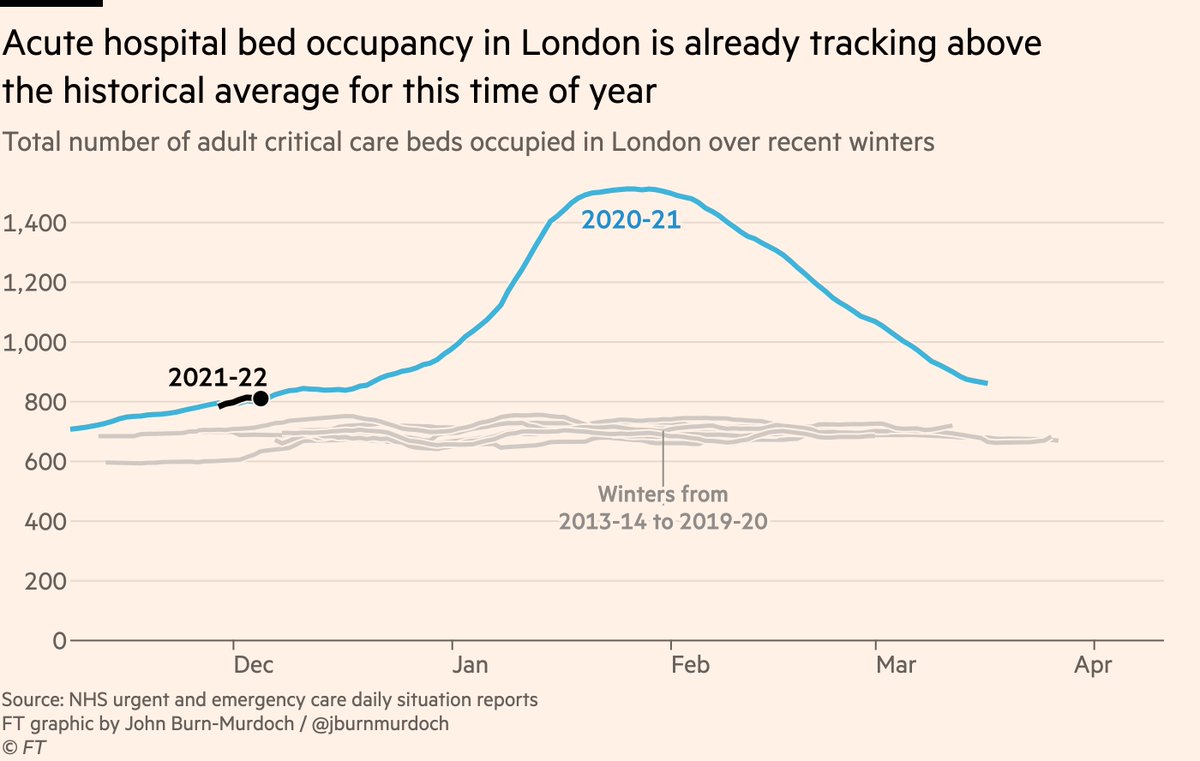
6) That will most likely be felt in London first, where the number of patients in critical care beds is already running above the typical level for this time of year, and ~150 Covid patients are being admitted every day (again, yes, mostly for Covid not just with)
As ever, we’ll keep tracking all the key numbers as the situation develops.
Tomorrow we’ll get new data on hospital pressure, including the breakdown of Covid-positive patients by whether they are being treated primarily for Covid, or only incidentally tested positive.
Tomorrow we’ll get new data on hospital pressure, including the breakdown of Covid-positive patients by whether they are being treated primarily for Covid, or only incidentally tested positive.
Hit me with your questions, comments, suggestions etc
And revisiting an earlier point:
https://twitter.com/jburnmurdoch/status/1471203835175649287
• • •
Missing some Tweet in this thread? You can try to
force a refresh