Memphis/Shelby County
Covid Wk-In-Review
tl;dr
* crisis level: 270 cases/day (28.8 per 100k)
* that's +73% over 1wk, +138% over 3wks
* it's also back above where Harvard says shutdowns are necessary
* our current 36k total cases will double as early as Jan1
#Vote
1/
Covid Wk-In-Review
tl;dr
* crisis level: 270 cases/day (28.8 per 100k)
* that's +73% over 1wk, +138% over 3wks
* it's also back above where Harvard says shutdowns are necessary
* our current 36k total cases will double as early as Jan1
#Vote
1/

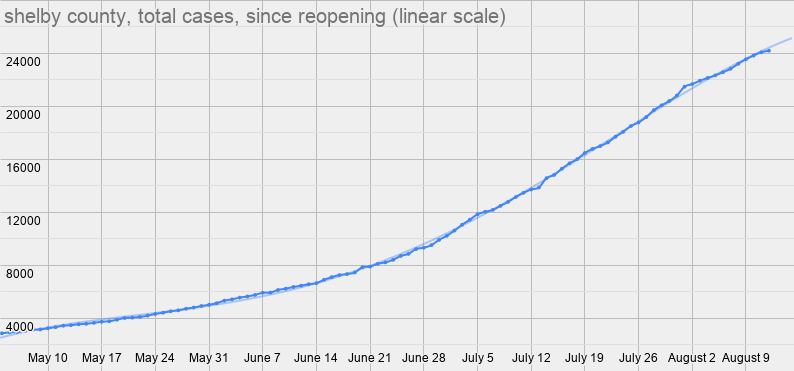
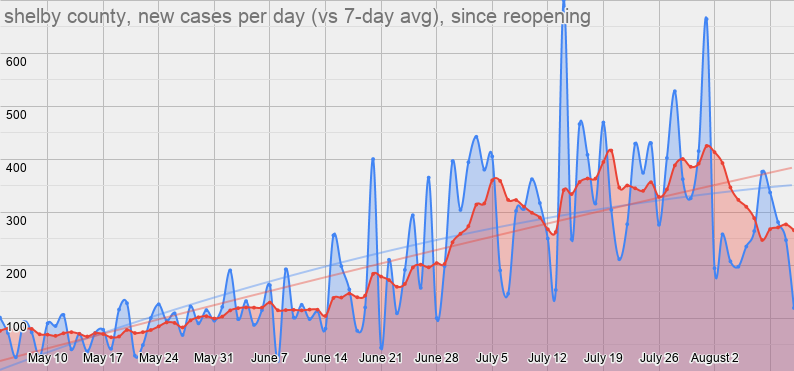
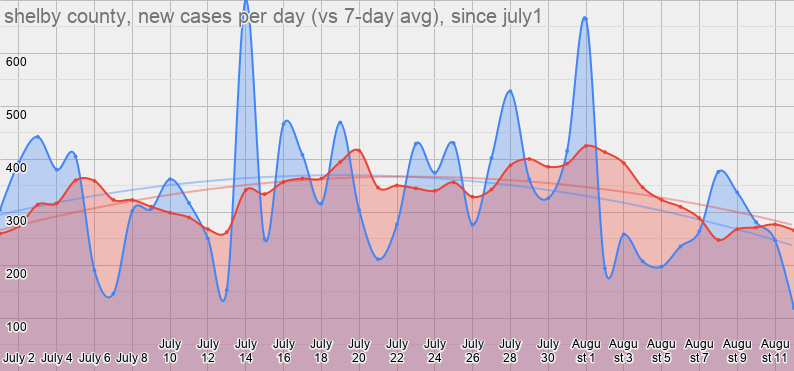
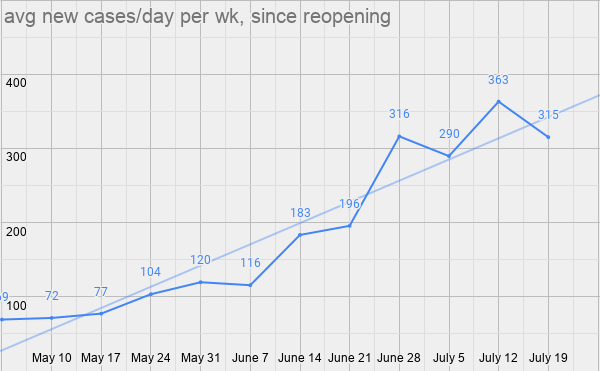
Here are daily cases, since reopening & since Sept1, plus daily positive tests since they started being reported Sept18.
270 cases/day, today
156, 1wk ago
154, 2wks ago
114, 3wks ago
130, 4wks ago
178, 5wks ago
118, 6wks ago
+73% over 1wk
+138%, 3wks
+129%, 6wks
2/
270 cases/day, today
156, 1wk ago
154, 2wks ago
114, 3wks ago
130, 4wks ago
178, 5wks ago
118, 6wks ago
+73% over 1wk
+138%, 3wks
+129%, 6wks
2/


We're at the highest levels since July, 12wks ago.
Our case rate is up to 28.8 daily cases per 100k. That's the sixth-highest on record, behind only the 5wks of July.
The previous 6 weeks:
1wk, 16.6
2wks, 16.4
3wks, 12.2
4wks, 13.9
5wks, 19.0
6wks, 12.6
3/
Our case rate is up to 28.8 daily cases per 100k. That's the sixth-highest on record, behind only the 5wks of July.
The previous 6 weeks:
1wk, 16.6
2wks, 16.4
3wks, 12.2
4wks, 13.9
5wks, 19.0
6wks, 12.6
3/

A reminder: Harvard's Global Health Institute says that 25 daily cases per 100k is the "tipping point" where stay-at-home orders become necessary.
We're at 29 per 100k.
We've lost control of the spread.
4/
We're at 29 per 100k.
We've lost control of the spread.
4/

Here's the health dept's chart of cases/day, btw. You can clearly see that the trendline is headed up.
(NOTE: This graphs the data by specimen collection date, which is not publicly available, but it lags by 6 days. I graph cases by the date they are reported to the public.)
5/
(NOTE: This graphs the data by specimen collection date, which is not publicly available, but it lags by 6 days. I graph cases by the date they are reported to the public.)
5/

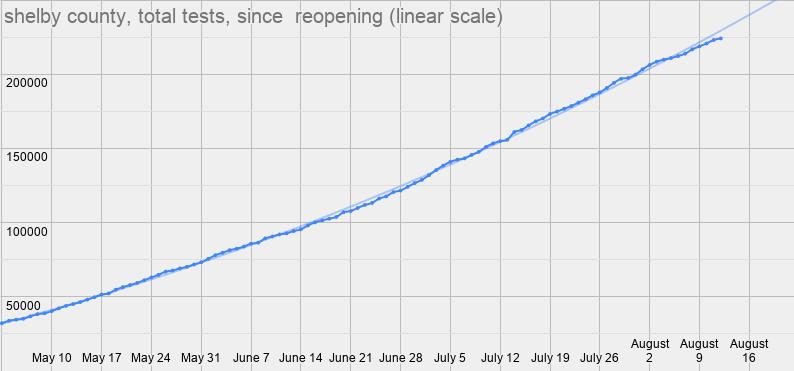
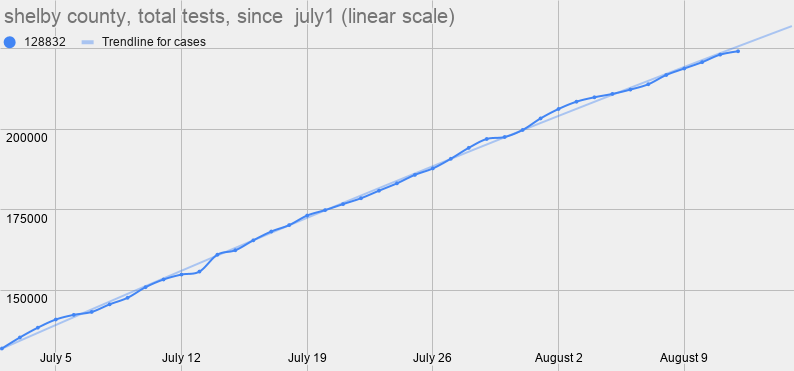
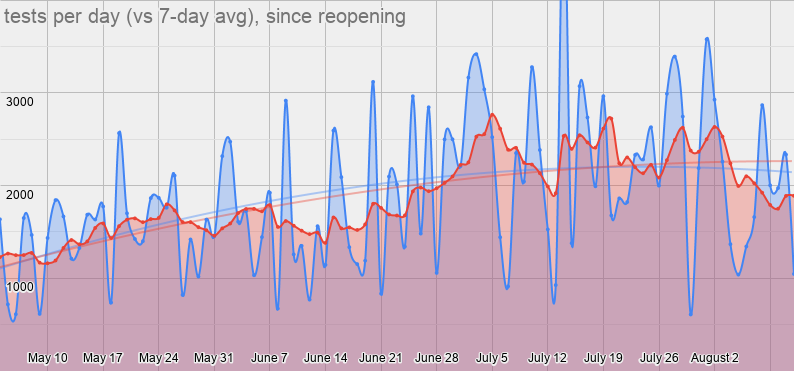
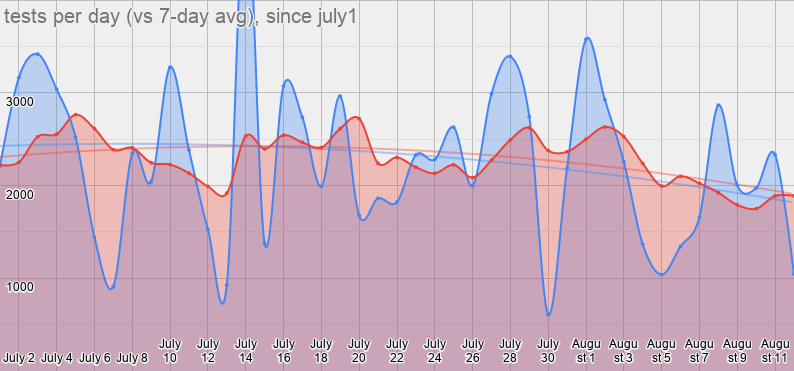
Here is testing, since reopening &since Sept1.
Until a few wks ago, they only reported tests for ppl never tested before. That's the blue line, w/the 7-day avg in red.
Now they are also reporting total tests. I've added that here in the green line, w/the avg in yellow.
6/
Until a few wks ago, they only reported tests for ppl never tested before. That's the blue line, w/the 7-day avg in red.
Now they are also reporting total tests. I've added that here in the green line, w/the avg in yellow.
6/


It's clear that testing does not explain the spike in cases bc testing can't keep up with case growth.
And the lack of testing means we are missing cases.
To repeat: Our case counts are artificially low bc of low testing.
+49% over 1wk (cases +73%)
+39 over 4wks (vs +108%)
7/
And the lack of testing means we are missing cases.
To repeat: Our case counts are artificially low bc of low testing.
+49% over 1wk (cases +73%)
+39 over 4wks (vs +108%)
7/
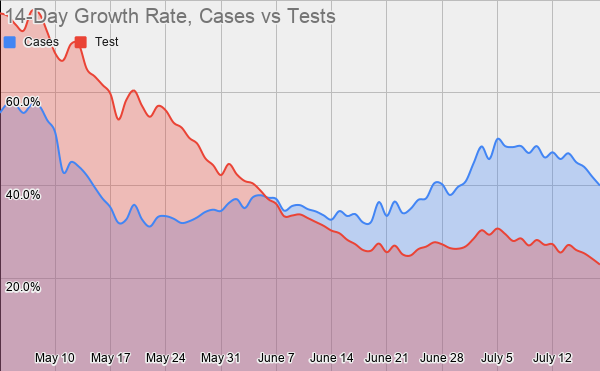
Case positivity has risen from 10.8%+ to 16.2%+ over the past 3wks. The 2nd highest wk on record.
Test positivity hit a wkly low of 5.3%, but has risen over the past 3wks to 7.2%+ today. That's the highest on record.
8/
Test positivity hit a wkly low of 5.3%, but has risen over the past 3wks to 7.2%+ today. That's the highest on record.
8/
Covid hospitalizations are way up too.
With cases spiking even more in surrounding rural counties, this is a big concern, as they are already starting to send patients to Memphis hospitals.
I worry that we'll have to open the old CA building before Christmas.
9/
With cases spiking even more in surrounding rural counties, this is a big concern, as they are already starting to send patients to Memphis hospitals.
I worry that we'll have to open the old CA building before Christmas.
9/

Here's the graph of daily cases again.
Look at that red line (7-day avg) back in June and into July: 116, 183, 196, 316...425.
Now look at it in October: 114, 154, 156, 270...???
We're staring right at another July, but with Thanksgiving, Christmas, and New Year on deck.
10/
Look at that red line (7-day avg) back in June and into July: 116, 183, 196, 316...425.
Now look at it in October: 114, 154, 156, 270...???
We're staring right at another July, but with Thanksgiving, Christmas, and New Year on deck.
10/

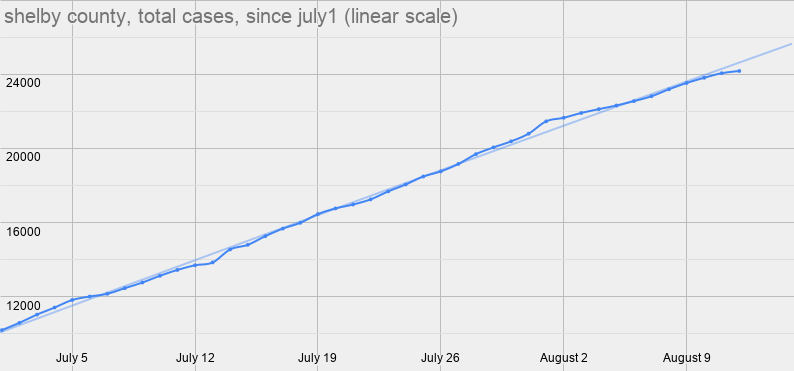
With our current growth rate, with total cases growing 0.8% per day, we're looking at 371/day by Thanksgiving.
But growth is increasing.
And at 0.9%, it's 430/day. At 1%, it's 494.
We could see over 500/day by T'giving & 700/day by New Year if we don't slow the growth.
11/
But growth is increasing.
And at 0.9%, it's 430/day. At 1%, it's 494.
We could see over 500/day by T'giving & 700/day by New Year if we don't slow the growth.
11/

Case 10k, July1 (105 days).
Case 20k, July29 (28 days).
Case 30k, Sept19 (52 days).
Case 40k will come Nov4-7 (46-49 days).
Case 50k will come Nov27-Dec5 (23-28 days).
Case 60k, Dec15-28 (18-23 days).
Case 100k, Feb4-Mar2.
Case 150k, Mar17-Apr22.
12/
Case 20k, July29 (28 days).
Case 30k, Sept19 (52 days).
Case 40k will come Nov4-7 (46-49 days).
Case 50k will come Nov27-Dec5 (23-28 days).
Case 60k, Dec15-28 (18-23 days).
Case 100k, Feb4-Mar2.
Case 150k, Mar17-Apr22.
12/

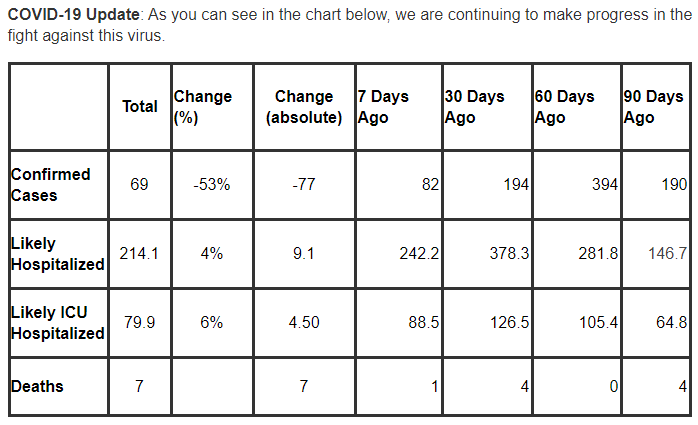
After today's 414 new cases today, we're now at 35,901 total cases.
And we'll double that sometime between Jan1 and Jan20.
By New Year, another 350 people will die of covid locally. And 350 more by the end of winter.
That's on top of the 563 already dead.
13/
And we'll double that sometime between Jan1 and Jan20.
By New Year, another 350 people will die of covid locally. And 350 more by the end of winter.
That's on top of the 563 already dead.
13/

In his thread on Thanksgiving last night, @ASlavitt said the following:
"Eventually we will need to skip a holiday."
14/
"Eventually we will need to skip a holiday."
https://twitter.com/ASlavitt/status/1319801901244948480
14/
And this:
"We could have stayed away Memorial Day and had a good Independence Day. We didn’t. We could have been careful on the 4th & had a good Labor Day. We didn’t. We could have been careful Labor Day. Nope."
15/
"We could have stayed away Memorial Day and had a good Independence Day. We didn’t. We could have been careful on the 4th & had a good Labor Day. We didn’t. We could have been careful Labor Day. Nope."
15/
Now we're going to need to skip Thanksgiving, Christmas, and New Year's parties. Unless you gather outdoors.
The more we gather and celebrate holidays, the worse this pandemic gets...and the longer it lasts.
I know we're all tired.
But...
WINTER IS COMING.
16/
The more we gather and celebrate holidays, the worse this pandemic gets...and the longer it lasts.
I know we're all tired.
But...
WINTER IS COMING.
16/

And winter, here, is metaphorical and literal.
But the literal is the problem. It's cold. And when it's cold, people gather indoors. And that's a recipe for covid spread.
We know that indoors is about 19 times less safe than outdoors. That's what makes winter so dangerous.
17/
But the literal is the problem. It's cold. And when it's cold, people gather indoors. And that's a recipe for covid spread.
We know that indoors is about 19 times less safe than outdoors. That's what makes winter so dangerous.
17/
On the first day of summer, we were avg'ing 183 cases/day. The last day of summer, 181.
Now, only one-third of the way into fall, we're already up to 270/day.
It'll get worse than the worst of the summer before winter even begins.
Winter will be bad.
18/
Now, only one-third of the way into fall, we're already up to 270/day.
It'll get worse than the worst of the summer before winter even begins.
Winter will be bad.
18/

This election is crucial.
Trump has failed. The blood of 225k ppl are on his hands.
And McConnell & Senate Republicans refuse to provide financial relief to cities, to states, to businesses, to families. Blood is on their hands too.
They must go. All of them.
#Vote
19/
Trump has failed. The blood of 225k ppl are on his hands.
And McConnell & Senate Republicans refuse to provide financial relief to cities, to states, to businesses, to families. Blood is on their hands too.
They must go. All of them.
#Vote
19/
But please know that the election won't magically fix things.
Remember how little of Obama's '09 stimulus in made it to regular ppl?
Things are worse now.
At least Dems want to do something. But we'll have to fight like hell.
So vote...and then get to work.
~ fin ~
20/20
Remember how little of Obama's '09 stimulus in made it to regular ppl?
Things are worse now.
At least Dems want to do something. But we'll have to fight like hell.
So vote...and then get to work.
~ fin ~
20/20
cc: @MayorLeeHarris @MayorMemphis @tamisawyer @mgwhaley @GermantownMarkB @EdmundFordJr @Jones4ThePeople @jbmmom @mickellforMEM @mickwright @ReginaldMilton6 @turnervan357 @jbsmileyjr @councilwomanpjr @rlynlogan @I_am_Martavius @MEasterThomas @JESwearengen @FrankColvett
cc: @Pastor_Earle @pastorkiamoore @aejohnsonphd @hunter_demster @KenyaBradshaw @GregAkers @sylamore1 @kirstinlcheers @cardelljo @wendi_c_thomas @PeskyFly @vibinc @Mediaverse @KatrinaLColeman @KateeForbis @peteredmiston @holly_sayshello @zackmcm @latilleon @FlinnShady
Addendum:
I'm not saying we need to implement a shutdown. But we have to do something.
We should think of things on a continuum, rather than a strict binary of open/closed. We do need to be strategic and turn some things down. But that's different from a full shutdown.
21/20
I'm not saying we need to implement a shutdown. But we have to do something.
We should think of things on a continuum, rather than a strict binary of open/closed. We do need to be strategic and turn some things down. But that's different from a full shutdown.
21/20
• • •
Missing some Tweet in this thread? You can try to
force a refresh