Memphis/Shelby County
Covid Wk-In-Review
tl;dr
* task force says data for past wk not accurate
* but hospitalization getting really bad (equal to the first wk in july)
* big question, re: covid, is what trump does now: does he step back & let experts lead, or go chaos-mode?
1/
Covid Wk-In-Review
tl;dr
* task force says data for past wk not accurate
* but hospitalization getting really bad (equal to the first wk in july)
* big question, re: covid, is what trump does now: does he step back & let experts lead, or go chaos-mode?
1/

Let me start by saying that change is coming.
Trump has been a complete disaster on covid.
But whatever you think of Biden, we know that he will let the public health experts take the lead.
2/
Trump has been a complete disaster on covid.
But whatever you think of Biden, we know that he will let the public health experts take the lead.
2/
The big question here is how soon?
Will Trump go full chaos-mode for the next two months?
Or will he step back & hand over the reins, at least with regard to covid?
Tens of thousands of lives hang on that question.
3/
Will Trump go full chaos-mode for the next two months?
Or will he step back & hand over the reins, at least with regard to covid?
Tens of thousands of lives hang on that question.
3/
As a nation, we just set another record for new covid cases in a day. Hospitalizations are spiking. And 1,000 people per day are dying of covid.
Even if Trump decides now to let the experts take over the covid response, it's already a disaster.
4/
Even if Trump decides now to let the experts take over the covid response, it's already a disaster.
https://twitter.com/COVID19Tracking/status/1324874304379518977
4/
So don't expect Biden to magically fix things.
That's not a realistic expectation. Covid is so bad that we would need an 8-wk complete lockdown to get numbers down to a safe place.
I'm not suggesting we do that, but that's how bad it is.
There are no easy solutions.
5/
That's not a realistic expectation. Covid is so bad that we would need an 8-wk complete lockdown to get numbers down to a safe place.
I'm not suggesting we do that, but that's how bad it is.
There are no easy solutions.
5/
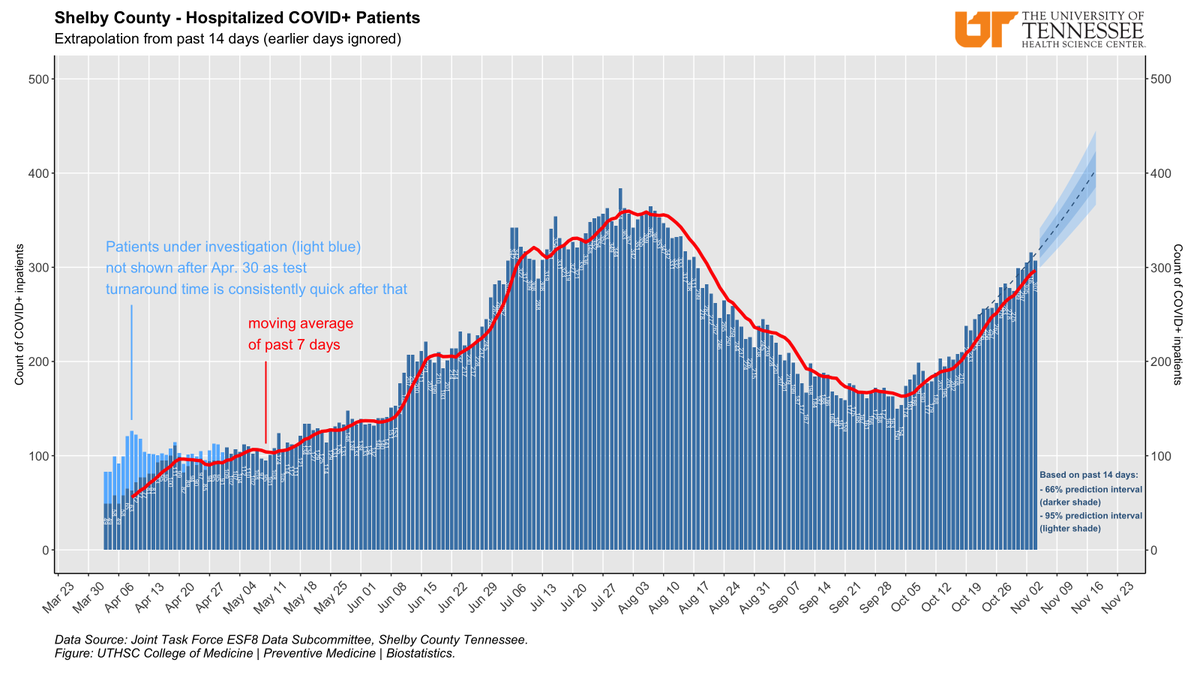
Locally, here are our covid hospitalizations...
This is bad. We're over 300, and we're about a week or so away from equalling our summer peak.
Only, now, there's no real reason to think these numbers will come down anytime soon.
We're on pace to hit 400 by Thanksgiving.
6/
This is bad. We're over 300, and we're about a week or so away from equalling our summer peak.
Only, now, there's no real reason to think these numbers will come down anytime soon.
We're on pace to hit 400 by Thanksgiving.
6/
And we can expect another surge after Thanksgiving.
People will gather. They'll gather indoors. They'll gather in small spaces at homes. And they'll gather for long periods.
And they will spread covid to their families and friends.
There's really no doubt about that.
7/
People will gather. They'll gather indoors. They'll gather in small spaces at homes. And they'll gather for long periods.
And they will spread covid to their families and friends.
There's really no doubt about that.
7/
We won't see that impact of Thanksgiving until mid-December.
And it will be really bad by Christmas. But people will gather again.
Then it will be New Year's Eve. And people will have big covid parties.
By inauguration day, we'll be looking at a complete disaster.
8/
And it will be really bad by Christmas. But people will gather again.
Then it will be New Year's Eve. And people will have big covid parties.
By inauguration day, we'll be looking at a complete disaster.
8/
So let's hope that something can convince people to be safe. You don't have to cancel the holidays, just celebrate outside with distance.
That's what my family will be doing.
I'm smoking a turkey, & we'll bring tables and chairs outside for everyone.
Pray for good weather!
9/
That's what my family will be doing.
I'm smoking a turkey, & we'll bring tables and chairs outside for everyone.
Pray for good weather!
9/
I'm only sharing the hospitalization data today, by the way.
Why?
Because the numbers this week are not accurate.
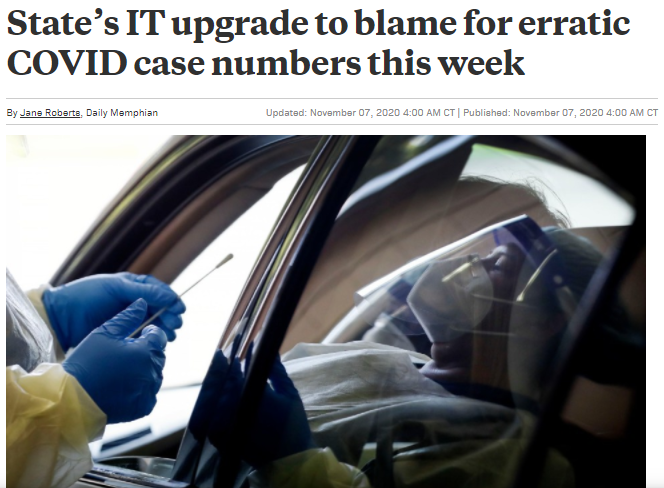
Look at this headline:
"State’s IT upgrade to blame for erratic COVID case numbers this week."
dailymemphian.com/section/metro/…
10/
Why?
Because the numbers this week are not accurate.
Look at this headline:
"State’s IT upgrade to blame for erratic COVID case numbers this week."
dailymemphian.com/section/metro/…
10/
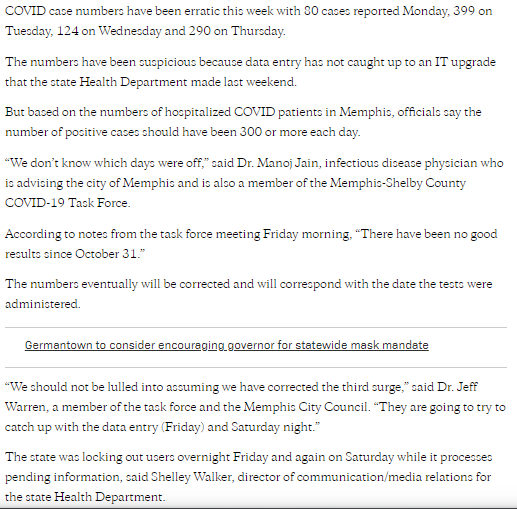
Look at this quote: "There have been no good results [data] since October 31."
It's November 7, y'all! Wtf?
The so-called "upgrade" (just days before election day?) caused delays in data entry...and a week later, they still haven't been able to catch up.
11/
It's November 7, y'all! Wtf?
The so-called "upgrade" (just days before election day?) caused delays in data entry...and a week later, they still haven't been able to catch up.
11/
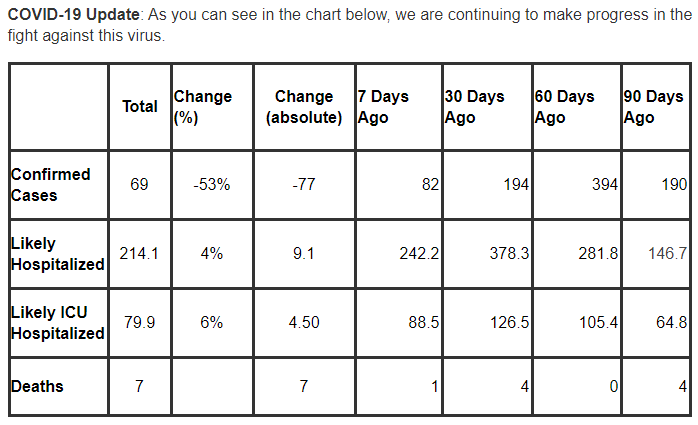
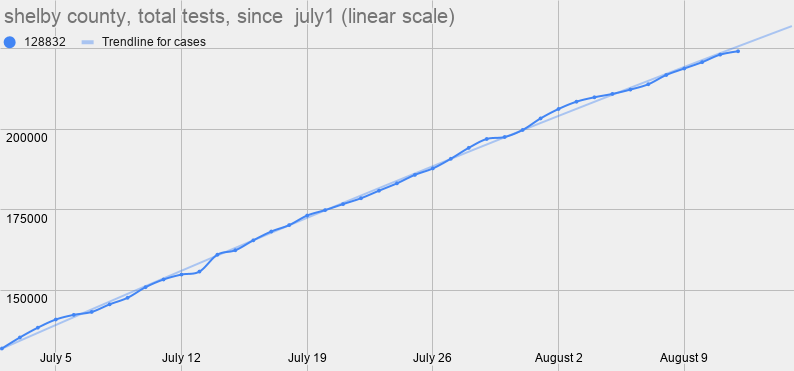
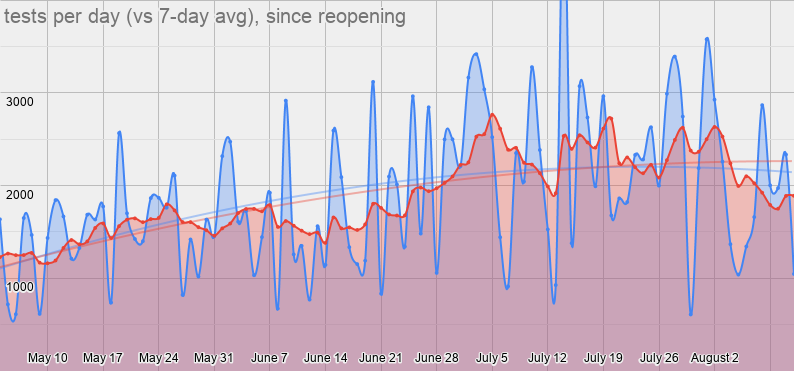
And today's numbers are just ridiculously inaccurate.
The health dept reported a mere 17 new cases today & 797 total tests.
For context, a week ago we were avg'ing 285 new cases per day & 3700 total tests per day.
Even with the bad data this week, we've avg'd 226 & 2700!
12/
The health dept reported a mere 17 new cases today & 797 total tests.
For context, a week ago we were avg'ing 285 new cases per day & 3700 total tests per day.
Even with the bad data this week, we've avg'd 226 & 2700!
12/
This is where we need @ShelbyTNHealth to use some discretion.
Don't knowingly report inaccurate information! (At least not without context.)
Hasn't four years of Trump taught us anything?
13/
Don't knowingly report inaccurate information! (At least not without context.)
Hasn't four years of Trump taught us anything?
13/
Some people will see today's 17 new cases and go let their guards down.
They won't see/hear the part about it being inaccurate, they'll just see the 17 cases.
And they'll act as if that data is real.
That's why it's irresponsible to report it.
14/
They won't see/hear the part about it being inaccurate, they'll just see the 17 cases.
And they'll act as if that data is real.
That's why it's irresponsible to report it.
14/
What should they do instead?
They should be honest & transparent.
They should post a statement saying that the data being reported from the state is not accurate & that they will not report inaccurate information.
They should say that they are waiting for accurate data.
15/
They should be honest & transparent.
They should post a statement saying that the data being reported from the state is not accurate & that they will not report inaccurate information.
They should say that they are waiting for accurate data.
15/
Also, they should consider reporting the data they have and know is accurate, which is local covid hospitalization data.
This makes you cautious, whereas 17 cases make you safe and relaxed.
16/
This makes you cautious, whereas 17 cases make you safe and relaxed.
16/

Now, I'm not sure I would completely withhold the case and testing data. But report that data responsibly.
Don't make the data the headline.
Put the data in context, not as a graphic but in a press release that explains what's happening.
17/
Don't make the data the headline.
Put the data in context, not as a graphic but in a press release that explains what's happening.
17/
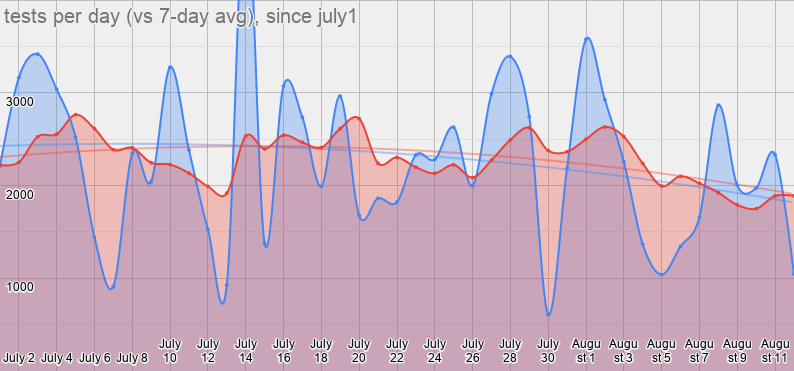
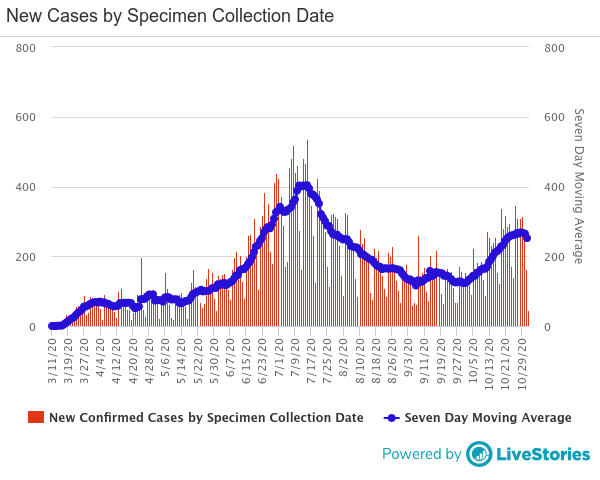
I do want to show this, though. It's from the health dept dashboard. And it shows daily cases by date of specimen collection.
You'll note that it only goes through Nov1. That's bc it always lags six days.
But see how cases were climbing through Oct30?
18/
You'll note that it only goes through Nov1. That's bc it always lags six days.
But see how cases were climbing through Oct30?
18/
I'm going to stop there.
Trump is fired!
Let's celebrate! (Safely, of course.)
I'm thinking taking a walk and drinking on my porch. It's a beautiful day.
But, first, I've got to help a student with her math work.
19/19
Trump is fired!
Let's celebrate! (Safely, of course.)
I'm thinking taking a walk and drinking on my porch. It's a beautiful day.
But, first, I've got to help a student with her math work.
19/19
• • •
Missing some Tweet in this thread? You can try to
force a refresh