
1/6. From measurements of downwelling LW IR, 342 W/m² is a reasonable, approximate estimate of downwelling LW IR radiation averaged over the entire surface of the Earth.
It's essentially identical to MacCracken's 1985 estimate (which he called "only an approximation"):
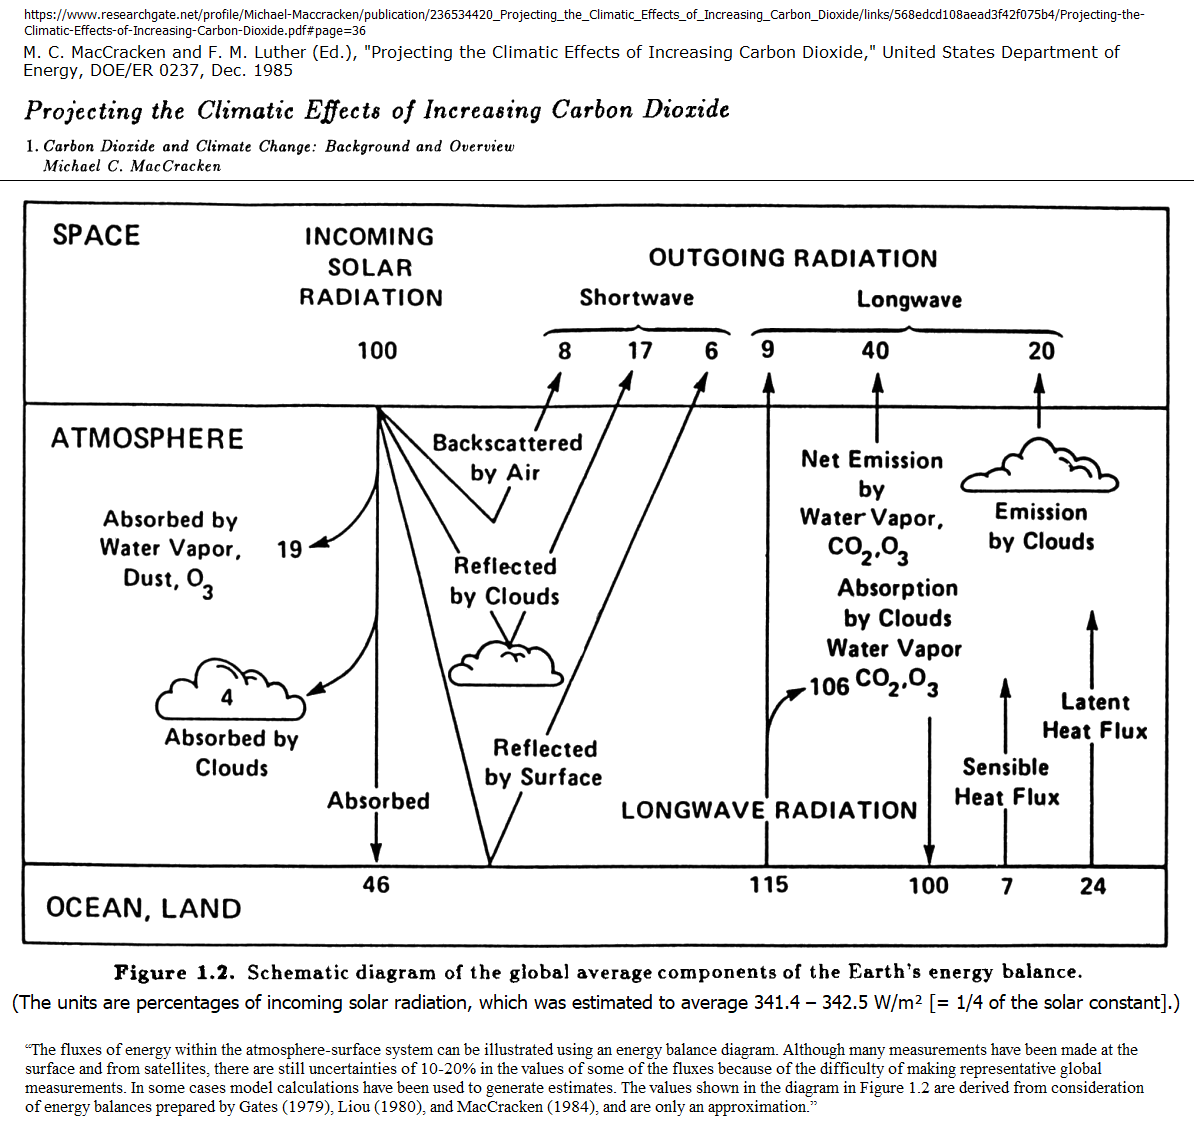
(Note: the numbers are percentages.)
The quoted text excerpt is:
“The fluxes of energy within the atmosphere-surface system can be illustrated using an energy balance diagram. Although many measurements have been made at the surface and from satellites, there are still uncertainties of 10-20% in the values of some of the fluxes because of the difficulty of making representative global measurements. In some cases model calculations have been used to generate estimates. The values shown in the diagram in Figure 1.2 are derived from consideration of energy balances prepared by Gates (1979), Liou (1980), and MacCracken (1984), and are only an approximation.”
Source:
M. C. MacCracken and F. M. Luther (Ed.), "Projecting the Climatic Effects of Increasing Carbon Dioxide," United States Department of Energy, DOE/ER 0237, Dec. 1985.
Note that the main source of uncertainty is not that we cannot measure downwelling LW IR. Rather, it is "the difficulty of making representative global measurements." Actual downwelling LW IR fluxes vary wildly with time and location, so finding an accurate global average is problematic, to put it mildly.sealevel.info/MacCracken1985…
researchgate.net/profile/Michae…
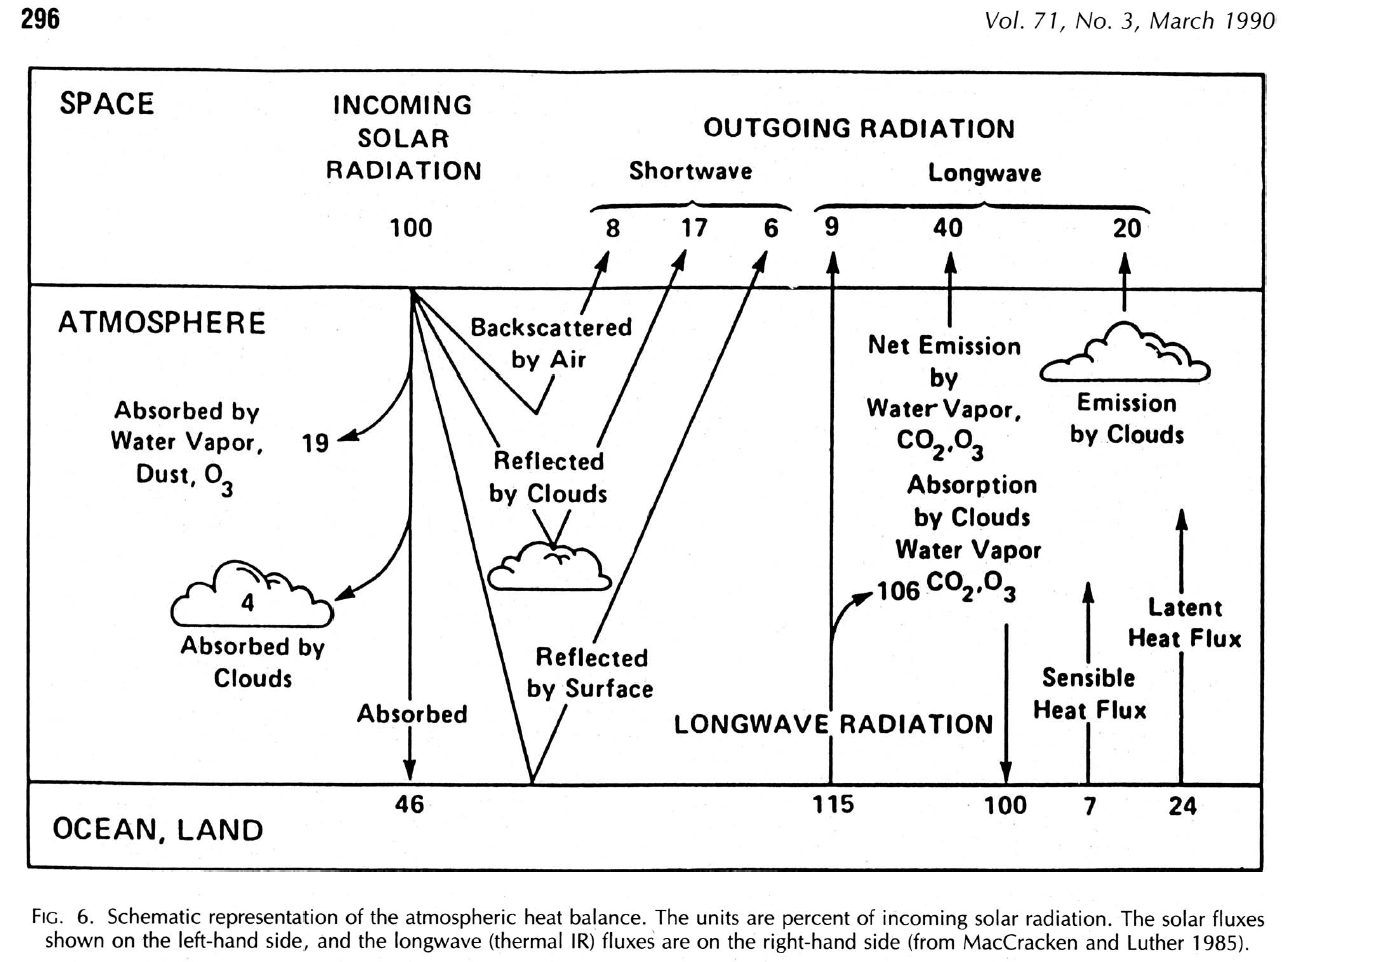
2/6. Lindzen 1990 cited MacCracken:
Source:
sealevel.info/Lindzen1990_Fi…
sealevel.info/Lindzen1990_So…
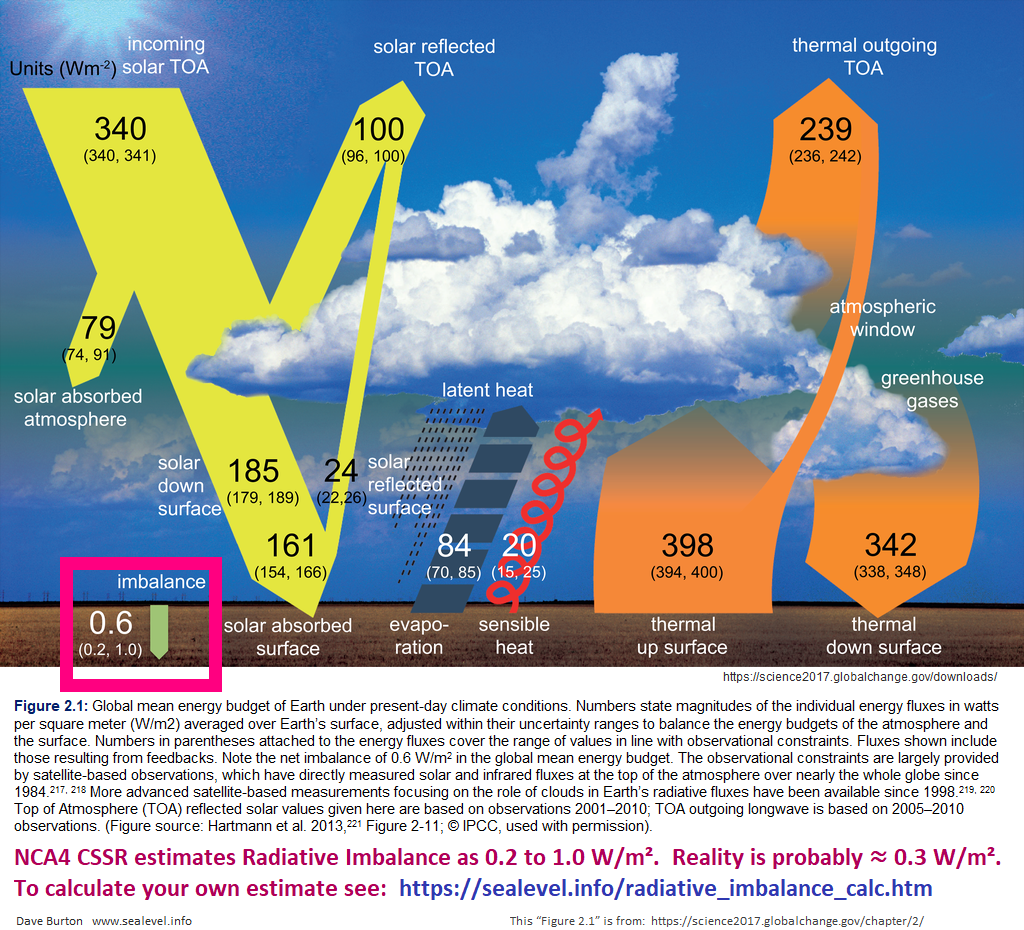
3/6. Here's the NCA4 version (with my notes about the "radiative imbalance" added). They show downwelling LW IR = 338 to 348 W/m², with a best estimate of 342:
sealevel.info/NCA4_global_en…
4/6. Willard's Feb. 3 tweet used AR6's Fig. 7.2(a) ERB diagram, which looks just like the NCA4 version, except that they unjustifiably narrowed the confidence interval to be just 339 to 347 W/m² (and wildly exaggerated the radiative imbalance estimate):
sealevel.info/IPCC_AR6_WGI_F…
_ERB_all_sky_75pct.png)
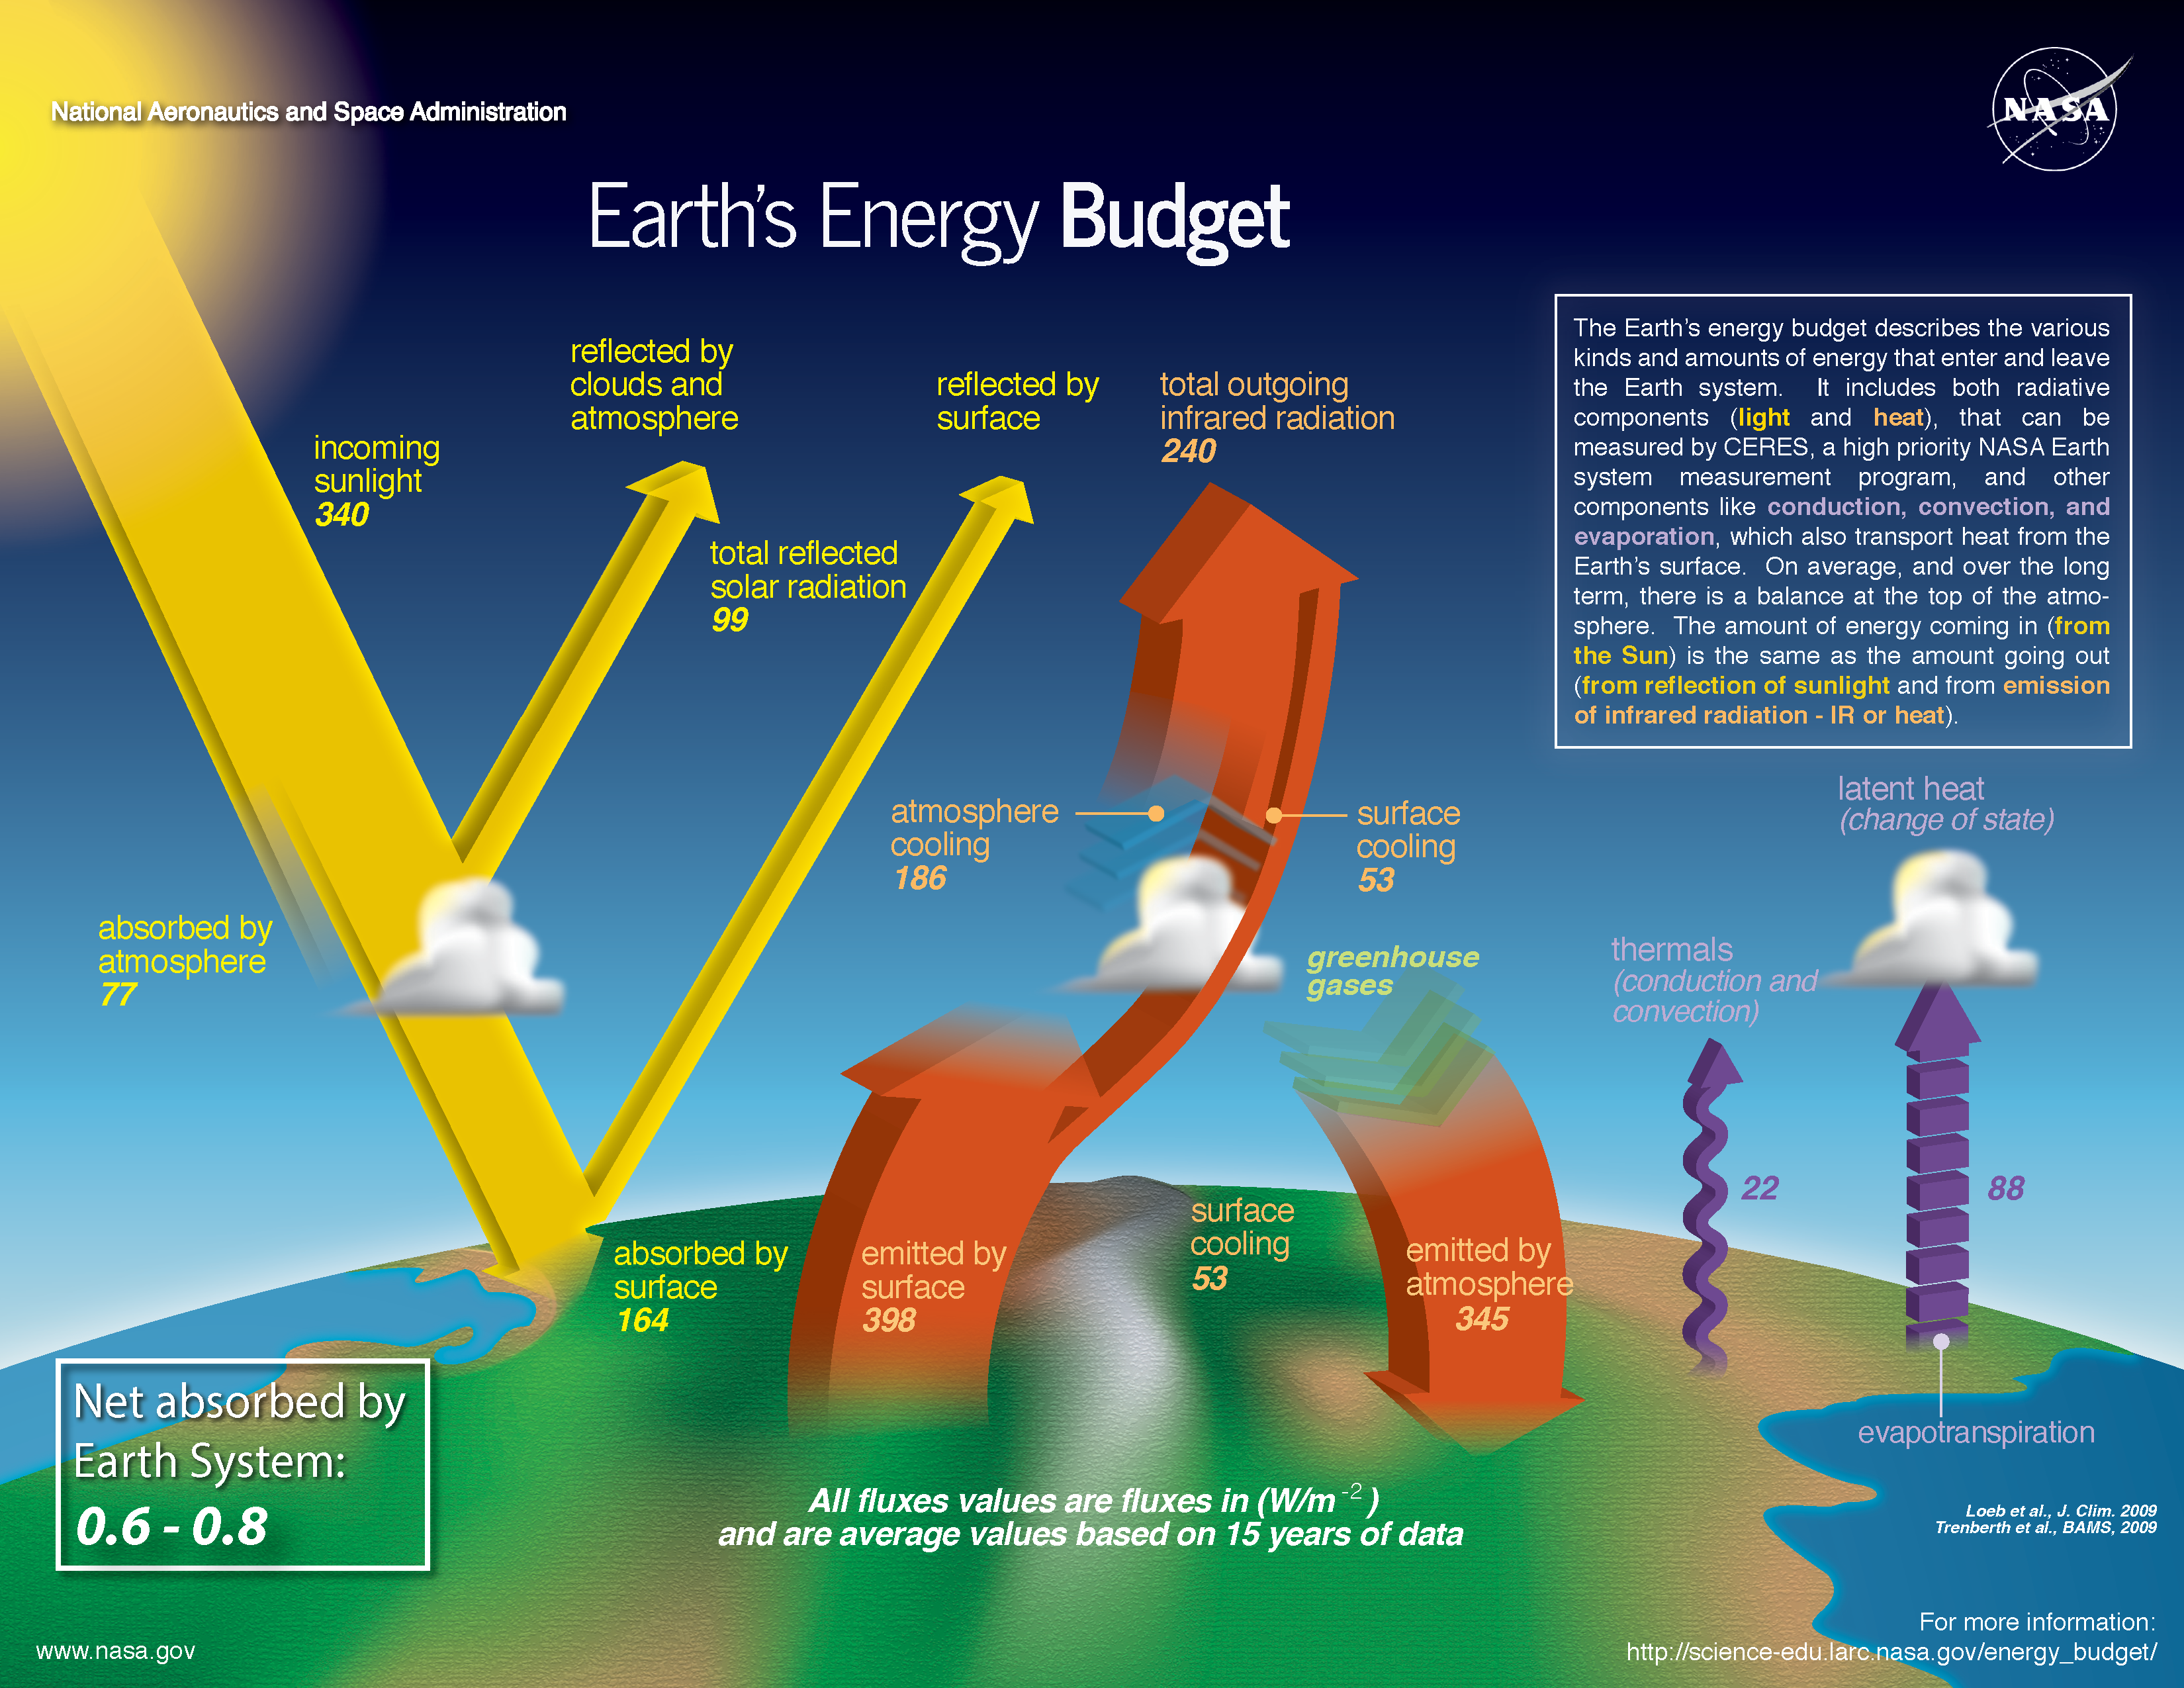
5/6. NASA has a version, too, but it's even worse than AR6's. It shows 345 W/m², and no confidence intervals at all.
(Also, the radiative imbalance estimate which they show is about 2× most likely reality.)
science.larc.nasa.gov/wp-content/upl…
6/6. So 342 W/m² is a reasonable, albeit approximate, estimate of average downwelling LW IR.
However, the best evidence is that additional CO2 has much less warming effect that Willard & the IPCC suppose. Here're some references:
sealevel.info/Radiative_Forc…
@PoyetPatrice @Anvndarnamn5 @Willard1951 @DaleGribble_666 @Tuneburg @TheDisproof @TWTThisIsNow @Konrad_Chapman @jpgcrowley @CDCollins5269 @ShroedingerBird @ChrisBBacon3 @Mark_A_Lunn @Rosie45703313 @PvtMcAuslan @EthonRaptor @priscian @Then__And__Now @tim_dunkerton @AristotleMrs @FD2you @BradPKeyes @KCTaz @0Sundance @BointonGiles @DoesThisW0rk @Climatehope2 @Jaisans @S_D_Mannix @JustThi30117912 @paulp1232 @MartinJBern @Data79504085 @ammocrypta @B_Bolshevik100 @Robert76907841 @EricWil06256732 @ProfMickWilson @FillmoreWhite @TommyLambertOKC @JohnDublin10 @NoTricksZone @PeterDClack @FamedCelebrity Compilation:
@ThreadReaderApp @Rattibha @threaddotblue unroll
@reSeeIt save threadtwitter-thread.com/t/177322784289…
Share this Scrolly Tale with your friends.
A Scrolly Tale is a new way to read Twitter threads with a more visually immersive experience.
Discover more beautiful Scrolly Tales like this.