
More and more people are experimenting with #eBPF (great!), but it seems that not everyone knows how bpftool can help manage BPF objects. I'm starting a series of tweets to help spread the awareness. Expect about one tweet a day.
[1] The sources for bpftool can be found in the Linux kernel repository. git.kernel.org/pub/scm/linux/…
To compile it: cd tools/bpf/bpftool; make; (make install; make doc; make doc-install)
To compile it: cd tools/bpf/bpftool; make; (make install; make doc; make doc-install)
[2] "bpftool prog show" is used to list all BPF programs currently loaded on the system (loaded ⇏ attached).
"bpftool prog show id 27" shows just the program of given id (ids are displayed on the left column on the list).
"bpftool prog list" is an alias, does the same thing.
"bpftool prog show id 27" shows just the program of given id (ids are displayed on the left column on the list).
"bpftool prog list" is an alias, does the same thing.

[3] Load a BPF program from ELF file “foo.o” to the system and pin it under the BPF virtual file system as “bar”:
# bpftool prog load foo.o /sys/fs/bpf/bar
Pinning the program makes it persistent (and offers a handle for later management, e.g. to attach that program to a hook).
# bpftool prog load foo.o /sys/fs/bpf/bar
Pinning the program makes it persistent (and offers a handle for later management, e.g. to attach that program to a hook).
(To clear up any confusion: please note that in this thread “BPF” should be read as “eBPF”, and not as the legacy “classic BPF” version used with tcpdump.)
[4] Dump bytecode for a program loaded on the system, as “translated” instructions:
# bpftool prog dump xlated id 40
“Translated” means after kernel rewrites (as opposed to “llvm-objdump -d my_program_objfile.o”). This is available for all programs, even if JIT-compiler is on.
# bpftool prog dump xlated id 40
“Translated” means after kernel rewrites (as opposed to “llvm-objdump -d my_program_objfile.o”). This is available for all programs, even if JIT-compiler is on.

[5] Dump JIT-compiled instructions for a BPF program (here from its pinned handle):
# bpftool prog dump jited pinned /sys/fs/bpf/foo
Obviously, works only for programs loaded when JIT is on. Second picture is a dump from a sample used for HW offload with @Netronome's SmartNICs.
# bpftool prog dump jited pinned /sys/fs/bpf/foo
Obviously, works only for programs loaded when JIT is on. Second picture is a dump from a sample used for HW offload with @Netronome's SmartNICs.


[6] bpftool is not just about BPF programs, you can also manage BPF maps. Here is how to list the maps on the system:
# bpftool map show
As for programs, the alias “bpftool map list” does the same. “bpftool map show id 7” shows info just for the map of given id.
# bpftool map show
As for programs, the alias “bpftool map list” does the same. “bpftool map show id 7” shows info just for the map of given id.

[7] Let's inspect BPF maps. Retrieve one entry, here the second entry of an array map (note the use of host endianness for passing the key), with:
# bpftool map lookup id 182 key 0x01 0x00 0x00 0x00
Or dump all entries of a given map:
# bpftool map dump id 182
# bpftool map lookup id 182 key 0x01 0x00 0x00 0x00
Or dump all entries of a given map:
# bpftool map dump id 182


[8] bpftool can print its output formatted as JSON. Use the “-j” (or “--json”) switch when typing commands to get a one-line JSON dump, or use “-p” (long option name: “--pretty”) to produce human-readable JSON with indent and line breaks. Here is an example for program info.

[9] It is possible to use bpftool to create a map. The map is pinned under the BPF virtual file system (or it would be lost when bpftool exits, as no BPF program uses it yet). Example:
# bpftool map create /sys/fs/bpf/stats_map type array key 4 value 32 entries 8 name stats_map
# bpftool map create /sys/fs/bpf/stats_map type array key 4 value 32 entries 8 name stats_map
[10] Update an entry of a map:
# bpftool map update id 7 key 3 0 0 0 value 1 1 168 192
For compatible map types, "bpftool map update" is also used to create new entries, and "bpftool map delete" to remove them. Hash maps support it, but fixed-length arrays can only be updated.
# bpftool map update id 7 key 3 0 0 0 value 1 1 168 192
For compatible map types, "bpftool map update" is also used to create new entries, and "bpftool map delete" to remove them. Hash maps support it, but fixed-length arrays can only be updated.
[11] bpftool has a “hex” keyword to conjure the use of hexadecimal numbers in command key/value. All the syntaxes below are equivalent:
# bpftool map lookup id 7 ...
... key 3 15 32 64
... key 0x3 0xf 0x20 0x40
... key 0x03 0x0f 0x20 0x40
... key hex 03 0f 20 40
# bpftool map lookup id 7 ...
... key 3 15 32 64
... key 0x3 0xf 0x20 0x40
... key 0x03 0x0f 0x20 0x40
... key hex 03 0f 20 40
[12] Let's pin a BPF program to the BPF virtual file system, e.g. to keep it loaded once detached:
# bpftool prog pin id 27 /sys/fs/bpf/foo_prog
Remove with “rm /sys/fs/bpf/foo_prog”. Also works for maps. Details on pinning and lifetime of BPF objects at facebookmicrosites.github.io/bpf/blog/2018/…
# bpftool prog pin id 27 /sys/fs/bpf/foo_prog
Remove with “rm /sys/fs/bpf/foo_prog”. Also works for maps. Details on pinning and lifetime of BPF objects at facebookmicrosites.github.io/bpf/blog/2018/…
[13] Once loaded, BPF programs of certain types can be attached with bpftool. This is the case of programs attached to sockets with:
# bpftool prog attach <program> <attach type> <target map>
Or to cgroups, with:
# bpftool cgroup attach <cgroup> <attach type> <program> [flags]
# bpftool prog attach <program> <attach type> <target map>
Or to cgroups, with:
# bpftool cgroup attach <cgroup> <attach type> <program> [flags]
[14] While we're at cgroups: bpftool can show the programs attached to a given cgroup.
# bpftool cgroup show <cgroup>
It can even iterate over cgroups and show all programs (with no argument it defaults to the cgroup v2 mountpoint, see pic):
# bpftool cgroup tree [cgroup-root]
# bpftool cgroup show <cgroup>
It can even iterate over cgroups and show all programs (with no argument it defaults to the cgroup v2 mountpoint, see pic):
# bpftool cgroup tree [cgroup-root]

[15] After cgroups, let's list all tracing BPF programs currently attached on the system (to tracepoints, raw_tracepoints, k[ret]probes, u[ret]probes). As simple as:
# bpftool perf show
(“bpftool perf list” or simply “bpftool perf” both produce the same output.)
# bpftool perf show
(“bpftool perf list” or simply “bpftool perf” both produce the same output.)

[16] bpftool can be used to iterate over BPF map elements (this is especially useful with hash maps, with no predictable array indices):
# bpftool map getnext id 27 key 1 0 0 10
Returns the key of the “next” entry. If no key is provided, it returns the “first” key from the map.
# bpftool map getnext id 27 key 1 0 0 10
Returns the key of the “next” entry. If no key is provided, it returns the “first” key from the map.
[17] It's Friday and you're feeling lazy? bpftool supports abbreviations. Try:
# bpftool p d x i <id>
It also has exhaustive bash completion, proposing contextual commands, options, or even items such as available program/map ids when relevant!
Also works when it's not Friday.
# bpftool p d x i <id>
It also has exhaustive bash completion, proposing contextual commands, options, or even items such as available program/map ids when relevant!
Also works when it's not Friday.

[17.5] Sadly, there is no completion available for bpftool in Zsh yet. As always, contributions are welcome.
[18] Linux 5.1 introduces stats for attached BPF programs: total run time and run count. bpftool prints them with classic info dump:
# bpftool prog show
Gathering stats impacts perf (~10 to 30 nsecs/run) so defaults to off, activate with:
# sysctl -w kernel.bpf_stats_enabled=1
# bpftool prog show
Gathering stats impacts perf (~10 to 30 nsecs/run) so defaults to off, activate with:
# sysctl -w kernel.bpf_stats_enabled=1

[19] Similarly to “bpftool cgroup tree” or “bpftool perf show”, bpftool has a mode to dump programs related to network processing:
# bpftool net show
This lists programs attached to TC or XDP hooks. It is possible to filter on a given interface:
# bpftool net show dev <iface>
# bpftool net show
This lists programs attached to TC or XDP hooks. It is possible to filter on a given interface:
# bpftool net show dev <iface>

[20] Load a program, but reuse e.g. two existing maps (instead of automatically creating new ones):
# bpftool prog load foo.o /sys/fs/bpf/foo_prog \
map idx 0 id 27 \
map name stats pinned /sys/fs/bpf/stats_map
(“idx 0”: index of the map in the ELF program file)
# bpftool prog load foo.o /sys/fs/bpf/foo_prog \
map idx 0 id 27 \
map name stats pinned /sys/fs/bpf/stats_map
(“idx 0”: index of the map in the ELF program file)
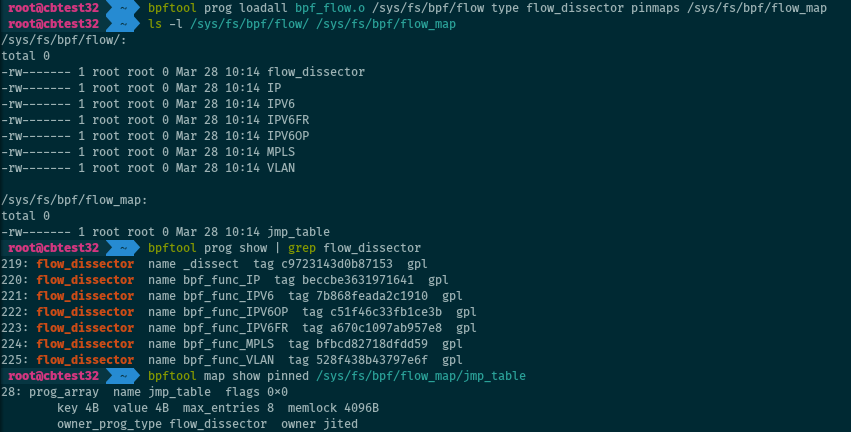
[21] For object files with more than one BPF program, bpftool can load all of them at once:
# bpftool prog loadall bpf_flow.o /sys/fs/bpf/flow type flow_dissector
This is especially useful when working with BPF tail calls. Maps can be pinned by adding “pinmaps <path in bpffs>”.
# bpftool prog loadall bpf_flow.o /sys/fs/bpf/flow type flow_dissector
This is especially useful when working with BPF tail calls. Maps can be pinned by adding “pinmaps <path in bpffs>”.
[22] There is a batch mode in bpftool for running several commands at once:
# bpftool batch file <file>
It can read commands from standard input if <file> is “-” (dash):
# echo 'prog show \n map show \n net show' | bpftool batch file -
# bpftool batch file <file>
It can read commands from standard input if <file> is “-” (dash):
# echo 'prog show \n map show \n net show' | bpftool batch file -
[23] This tip was graciously provided by @calavera (Thanks!): you can use “#” to have comments in bpftool batch files. See the Gist for a sample batch file.
https://twitter.com/calavera/status/1112408664193658880
[24] bpftool recently got support for converting and dumping the kernel image into BPF instructions:
# bpftool kernel dump
Then we can edit the BPF assembly and reload this new kernel, with all verifier checks as a benefit (no reboot required!):
# bpftool kernel load <file>
# bpftool kernel dump
Then we can edit the BPF assembly and reload this new kernel, with all verifier checks as a benefit (no reboot required!):
# bpftool kernel load <file>

(In case there was any doubt, and for future readers, that last one ([24]) was published on the 1st of April and was obviously a joke. Ha. Ha.)
[25] A note on map updates: bpftool can update “prog_array” maps (holding references to BPF programs, for BPF tail calls).
# bpftool map update pinned /sys/fs/bpf/my_prog_array_map \
key 0 0 0 0 value pinned /sys/fs/bpf/my_prog
The map MUST be pinned for this to work.
# bpftool map update pinned /sys/fs/bpf/my_prog_array_map \
key 0 0 0 0 value pinned /sys/fs/bpf/my_prog
The map MUST be pinned for this to work.
[26] BTF support! As @alexei_ast pointed out, bpftool can dump the C source code of a program in addition to BPF/jited insns. This requires:
- Compiling the program with “-g” flag passed to clang.
- Using a recent LLVM version, 8+ (older versions need some pahole tinkering).
- Compiling the program with “-g” flag passed to clang.
- Using a recent LLVM version, 8+ (older versions need some pahole tinkering).

[27] BTF also provides info on the structure of map entries, printable with “bpftool map dump”.
Requirements for program using the map: same as in [26], plus map declaration in C sources must be annotated with the “BPF_ANNOTATE_KV_PAIR(<map name>, <key type>, <val type>)” macro.
Requirements for program using the map: same as in [26], plus map declaration in C sources must be annotated with the “BPF_ANNOTATE_KV_PAIR(<map name>, <key type>, <val type>)” macro.


[28] bpftool provides interactive help for all commands with the “--help|-h” option. And it comes with documentation: You can find most of the features described in this thread in the manual pages of the tool. mankier.com/package/bpftool
[29] bpftool can dump the trace pipe, used by BPF helper bpf_trace_printk() to print debug output. For the record, it is based after a similar feature in iproute2, “tc exec bpf dbg”. With bpftool:
# bpftool prog tracelog
Shorter than “cat /sys/kernel/debug/tracing/trace_pipe”.
# bpftool prog tracelog
Shorter than “cat /sys/kernel/debug/tracing/trace_pipe”.

[30] More complex than bpf_trace_printk(), but more flexible and much faster, perf events can be used to stream data to user space. And yes, bpftool can dump this data:
# bpftool map event_pipe <MAP> [cpu <N> index <M>]
See also bpf_perf_event_output() man7.org/linux/man-page…
# bpftool map event_pipe <MAP> [cpu <N> index <M>]
See also bpf_perf_event_output() man7.org/linux/man-page…

[31] With the “visual” keyword, bpftool can dump the control flow graph of a program in a format compatible with dot. Use dot on the output to generate a graph showing the possible paths of execution.
# bpftool prog dump xlated id <id> visual
# bpftool prog dump xlated id <id> visual

[32] When BTF is available for a program (to dump the C insns), adding the “linum” keyword also prints the name of the C source file, and the line numbers related to the converted instructions. Helpful to trace where a program comes from.
# bpftool prog dump xlated id <id> linum
# bpftool prog dump xlated id <id> linum

[33] Note that bpftool does not implement low-level BPF handling itself, most of the magic comes from libbpf. This library is shipped with the kernel (git.kernel.org/pub/scm/linux/…) and mirrored on GitHub (github.com/libbpf/libbpf). Check it out if you need to manage BPF objects in C.
[34] Linux 4.20 brought stack and queue maps to BPF. We can use bpftool to manipulate them. Because such maps don't rely on keys (only values), it differs somewhat from “bpftool map lookup/update”:
# bpftool map pop/dequeue/peek <map>
# bpftool map push/enqueue <map> value <val>
# bpftool map pop/dequeue/peek <map>
# bpftool map push/enqueue <map> value <val>

[35] Want to check what BPF features are supported on your system?
# bpftool feature probe kernel
Dumps a list of BPF-related kernel config options and sysctl values, as well as availability of bpf() syscall, supported BPF program and map types and supported helper functions.
# bpftool feature probe kernel
Dumps a list of BPF-related kernel config options and sysctl values, as well as availability of bpf() syscall, supported BPF program and map types and supported helper functions.

[36] In addition to plain output and JSON, the list of BPF features supported on the system can be dumped by bpftool as a set of macros, ready for inclusion in a C header file. After all, BPF is about programming!
# bpftool feature probe kernel macros [prefix <namespace_prefix>]
# bpftool feature probe kernel macros [prefix <namespace_prefix>]

[37] Avoid grepping plain output from bpftool, esp. in scripts. Prefer JSON output (more stable/consistent). Use jq: for example, get IDs of XDP programs attached to eth0 with:
# bpftool -j net show | \
jq '.[].xdp[]|select(.devname == "eth0")|.id // .multi_attachments[].id'
# bpftool -j net show | \
jq '.[].xdp[]|select(.devname == "eth0")|.id // .multi_attachments[].id'

[38] As @JesperBrouer pointed out, bpftool is packaged for RH/Fedora. But no official package yet for Debian/Ubuntu (we have a .deb with a statically-built binary on @Netronome's support website though help.netronome.com/support/soluti…). I hope this get fixed soon. bugs.debian.org/cgi-bin/bugrep…
@JesperBrouer @Netronome [39] As you might expect, bpftool also works for BPF hardware offload. You can list, load, dump, etc. programs and maps offloaded to a SmartNIC. You can also probe BPF features supported by the hardware:
# bpftool feature probe dev <ifname>
# bpftool feature probe dev <ifname>
[40] When listing BPF programs and maps, bpftool has a “--bpffs” option (short name: “-f”) to print the path(s), if any, where those objects are pinned in the virtual file system. For example:
# bpftool prog show --bpffs
# bpftool -f map
# bpftool prog show --bpffs
# bpftool -f map

And with this, I'm done with the “one-a-day” bpftool tweets. I'll slow down, and come back to this thread as new features get added to the tool or as I find new things to say. Do not hesitate to shout if I omitted important stuff, or let me know if you have questions. Thanks!
[41] (It didn't take long!)
bpftool just got support for dumping BTF information for BPF programs or maps, for a loaded BTF object, or from an object file containing one.
# bpftool btf dump <btf_source>
Details in the doc: git.kernel.org/pub/scm/linux/…
bpftool just got support for dumping BTF information for BPF programs or maps, for a loaded BTF object, or from an object file containing one.
# bpftool btf dump <btf_source>
Details in the doc: git.kernel.org/pub/scm/linux/…
[42] bpftool now has a “-d|--debug” option to print debug-level information from libbpf and (when attempting to load BPF programs) from kernel verifier, even when all steps succeed.

[43] There is a wrapper around bpftool to pass map values, or dump them, in a more intuitive way (at the moment, for integers and IPv4 addresses).
https://twitter.com/StamusN/status/1146107005377097730
[44] bpftool can run programs with BPF_PROG_TEST_RUN command available for some prog types. Manually trigger a run for a program loaded in the kernel, on input data/context provided by the user:
# bpftool prog run PROG data_in <file> data_out <file>
(More options in man page)
# bpftool prog run PROG data_in <file> data_out <file>
(More options in man page)

[45] We can now list all BTF objects loaded in the system with bpftool (in addition to seeing BTF object attached to a given program or map):
# bpftool btf [show|list]
# bpftool btf [show|list]

[46] bpftool can be used to “freeze” maps (make them read-only from user space, permissions unchanged from BPF program side). You may have guessed the syntax:
# bpftool map freeze id 1337
Will be useful for next summer's heat waves!
# bpftool map freeze id 1337
Will be useful for next summer's heat waves!
[47] Like “ip link”, bpftool can attach programs to the XDP hook (and later detach them). The program must be loaded already, and then we would type:
# bpftool net attach xdp id 42 dev eth0
# bpftool net detach xdp dev eth0
(xdpgeneric/xdpdrv/xdpoffload variants also supported)
# bpftool net attach xdp id 42 dev eth0
# bpftool net detach xdp dev eth0
(xdpgeneric/xdpdrv/xdpoffload variants also supported)

[48] At last Ubuntu 19.10 (Eoan) has bpftool packaged! Install with:
# apt install linux-tools-common
(⚠ Note the packaged version misses the disassembler for JIT-compiled instructions.)
# apt install linux-tools-common
(⚠ Note the packaged version misses the disassembler for JIT-compiled instructions.)
[49] Program names can now be used on the command line to tell bpftool what BPF program to work with (as an alternative to program ids, tags, or related path in the BPF virtual file system):
# bpftool prog show name loadbalancer
# bpftool prog show name loadbalancer
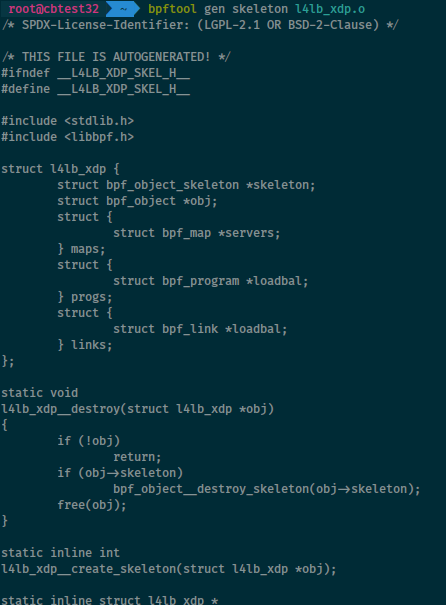
[50] bpftool can generate a “skeleton” header file from a BPF program for inclusion in user space apps managing this BPF prog. Pass the BPF object file to bpftool:
$ bpftool gen skeleton bpf_prog.o > user_prog.h
Then include "user_prog.h".
Details in “bpftool-gen” man page.
$ bpftool gen skeleton bpf_prog.o > user_prog.h
Then include "user_prog.h".
Details in “bpftool-gen” man page.
[51] Let's profile BPF… with BPF! Latest bpftool can attach progs (fentry/fexit) to entry/exit of BPF programs and use perf events to collect stats.
# bpftool prog profile <prog> <metrics>
Screenshot from bpftool-prog man page.
Requires that kernel was compiled with BTF info.
# bpftool prog profile <prog> <metrics>
Screenshot from bpftool-prog man page.
Requires that kernel was compiled with BTF info.

[52] bpftool can list/dump/register/unregister BPF-implemented “struct ops” used to substitute to kernel operations (e.g. for now “struct tcp_congestion_ops” for custom TCP congestion algos, see also git.kernel.org/pub/scm/linux/…).
# bpftool struct_ops …
See man bpftool-struct_ops.
# bpftool struct_ops …
See man bpftool-struct_ops.

[53] Linux' “bpf_link” abstraction is used to represent and manage links between BPF programs and hooks (lore.kernel.org/bpf/2020022822… for details).
And bpftool can show or pin (to bpffs) such links:
# bpftool link show
# bpftool link pin id 27 /sys/fs/bpf/my_link
And bpftool can show or pin (to bpffs) such links:
# bpftool link show
# bpftool link pin id 27 /sys/fs/bpf/my_link

[54] BPF “iterators” use “seq_ops” to help iterate on kernel data (think /proc -like info created with BPF, details in lore.kernel.org/bpf/2020050917…). To work with such iterators, bpftool got a new “iter” subcommand.
# bpftool iter pin <objfile.o> <bpffs_path>
# cat <bpffs_path>
# bpftool iter pin <objfile.o> <bpffs_path>
# cat <bpffs_path>

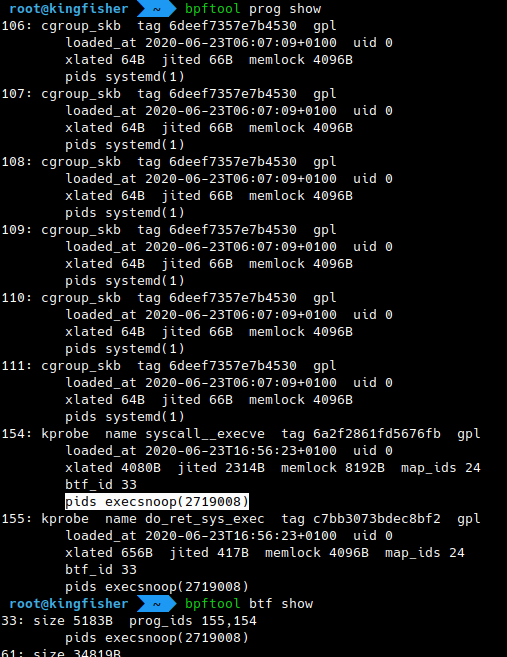
[55] A great addition to bpftool's listings: it can show the PIDs and names of processes holding file descriptors to BPF programs, maps, links, and BTF objects! Just try:
# bpftool prog show
# bpftool map
# bpftool link
# bpftool btf
(Bpftool must be compiled with BTF/CO-RE.)
# bpftool prog show
# bpftool map
# bpftool link
# bpftool btf
(Bpftool must be compiled with BTF/CO-RE.)
One year already since I last updated this thread! During this time bpftool gained a few features. Most of them are for advanced use cases, but some are great to know. It seems like it's a good time to catch up.
https://twitter.com/lizrice/status/1407295204353249280
[56] More on iterators: bpftool now supports “map iterators” to apply in-kernel filtering, aggregation, etc. to eBPF map entries before dumping them:
# bpftool iter pin <objfile.o> <bpffs_path> map <map_handle>
# cat <bpffs_path>
More on iterators at static.sched.com/hosted_files/d….
# bpftool iter pin <objfile.o> <bpffs_path> map <map_handle>
# cat <bpffs_path>
More on iterators at static.sched.com/hosted_files/d….

[57] Iterators are referenced in the kernel by eBPF links. While bpftool does not support listing iterators directly, they can be found in the lists of loaded programs or of existing links. The latter provides additional context information, such as the target's name and map id.

[58] We can now embed custom metadata into eBPF programs (git.kernel.org/pub/scm/linux/…). Guess what tool you can use to dump it.
When metadata is present for a program, it's automatically added to the output of “bpftool prog show”.
When metadata is present for a program, it's automatically added to the output of “bpftool prog show”.

[59] Complement to [45]: listing BTF objects on the system with bpftool now accounts for BTF for the kernel (“vmlinux”) and its modules, if available.
Note the names for kernel/modules, and the “<anon>” (anonymous) names for BTF objects related to programs and maps.
Note the names for kernel/modules, and the “<anon>” (anonymous) names for BTF objects related to programs and maps.

[60] (On @bmcustodio's suggestion)
The version of bpftool is aligned on kernel version, and you can print it with:
$ bpftool version
or
$ bpftool -V
One thing to note is that recent versions will also print the optional features that your bpftool binary may or may not support.
The version of bpftool is aligned on kernel version, and you can print it with:
$ bpftool version
or
$ bpftool -V
One thing to note is that recent versions will also print the optional features that your bpftool binary may or may not support.

[60.5] Optional “features” currently include libbfd support (for dumping JIT-compiled instructions for programs) and bpftool being built with an eBPF “skeleton” (which is necessary, for example, to print the PIDs of the processes using programs, or to use “bpftool prog profile”).
[61] Regarding profiling, bpftool is capable of collecting new metrics: ITLB and DTLB misses for a running eBPF program (“Instruction/Data Translation Lookaside Buffer”, en.wikipedia.org/wiki/Translati…).
# bpftool prog profile <prog> itlb_misses dtlb_misses
# bpftool prog profile <prog> itlb_misses dtlb_misses

[62] An important one, static linking!
Progs in multiple ELF object files can be linked into a single one with bpftool:
$ bpftool gen object output.o input1.o input2.o ...
We can now link functions, subprograms, ... defined in independent .o files. eBPF libraries coming soon?
Progs in multiple ELF object files can be linked into a single one with bpftool:
$ bpftool gen object output.o input1.o input2.o ...
We can now link functions, subprograms, ... defined in independent .o files. eBPF libraries coming soon?


[63] With the -L option, bpftool works with “lightweight skeletons” using specific eBPF progs to call bpf() and load other eBPF objects.
$ bpftool gen skeleton -L prog.o
Debug with:
# bpftool prog load -d -L prog.o
(More at git.kernel.org/pub/scm/linux/… and lwn.net/Articles/85348…)
$ bpftool gen skeleton -L prog.o
Debug with:
# bpftool prog load -d -L prog.o
(More at git.kernel.org/pub/scm/linux/… and lwn.net/Articles/85348…)
By popular demand, I turned this bpftool thread into a blog post. You can read it at qmonnet.github.io/whirl-offload/….
• • •
Missing some Tweet in this thread? You can try to
force a refresh


