This is something I’ve been thinking about last few months: how you can review and find setups yourself, preferably high r/r and the idea behind tight stops.
Going to be a long thread.
Going to be a long thread.
First off, most of it is derived from other people, mostly ICT’s methods, but the thing is you have to build something that works for you based on what works for you.
I’ll go through what I derived from it below.
I’ll go through what I derived from it below.
From what I experienced, shooting for high R/R can be nice but you have to be really really realistic with yourself and more specific for the trades you’re taking. Stupid stuff is possible but only if everything lines up.
I’m doing this thread since I saw a someone breaking down an ‘ideal’ trade which made the pieces fit together and seeing what could be possible. Wouldn’t advise going solely for these ones, open up directional trades on perhaps the same pair beside it to cover part of the risk.
So.. if you’re aiming for high R/R, one of the most essentials in my opinion is momentum of price.
The way price gets momentum is once it has no reason to return where it just came from and thus it having a direction.
The way price gets momentum is once it has no reason to return where it just came from and thus it having a direction.
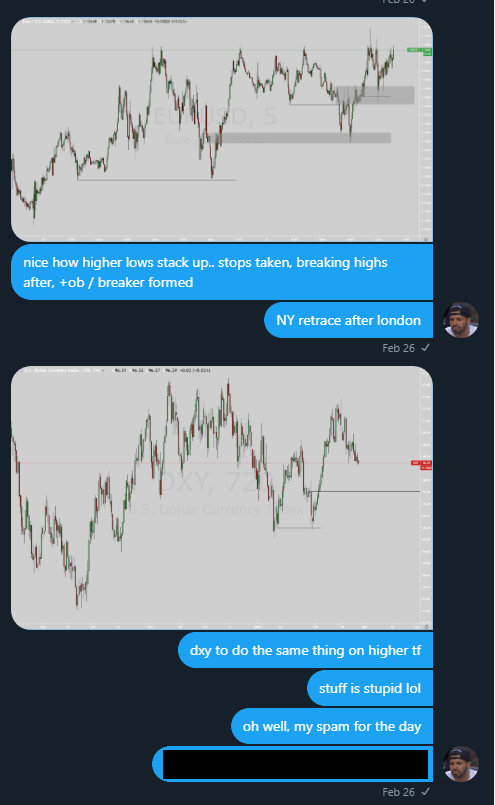
I will use $EURUSD to analyze since I posted some of the trades taken on what we will be looking back on.
The thing I personally often did is drawing out ideal setups in hindsight, to see which parts of a price movement we can objectively determine to hinge a trading setup off.
The thing I personally often did is drawing out ideal setups in hindsight, to see which parts of a price movement we can objectively determine to hinge a trading setup off.
So, what can you objectively use on a chart to set rules for a setup?
What is something you can use that you can repeat in other cases?
What is something you can use that you can repeat in other cases?
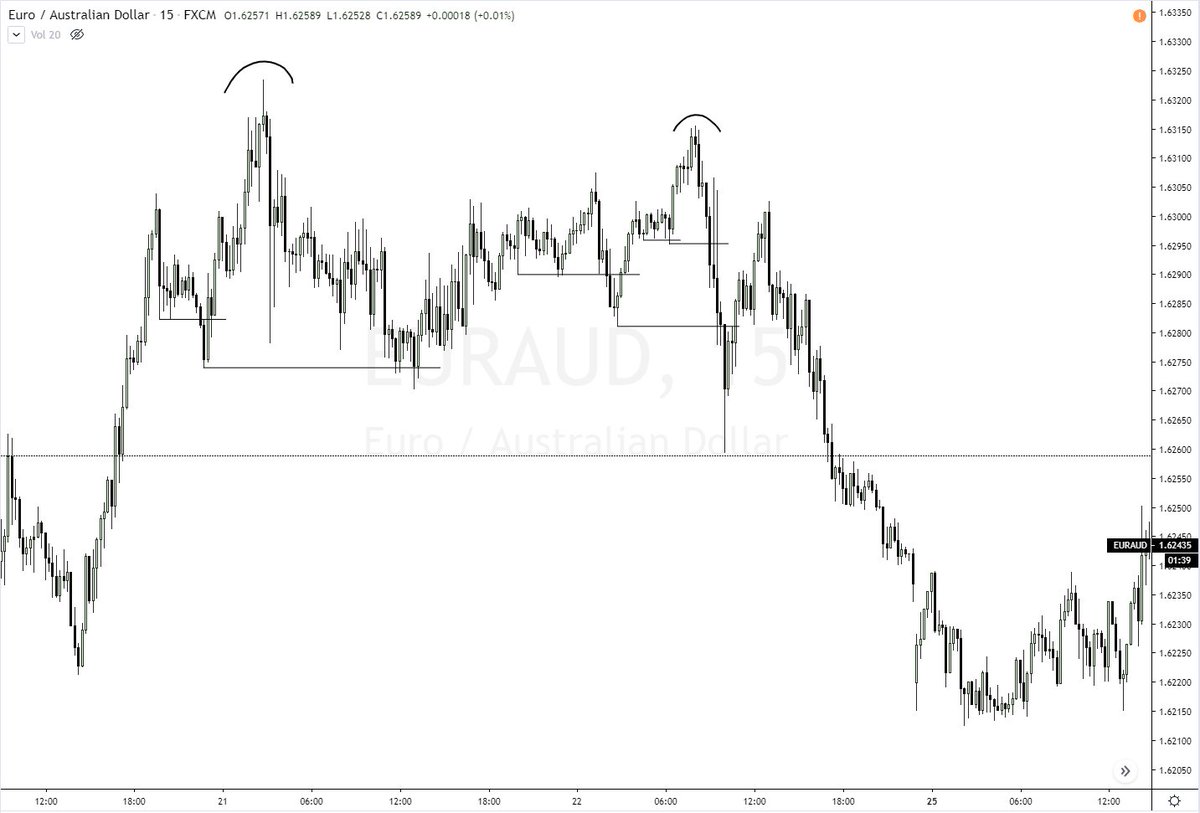
In case of looking for ideal setups, we try to find which characteristics the top of a retracement has before the next leg down which aims at a lower low, in which case you can hold (part) of your trade until the lower low is made.
An example entry for the setup shown in the screenshot above:
https://twitter.com/koningkarell/status/1073536815297150976
Remember:
- Orderblocks as entry for continuation
- Breakers as entry for reversals
- Turtle soup as entry for consolidations
- Orderblocks as entry for continuation
- Breakers as entry for reversals
- Turtle soup as entry for consolidations
So far we have built a ruleset just by reviewing a chart for requirements on a (large) swing trade setup. 


The fifth rule, albeit a small sample size in the screenshot but feel free to go over more, is another characteristic we can objectively define by looking at the chart. 

This is not going to be all you need to know, but it gives some insight in the process how I look at how setups form in a way you can repeat in a next case.
So far, the most important takeaway is: Sell high, buy low.
Obviously, but so far we have determined a way to define extremes: where <<they>> have done their business and how to find this.
Obviously, but so far we have determined a way to define extremes: where <<they>> have done their business and how to find this.
This same dynamic repeats itself across all timeframes, and when you anticipate a reversal during a session time at an extreme point to target a new high or low, that's where the magic happens.
An example can be found here:
An example can be found here:
https://twitter.com/koningkarell/status/1093041175337095168
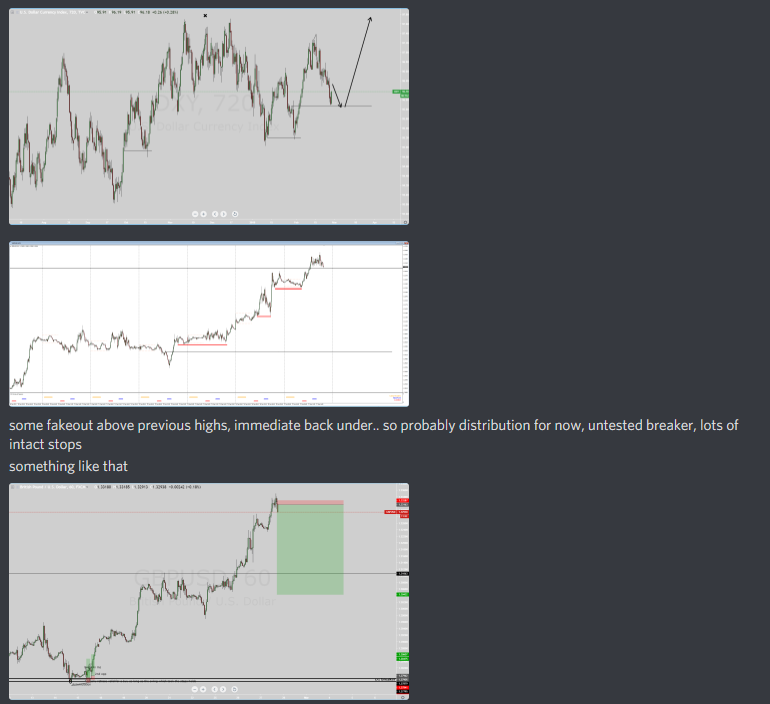
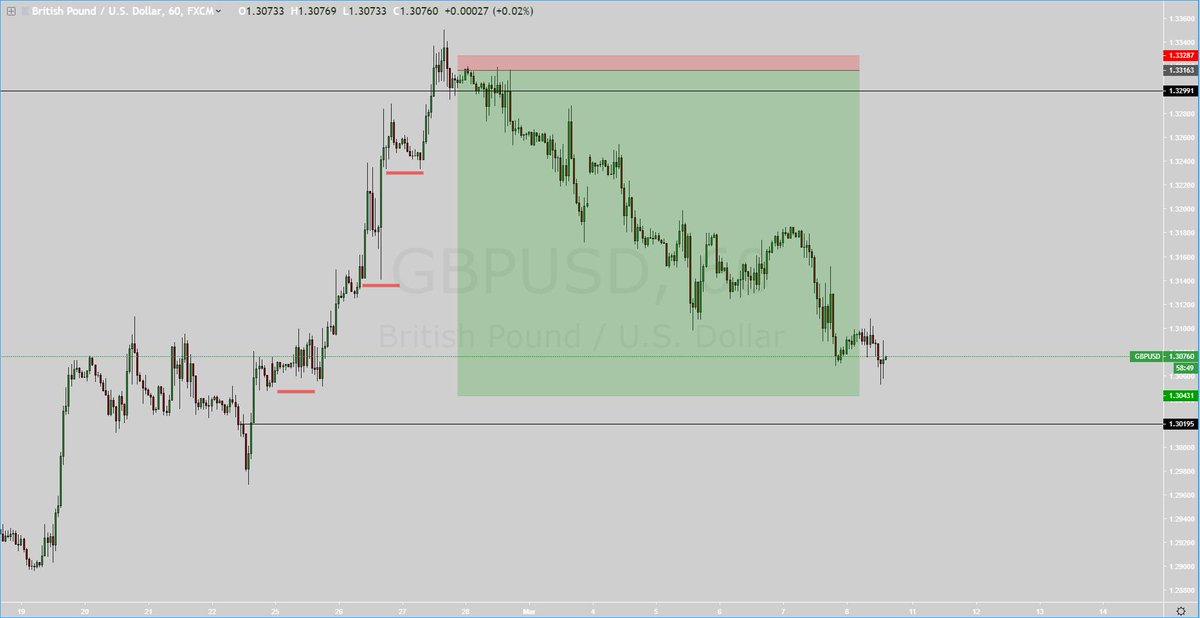
Breaking this trade down combinesthe above, and I will show the most recent $GBPUSD trade as well (which I missed out on, whoops) using the same ruleset as shown in this thread.
Assume highs or lows get formed during session times and respected after, which is likely here.

Assume highs or lows get formed during session times and respected after, which is likely here.


As ridiculous as it may look, when everything fits, and from what we've analyzed before that breakers get respected and what they are used for, we repeat the same on every timeframe as low as you want.. combine this with session times and you can build your own ruleset. 


Zoomed in, multiple timeframes multiple ways to enter, same cycle happening over and over.
Note, I'm ofcourse not having these regularly, sometimes they occur when everything fits.. this is just some basis how to look for them.


Note, I'm ofcourse not having these regularly, sometimes they occur when everything fits.. this is just some basis how to look for them.


The thread about that $GBPUSD trade which occurred at the same time as that $EURUSD setup played out in the tweet above:
https://twitter.com/koningkarell/status/1104020167405768704
Sooo we have analyzed previous behaviour in a trending market on the first leg down, into spotting a reversal based on a turtle soup on the consolidation that followed, and then using those same characteristics to build a trading setup on the next waves down.
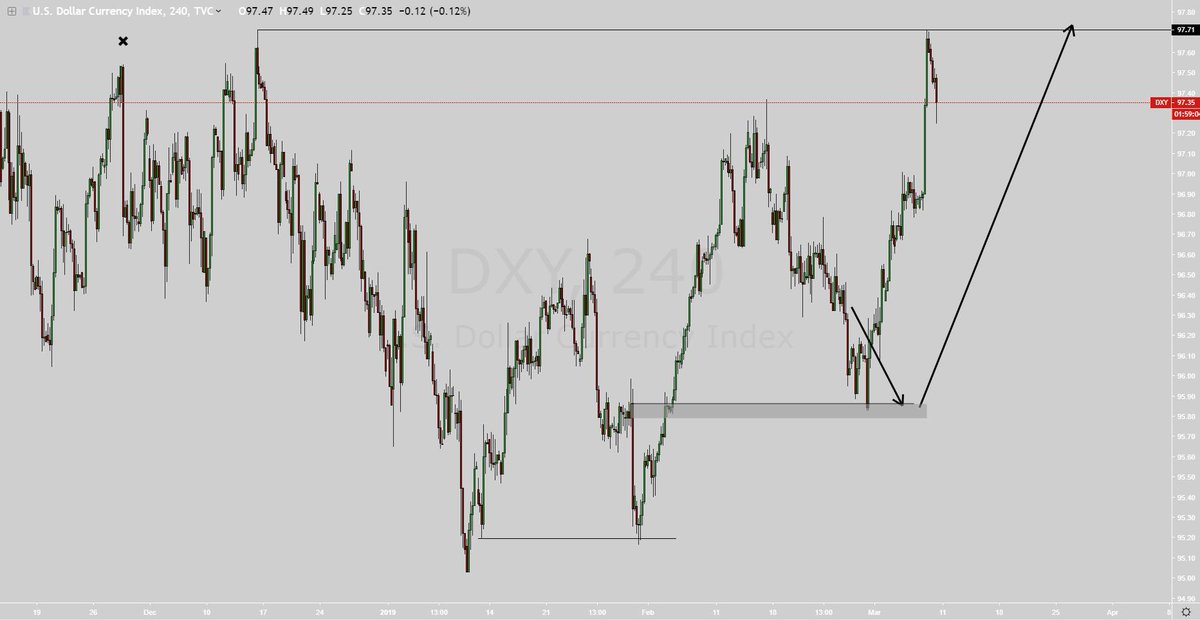
Conclusion: you want to try and define a pattern, block or sequence to define a zone which causes reversals and thus hardly any drawdown.
Which ideal setup can you form on this piece of the chart?
Good luck.. trust me you don't want to hunt these kind of setups everyday since it will drive you mad but the thought process behind it can help you out if you're rushing trades.
Yes there will be a retrace.
Good luck.. trust me you don't want to hunt these kind of setups everyday since it will drive you mad but the thought process behind it can help you out if you're rushing trades.
Yes there will be a retrace.

Btw also don't expect a too high strikerate, which isn't necessary if you nail some of these but still.. and take profits ofcourse, don't be like how I was and let 10R trades turn to minimal wins lol.
Maybe it shows more *when* to let winners run and what to target.
Maybe it shows more *when* to let winners run and what to target.
Oh and a last thing, setups on the 15m chart leads to targets on a 15m chart, daily setups on a daily setup chart, but one occurs in the other which allows you to layer all timeframes and play daily targets based on say a 15m chart.
Ah, and the very last thing and maybe even more important:
This is just one ruleset based on one kind of setup.
Draw out your daily open and see which repeatable characteristics you can find to build a ruleset from to apply intraday and to add to your arsenal.
This is just one ruleset based on one kind of setup.
Draw out your daily open and see which repeatable characteristics you can find to build a ruleset from to apply intraday and to add to your arsenal.
While this is on fx, similar entry techniques can be used in crypto, some examples of a trend in here.. added some nuances in this latest thread but still:
https://twitter.com/koningkarell/status/1062673004759539712?s=21
Wasn't awake at the time, but reviewing it this could've been a short with a tight stop following this ruleset.. key is that it's happening at an important block, these structures form between as well but only when it occurs at an important level there's value to it on low tf. 


• • •
Missing some Tweet in this thread? You can try to
force a refresh


