1/n Spent some time on LexisNexis over the weekend. Depending on your political orientation, what follows will either disturb or encourage you. But regardless of political orientation, I'm sure we can all say 'holy fucking shit'
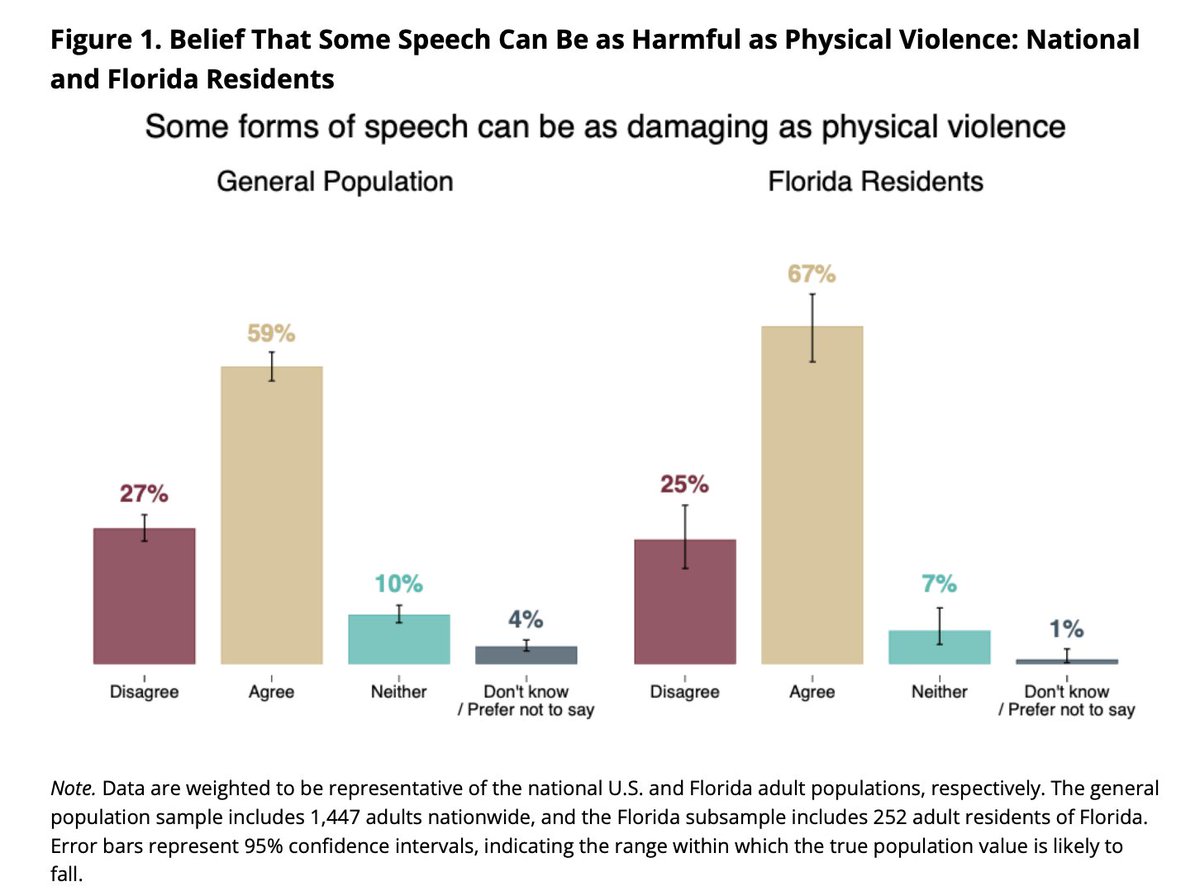
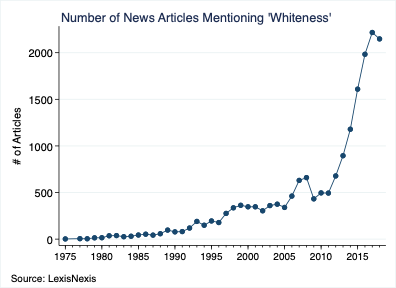
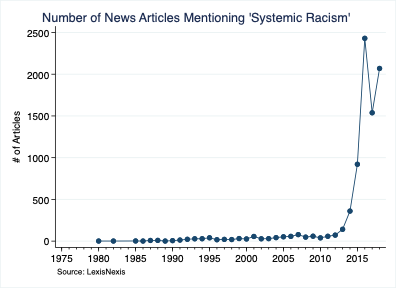
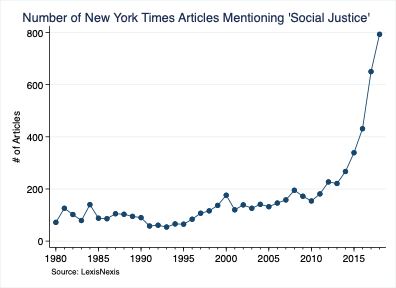
2/n Here's 'holy fucking shit' #1 
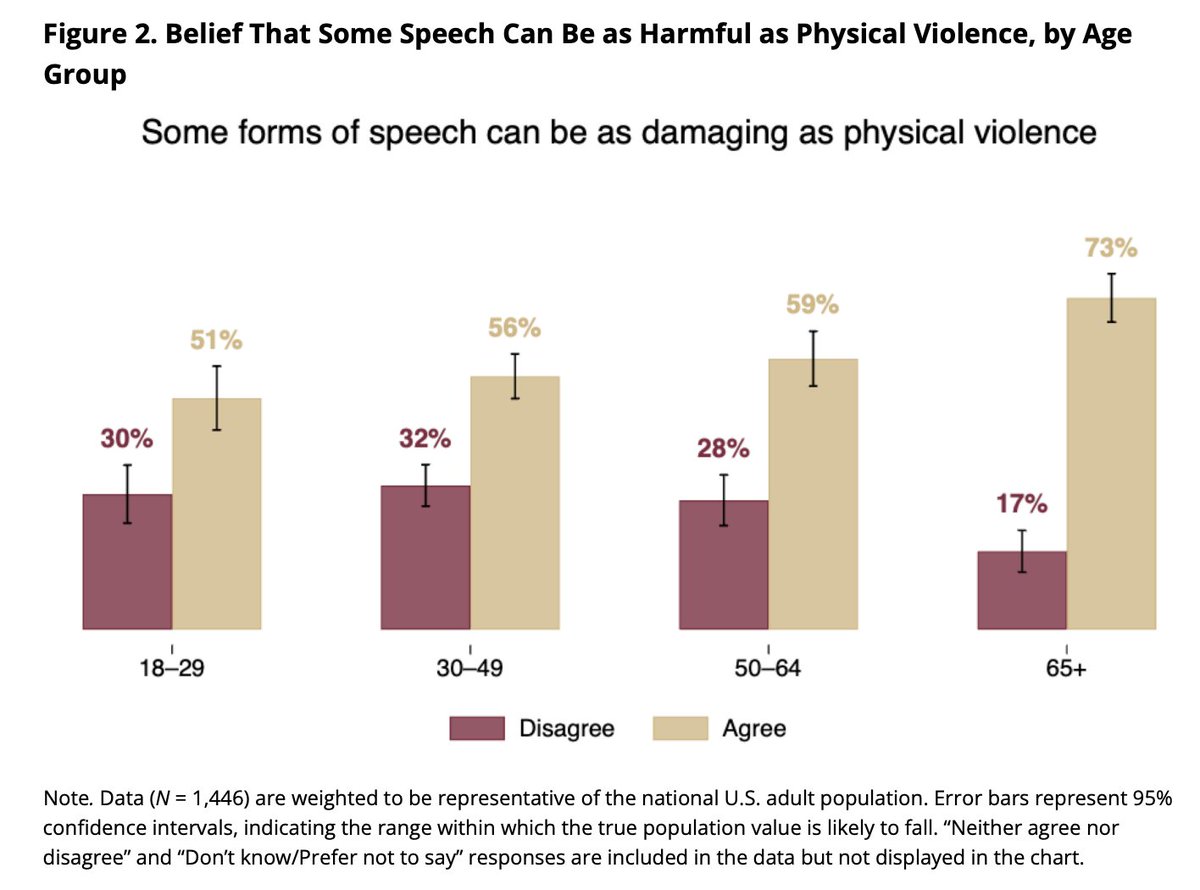
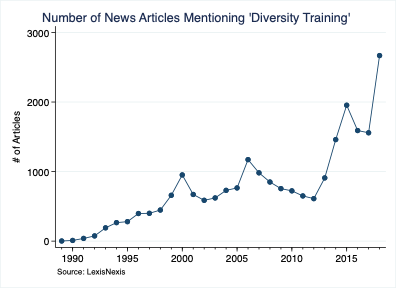
#2
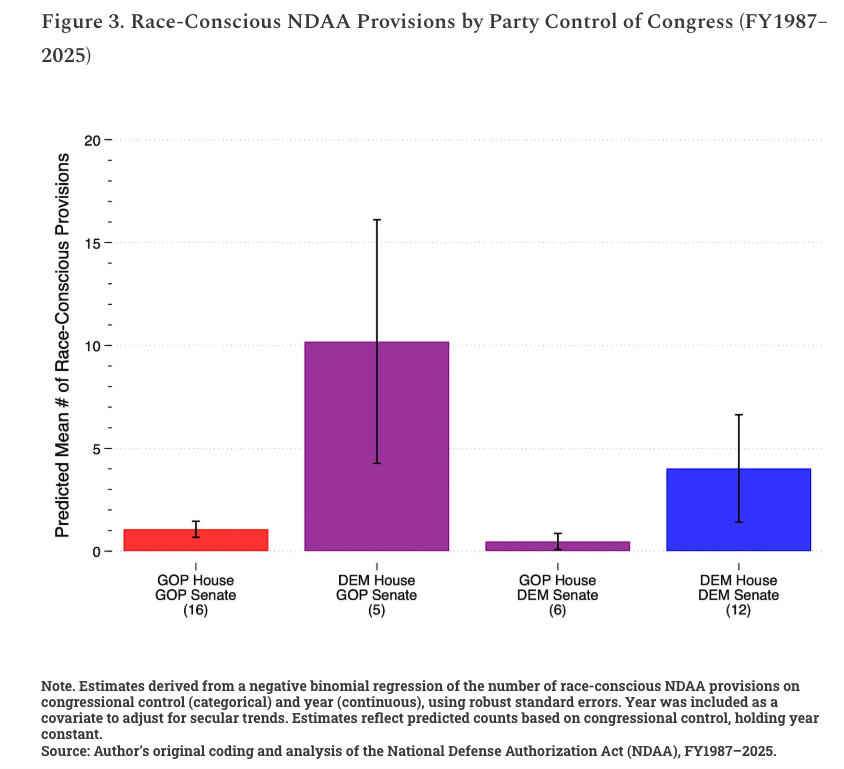
#3
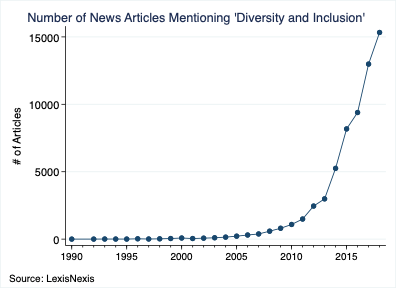
#4
#5
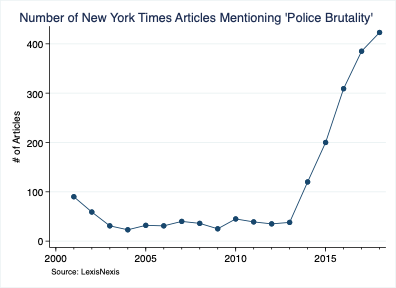
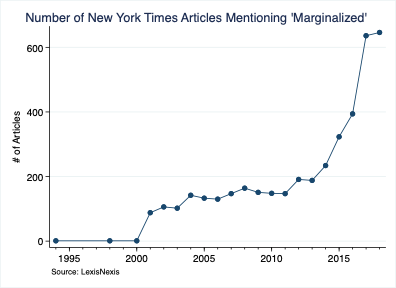
(#6) So many of these graphs look the same that, without the title, it looks like I'm simply reposting a single chart
(#7) If you're looking for a job in a booming industry....
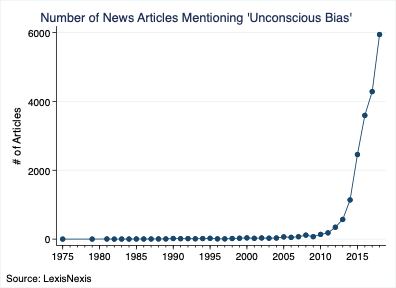
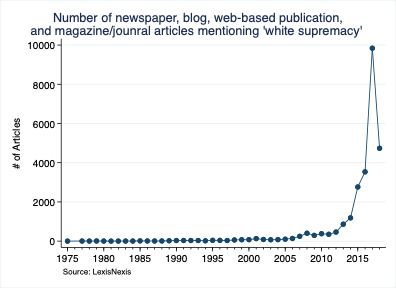
(#8) Some of these terms (such as the one below) turn up so many results that I had to limit the search to a single news source
(#9)
(#10)
#11
#12
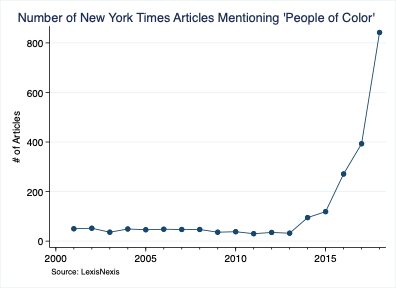
#13 I was telling @rasmansa that I don't recall the term 'people of color' being used so frequently in previous years/decades. Maybe there's something to this...?
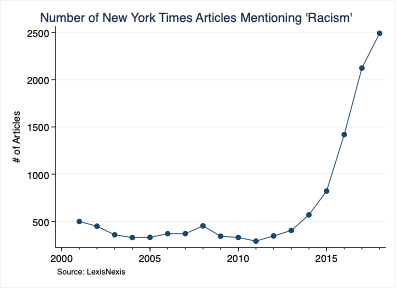
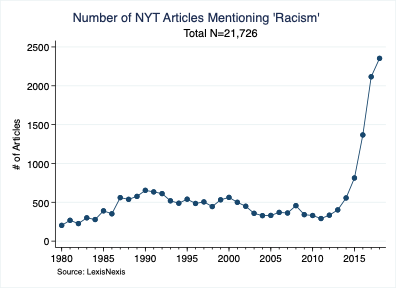
#14: One important thing to keep in mind is that only results for articles which LexisNexis has inventorized are going to turn up. For instance, the trend below technically begins in the 1980s; but only a handful of articles that LexisNexis has for this period mentions 'racism'.
#15: Clear Charlottesville effect
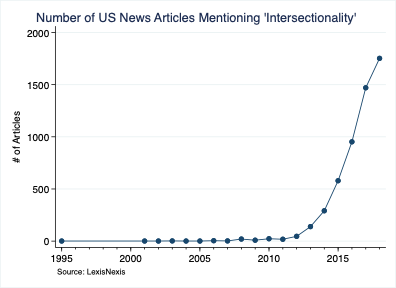
#16 Our future is intersectional
Have a couple more I'm currently working on (including political correctness). Anybody have any other suggestions?
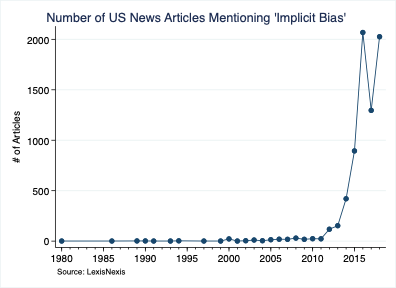
#17 'Unconscious bias' is more frequency referred to than 'implicit bias', but had to check
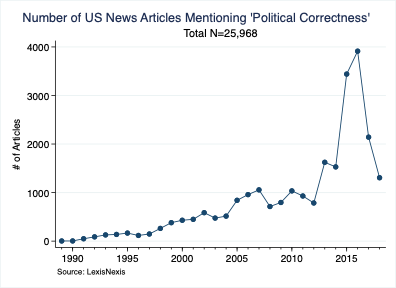
#18 During the 90s, the number of articles (at least on LexisNexis) mentioning 'political correctness' ranged from 4 (1990) to 380 (1990). 2007 was the first year this number entered into the 1000s (1056), which is where it's stayed since 2013.
@C_Kavanagh You asked for RW-related terms. Here's one.
As some of you pointed out, any search term is likely to see an overtime increase (if only due to growth in the number of news outlets/publications). As such, I think it's better to limit the searches to single publications. So here's the trend for 'PC' in the NYT

And here's the number of NYT articles mentioning 'diversity'

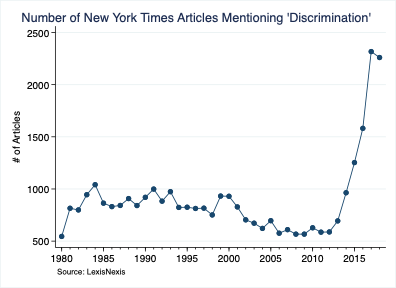
Original NYT Racism graph was actually an undercount. The search was generated with racism in quotations (and quotations should only be used when connecting two words). Here's the corrected figure. Let me see if other graphs are similarly affected.
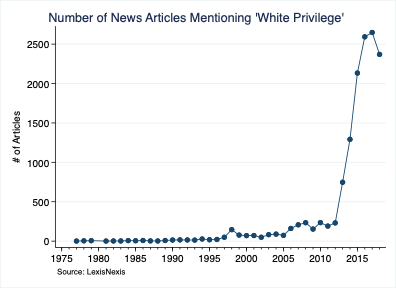
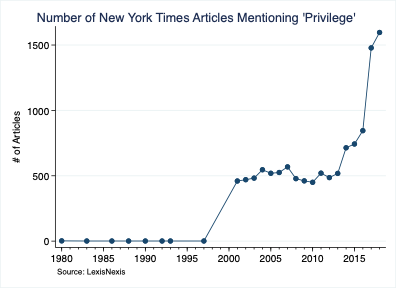
The 'privilege' NYT graph was also an undercount. Obviously, the word 'privilege' need not refer to social/racial privilege. I nevertheless find it interesting that its use has grown tremendously over the past few years. It could be just a coincidence, but I'm skeptical.

Update: Currently working on tallying the annual number of NYT articles between 1980-2018 so I can calculate percentages. The NYT doesn't make this information readily available so I have to 'cheat' by using noise words (e.g. 'the') as search terms.
Update #2: Okay, I've finished one of them. Once again, using 'the' as a search term, I tabulated the number of results for NYT each year between 1980-2018. In the end, it seems that 'racism' mentions grew both in absolute terms *and* as a percent of all listed articles.
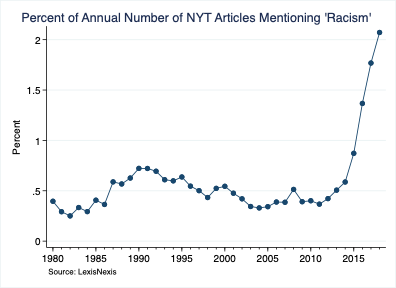
For instance, for 2018, LexisNexis produces results for 113,596 articles--2.07% of which mentioned 'racism'
• • •
Missing some Tweet in this thread? You can try to
force a refresh