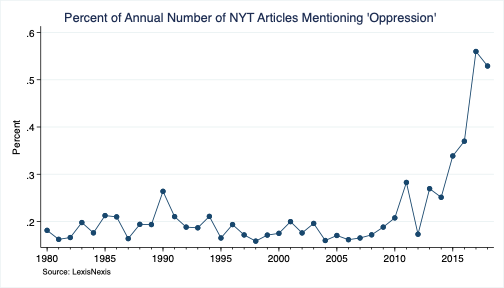
And another 

And another
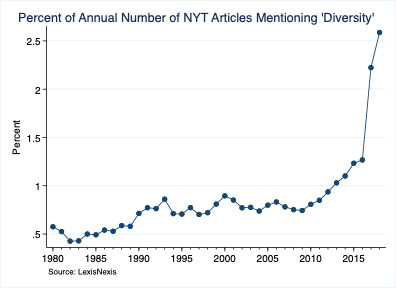
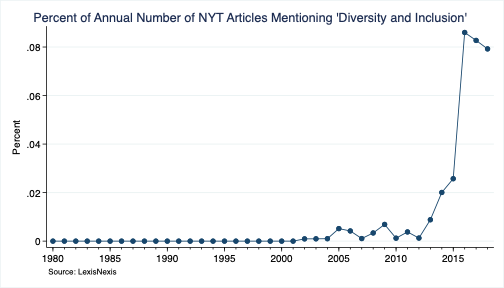
The frequency of 'diversity and inclusion' mentions in the NYT was always low. By 2016, though, 0.086% of articles mentioned it (up from 0.0257% in 2015)
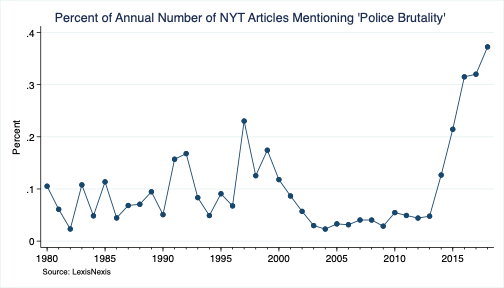
NYT mentions of 'police brutality' reached roughly 0.37% of all articles (or search results) in 2018.
In hindsight, I should have done a combined search for 'racism' and 'racist' (instead I only pulled data on the former). Thus, here's the graph for mentions of 'racist'

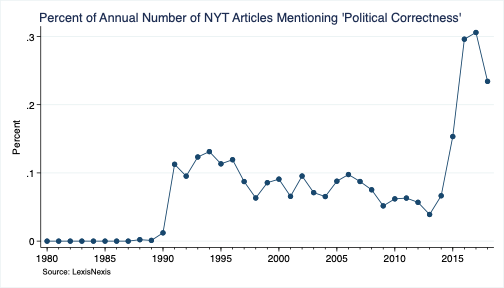
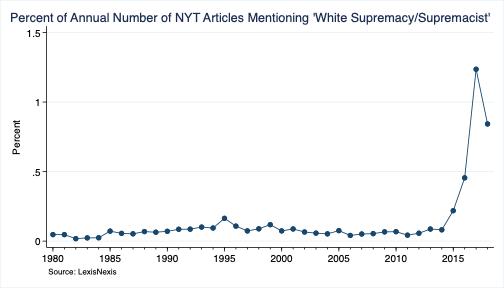
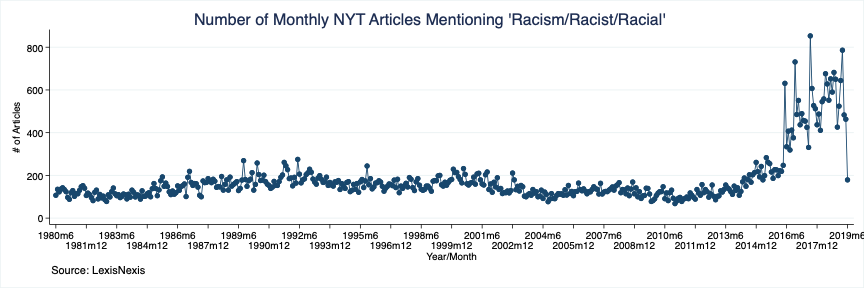
Note that the slope begins pointing upward before 2015, which is consistent with my findings that the 'wokening' was underway before Trump entered the picture.
https://twitter.com/ZachG932/status/1124463150307446784
Here's another new one
And another
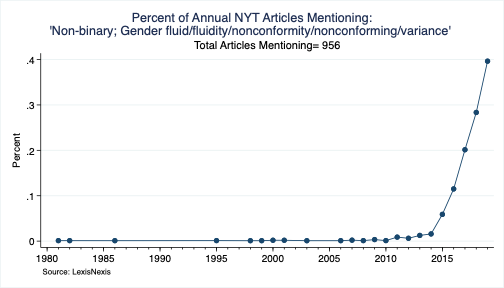
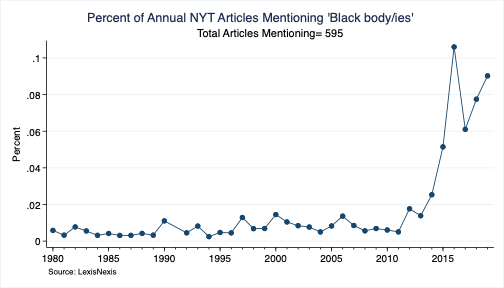
This term was mentioned only 473 times overall--most of the articles of which were published only over the past few years.
Ran a combined search for this one (probably should have just used 'of color')

These terms saw 559 total mentions--most of which, once again, came over the past few years.
This is a less pronounced trend by comparison, though still some growth over the past few years

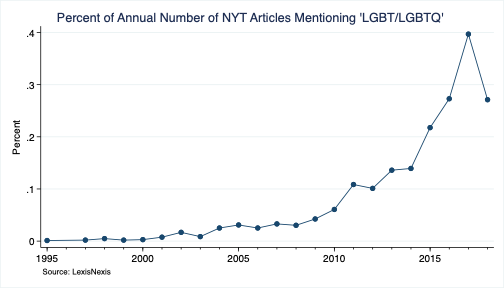
First NYT mention of LGBT (N=1,871) was in 2001
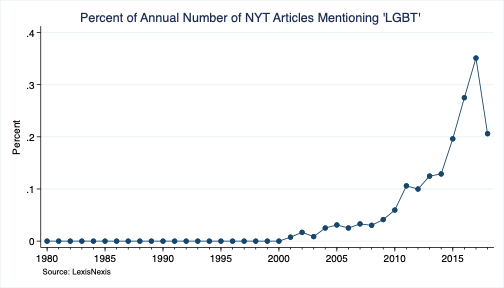
In response to @KatyaSedgwick's suggestion, I ran a combined LGBT + LGBTQ search. Such actually moves the first NYT appearance back to 1995 (though they didn't use the acronym. Impressed that Lexisnexis nonetheless caught it)
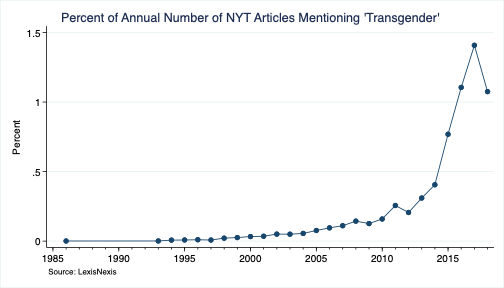
Someone requested a 'transgender' search. Here you go. First (and isolated) mention, believe it or not, was in 1986.
Also saw a request for 'safe space'. First (of 1,036) appearance of these words in the NYT was in a 1983 article on a school ('Safe Space') for the deaf. Something tells me the context of its usage has changed overtime. Anyways, here you have it.


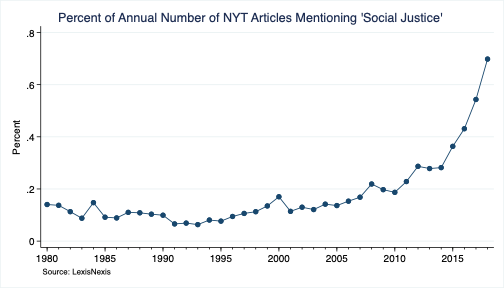
Forgot to run the percentages for 'social justice' (which appears to be trending towards 1% of all NYT articles), so here
Oh, to clear up any confusion: I shifted over to percentages vs. absolute numbers out of concern that the trends were largely a function of increases in NYT article output.
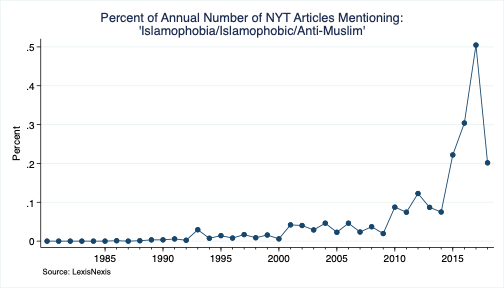
Clear Trump/travel ban effect here, though some small degree of growth in the preceding years.
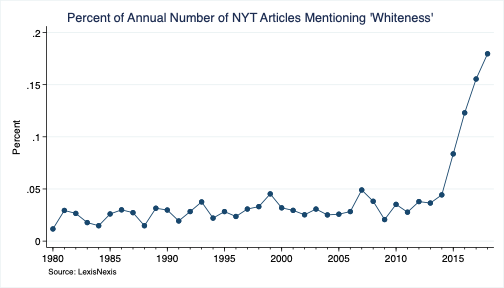
Also forgot to graph for percentages for 'whiteness' (see below). Someone asked me why I didn't calculate the percentages for some of the non-NYT graphs. Short answer: tallying the annual # of NYT articles is a lot more manageable than tallying the annual # of ALL news articles.
Just pulled this one out of my critical theory hat
For comparison, I graphed some random control terms
https://twitter.com/ZachG932/status/1134004282683011072
This graph was the result of a coding error. So as to not mislead (60%?!!), I've deleted it. On your right is the corrected figure


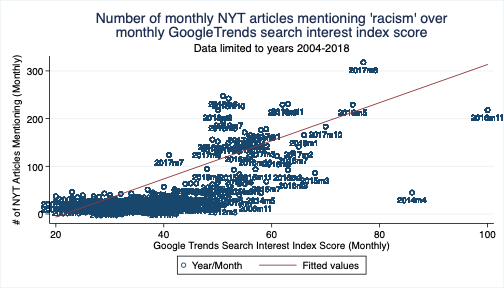
Could very well be a spurious correlation (r=0.714), but the number of monthly NYT articles mentioning 'racism' does correspond to increased Google search interest (note that GoogleTrends begins in 2004, so I had to limit the data accordingly)
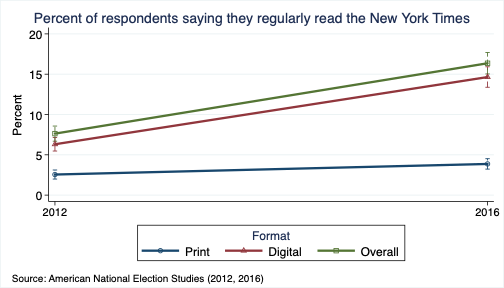
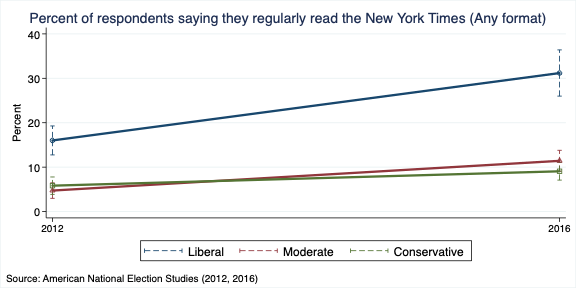
Some potentially relevant contextual data: the percent of people saying they regularly read NYT roughly doubled between 2012-2016. Nearly all of this growth occurred among digital readers (i.e. those who visit NYTOnline).
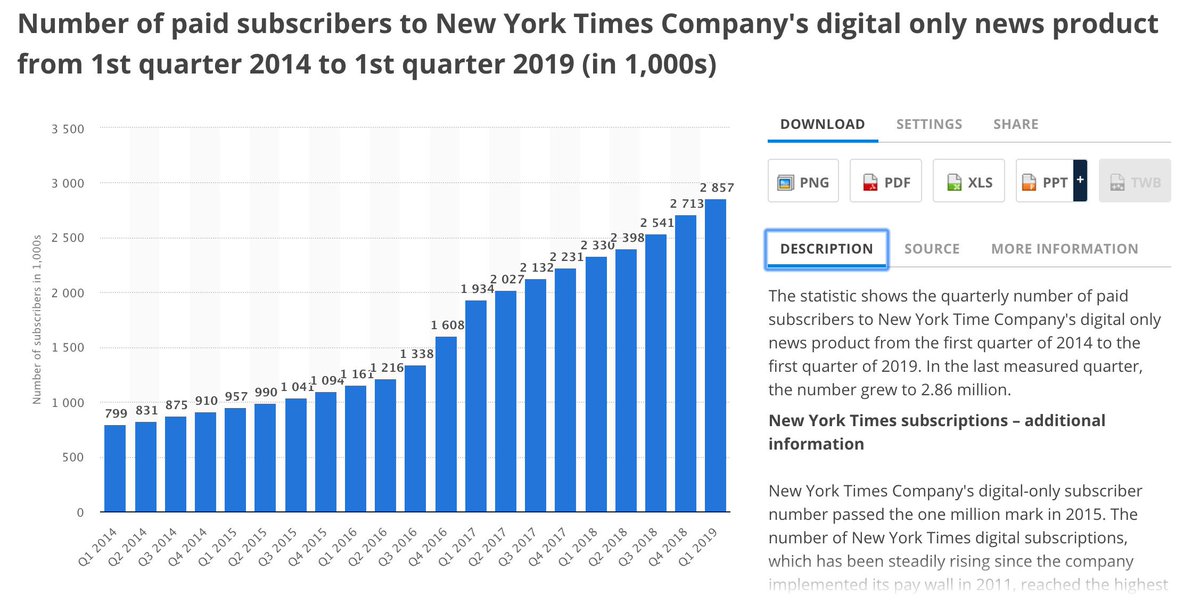
I cross-verified this increase with data from Statista (though it only begins in 2014)
Readership seems to have doubled across the board, but liberals (16%->31%) still (naturally) constitute the majority of readers.
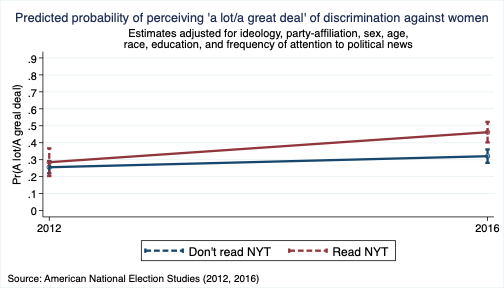
This might be relevant insofar as a) perceptions of the prevalence of discrimination among liberals saw tremendous increases across this period, and b) there's a robust relationship between NYT readership and perceiving more discrimination

Some of you requested it, so here it is
If conservatives would just have more empathy, we could finally redistribute all the wealth, dissolve the borders, pay reparations, sign the GND, and live in an egalitarian multicultural utopia.
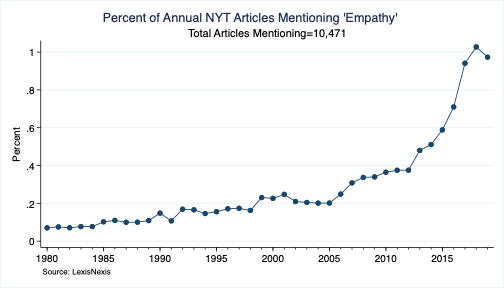
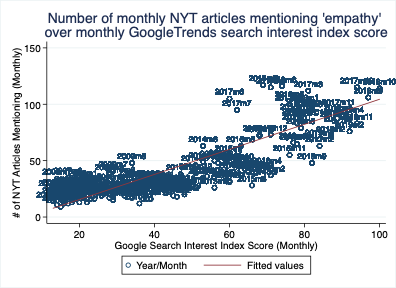
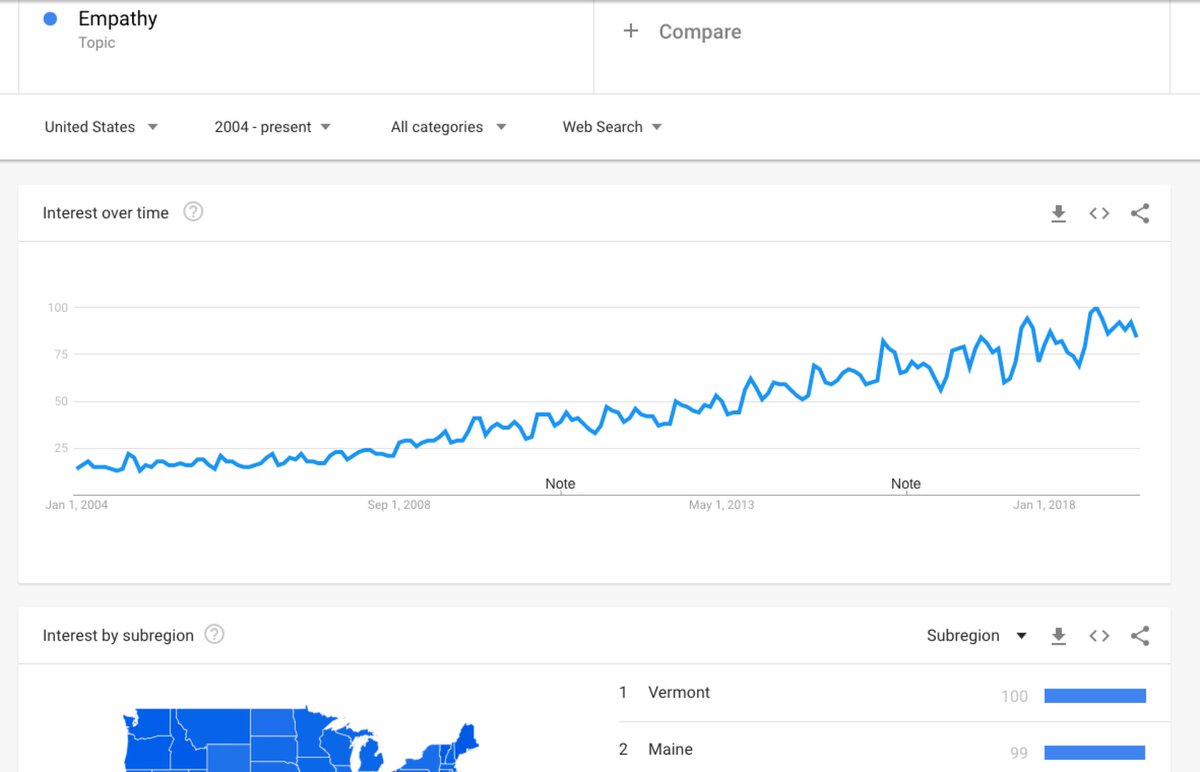
As with racism, the number of monthly NYT articles mentioning 'empathy' closely tracks (r=0.825) Google searches for 'empathy'
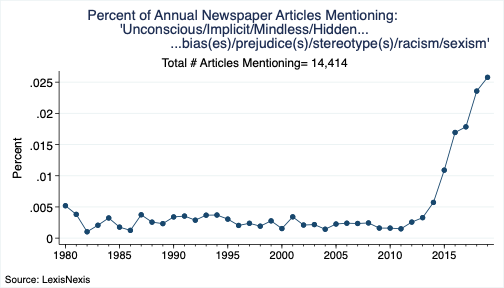
This is over *all* newspaper results per year (not just NYT).
I knew it
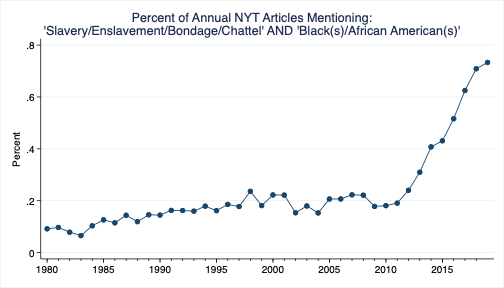
LexisNexis shows results for 190 NYT articles referring to African American enslavement in 2012. That number grew to 805 in 2018.
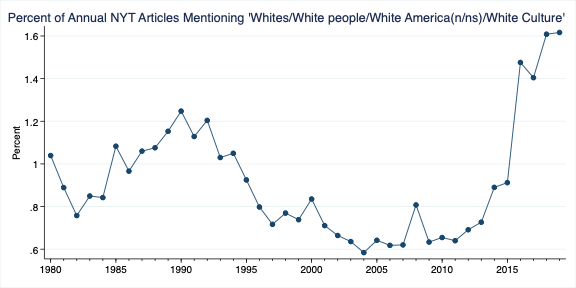
White people have never been more popular. Number of articles mentioning between 2011-2018: 507 (2011), 547 (2012), 577 (2013), 843 (2014), 851 (2015), 1,476 (2016), 1,681 (2017), 2018 (1,827).
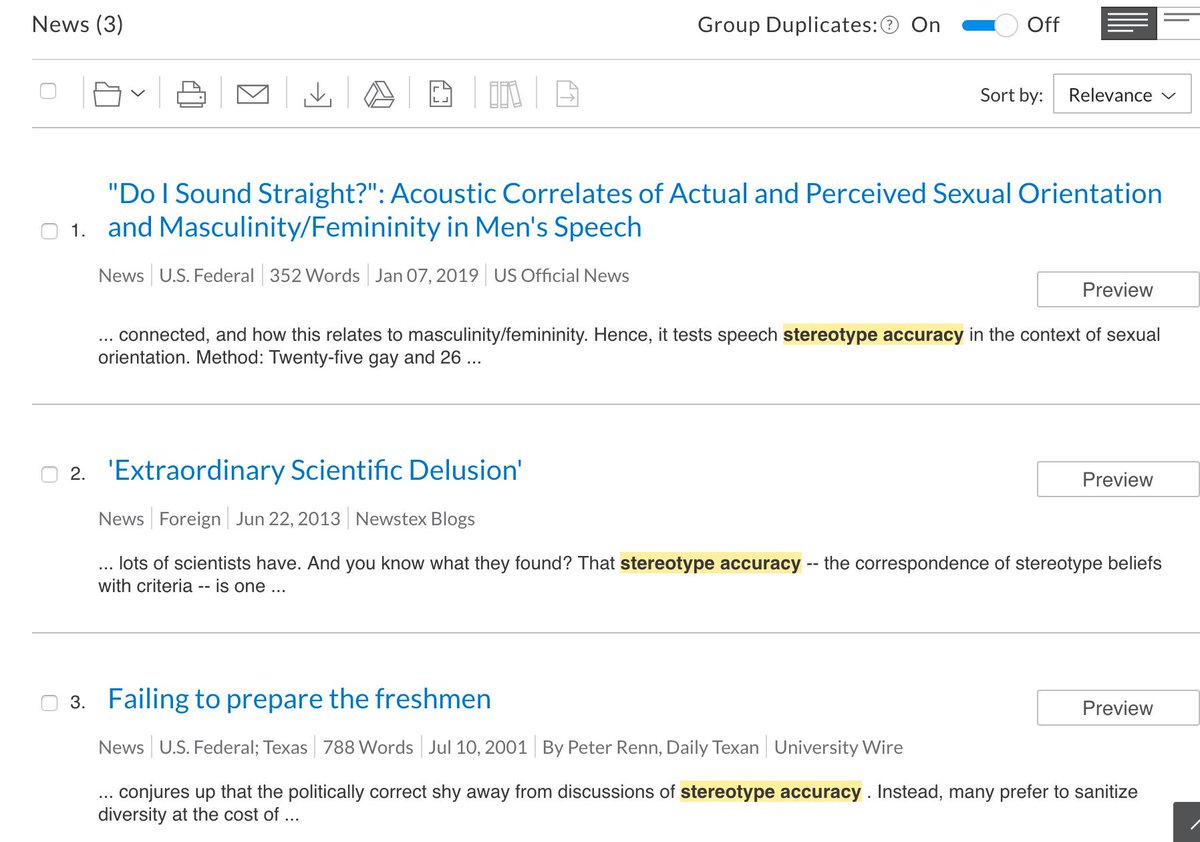
Made this one for you @PsychRabble. Unfortunately, I could find only 3 listings (overall) for 'stereotype accuracy'

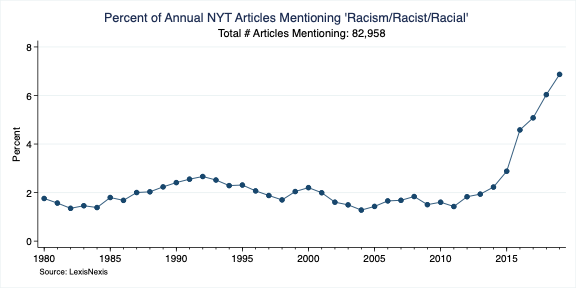
This one probably took the longest to put together. Since 2016, NYT has published roughly 15-30 articles a day that mention these terms, as compared to 2-4 a day in the 1980s.
• • •
Missing some Tweet in this thread? You can try to
force a refresh