
:
1W:
Price at the bottom of the weekly range. Last week closed in a nice fat bullish candle with little to none bearish reaction. This does not confirm the last candle as an SFP as previous swing low was at 107.770 and this one was at 107.815.
1W:
Price at the bottom of the weekly range. Last week closed in a nice fat bullish candle with little to none bearish reaction. This does not confirm the last candle as an SFP as previous swing low was at 107.770 and this one was at 107.815.
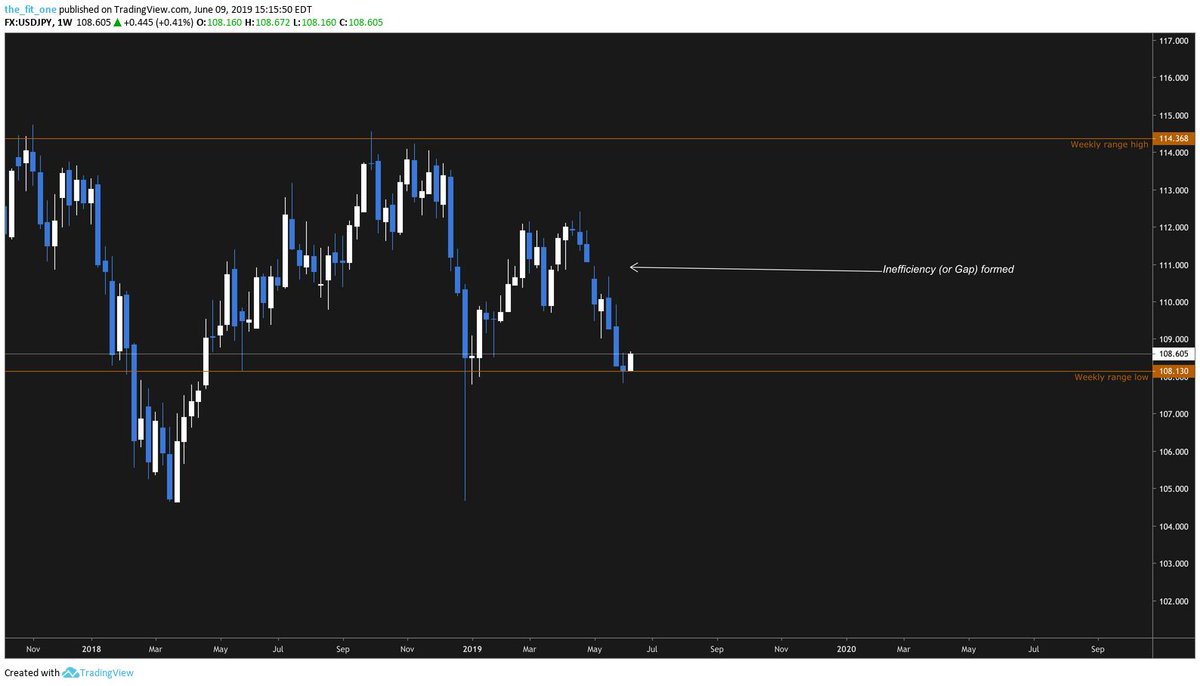
Regardless I would like to see a move to at least mid of the weekly range and fill the gap at 110.60 and 111.083.
1D:
Has been really good textbook PA the past few days. HHs have given way to LHs and HLs to LLs. MS does look bearish here. I would expect next LH to form at the swing point of prior LL. But because price closed as bullish weekly candle at range low and the presence of that gap
Has been really good textbook PA the past few days. HHs have given way to LHs and HLs to LLs. MS does look bearish here. I would expect next LH to form at the swing point of prior LL. But because price closed as bullish weekly candle at range low and the presence of that gap
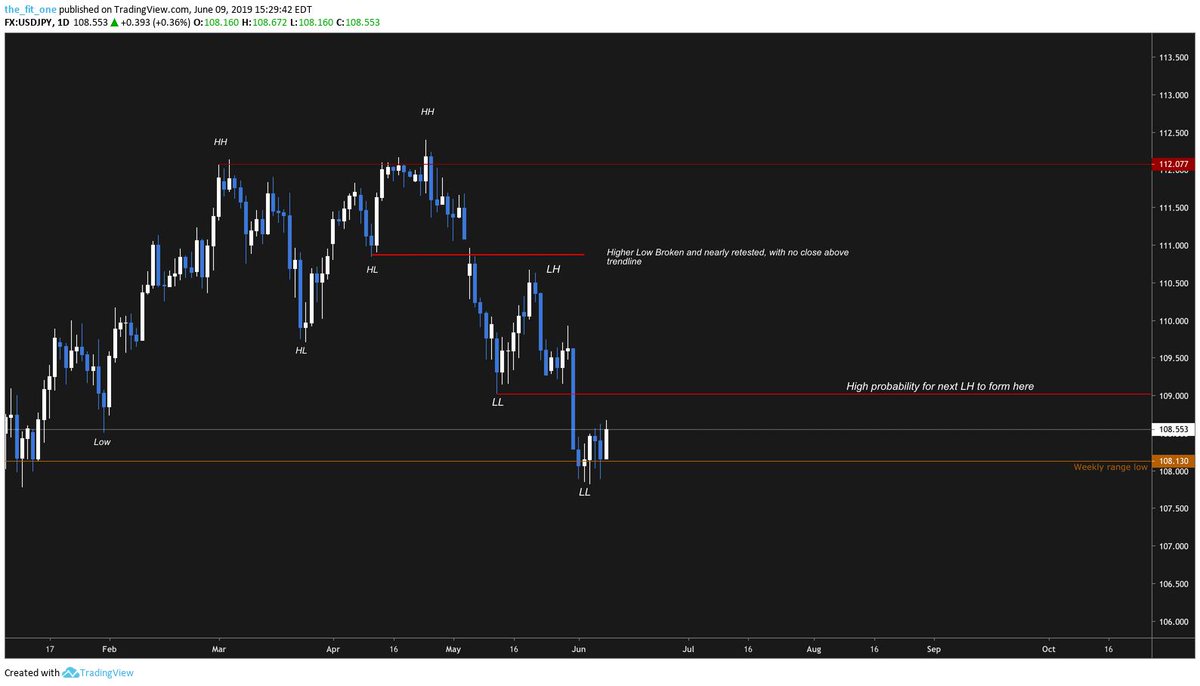
does make me nervous about longing here. That said consolidation at S/R does mean the level has weakened sufficiently. Will wait for further PA to form.
4H:
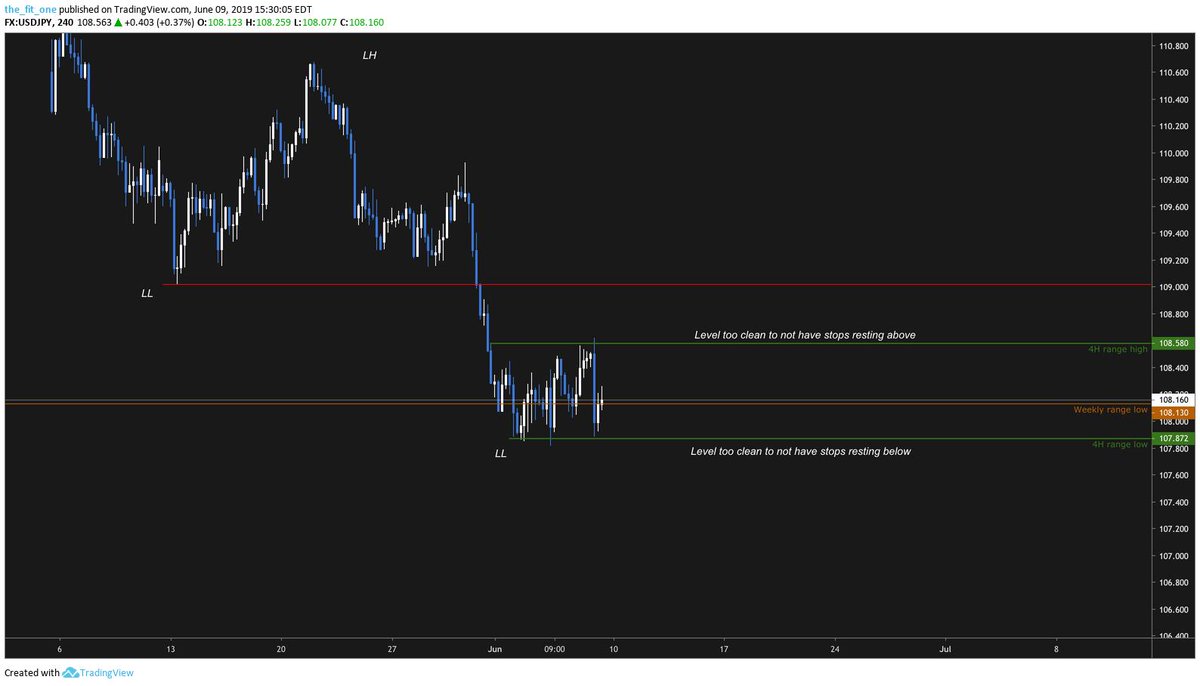
Price is consolidating. There are stops on both sides of range, but range high does look better for price to move to, considering price closed at the bottom of the range. 1H shows the possibility of a bearish OB present b/w range high and the LL trendline at 109.020.
Price is consolidating. There are stops on both sides of range, but range high does look better for price to move to, considering price closed at the bottom of the range. 1H shows the possibility of a bearish OB present b/w range high and the LL trendline at 109.020.
1H:
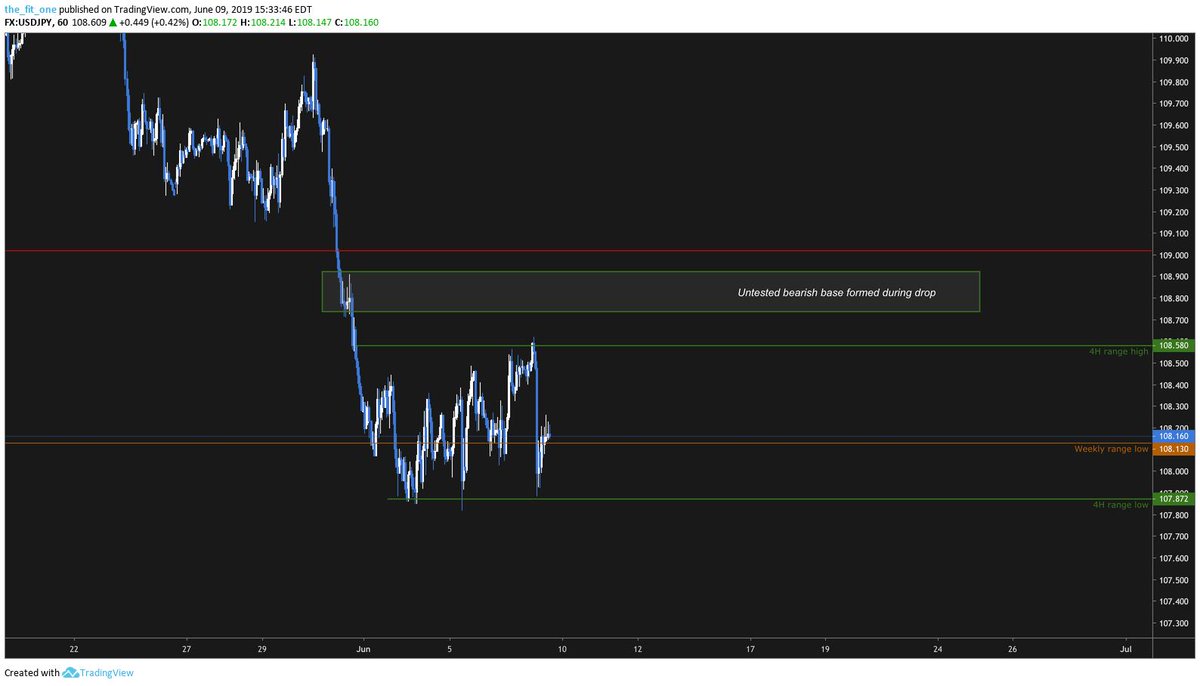
No pronounced OBs here but there is a bearish base formed as price went Drop->Base->Drop. This seems like the ideal place to short, with a SL above the LL trendline.
No pronounced OBs here but there is a bearish base formed as price went Drop->Base->Drop. This seems like the ideal place to short, with a SL above the LL trendline.
Course of action:
Let PA develop on Monday. Alert set above 4H range high to alert me if either a stop run or legitimate move is occurring. Will gauge reaction at the bearish base and LL before entering a short
Let PA develop on Monday. Alert set above 4H range high to alert me if either a stop run or legitimate move is occurring. Will gauge reaction at the bearish base and LL before entering a short
• • •
Missing some Tweet in this thread? You can try to
force a refresh


