
We have two papers out this week!
The first is @PLOSGenetics doi.org/10.1371/journa… on gene regulatory networks during neural crest differentiation in #zebrafish. Some highlights: (1/10)
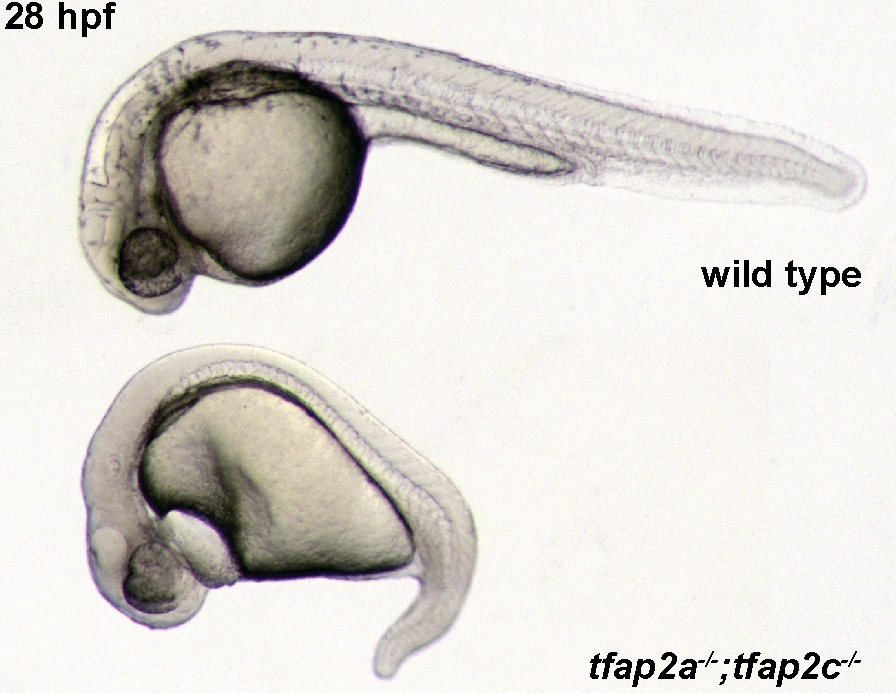
By combining mutant and knockdown experiments the Cornell lab have shown previously that tfap2a/tfap2c double loss zebrafish don’t make neural crest. We confirmed that in double mutants. (2/10) 
One wild-type allele of tfap2c in tfap2a/c double mutants can rescue most of the defects and maintain trunk NC differentiation with only very mild melanocyte defects. But… (3/10)

… while tfap2a-/-;tfap2c+/- embryos look normal during somitogenesis, their gene expression is not normal at all. In fact, in this expt their number of diff. expressed genes is in the same ballpark as that for double homozygous. (4/10)

Turns out this is because tfap2c is really not great at compensating tfap2a loss for genes enriched for tfap2 binding motifs. Plot in next tweet shows expression of mmp28 across all nine possible genotype combinations. (5/10)
The effect of insufficient rescue by tfap2c is already noticeable in tfap2a heterozygotes, the three genotypes on the left, but more pronounced in tfap2a homozygotes in the middle. (6/10)

But luckily for any embryo with at least one wild-type tfap2c allele it’s good enough to drive 2nd tier genes that have no tfap2 motif enrichment, but are highly enriched for NC expression patterns. For these genes only losing all four tfap2 alleles has an effect. (7/10)

This separation of morphological and molecular phenotype means we can use the rumblings in the NC GRN to identify NC genes without being distracted by expression changes due to tissue loss. (8/10)
We also followed up some candidates from the expression profiles by making mutants. To our surprise this showed that losing maternal yap1 mRNA causes melanocyte defects at 30 hpf (9/10)

All datasets, among them expression profiles of sox10 and mitfa mutants at various time points, are available @figshare and ENA. The tfap2a/tfap2c dataset can also be browsed @ExpressionAtlas here: ebi.ac.uk/gxa/experiment… (10/10)
The other is out @NatureComms doi.org/10.1038/s41467…
This work was part of the @dmdduk programme which has phenotyped embryonic lethal mouse mutants. (1/11)
This work was part of the @dmdduk programme which has phenotyped embryonic lethal mouse mutants. (1/11)
We have used RNA-seq to study the gene expression changes underlying embryonic lethality. Embryonic lethality is preceded by great variability and general developmental delay as shown in another @dmdduk study wellcomeopenresearch.org/articles/1-1/v2 (2/11)
A lot of mutants are developmentally delayed (as determined by somite number) which has a big effect on the transcriptional profiles. Only the mutants are delayed, so it’s hard to know what is due to stage delay and what is a direct effect of the mutation. (3/11)
So we made a transcriptomic baseline of wild-type embryos from 4 to 36 somites to compare the mutants to as well as their siblings. The baseline allows us to see genes where the mutants are different from their siblings but the same as stage-matched baseline embryos. (4/11)

… And ones which are different in the mutants from both the siblings and the stage-matched baseline. The baseline can also tell us the genes whose expression is most dependent on stage. (5/11)

We can use the transcriptomic data to predict the role of genes and validate using @dmdduk High-Resolution Episcopic Microscopy data (HREM). For example, in the Nadk2 mutant line, haem synthesis and haemoglobin genes are very low … (6/11)
… and there is a lack of red blood cells in the HREM. Compare the arteries circled in each picture. (7/11)

We also noticed multiple mutants showing deregulation of repeat sequences. For example, in the Morc2a line, L1 LINEs are highly expressed in homozygous mutants at a time when they are normally almost completely silent. (8/11)

So that people can view the data and use our baseline to analyse their own data we have created Baseline CompaRe sanger.ac.uk/science/tools/… It’s an #rstats #shiny app that lets people upload our/their data, analyse and make PCA/count plots. (9/11)


Count data for the mutant lines are available to download @figshare doi.org/10.6084/m9.fig… and can be viewed in the Baseline CompaRe App. (10/11)
All the raw data are available in ENA ebi.ac.uk/ena/data/view/…
ebi.ac.uk/ena/data/view/… and the baseline data can be viewed @ExpressionAtlas here: ebi.ac.uk/gxa/experiment… (11/11)
ebi.ac.uk/ena/data/view/… and the baseline data can be viewed @ExpressionAtlas here: ebi.ac.uk/gxa/experiment… (11/11)
• • •
Missing some Tweet in this thread? You can try to
force a refresh


