professional age forecaster Profile picture
Aug 25, 2019 12 tweets 6 min read Read on X
In light of this question, I thought I'd do a little thread on purely practical event-study stuff.

No theory, just a bunch of pictures of how I make event-studies and what you get when you make different mistakes/choices.

I do my event-studies totally by hand. I choose the omitted category, I deal with endpoints myself, and I make the dummies ahead of time.

Here's how:
Then I run my regression and either outreg2 (old) or regsave (newer) the results, add back in the omitted category, and dive into all the details of @Stata graphing syntax:

h/t to @saynikpay and @talgross for the horizontal y-axis labels:
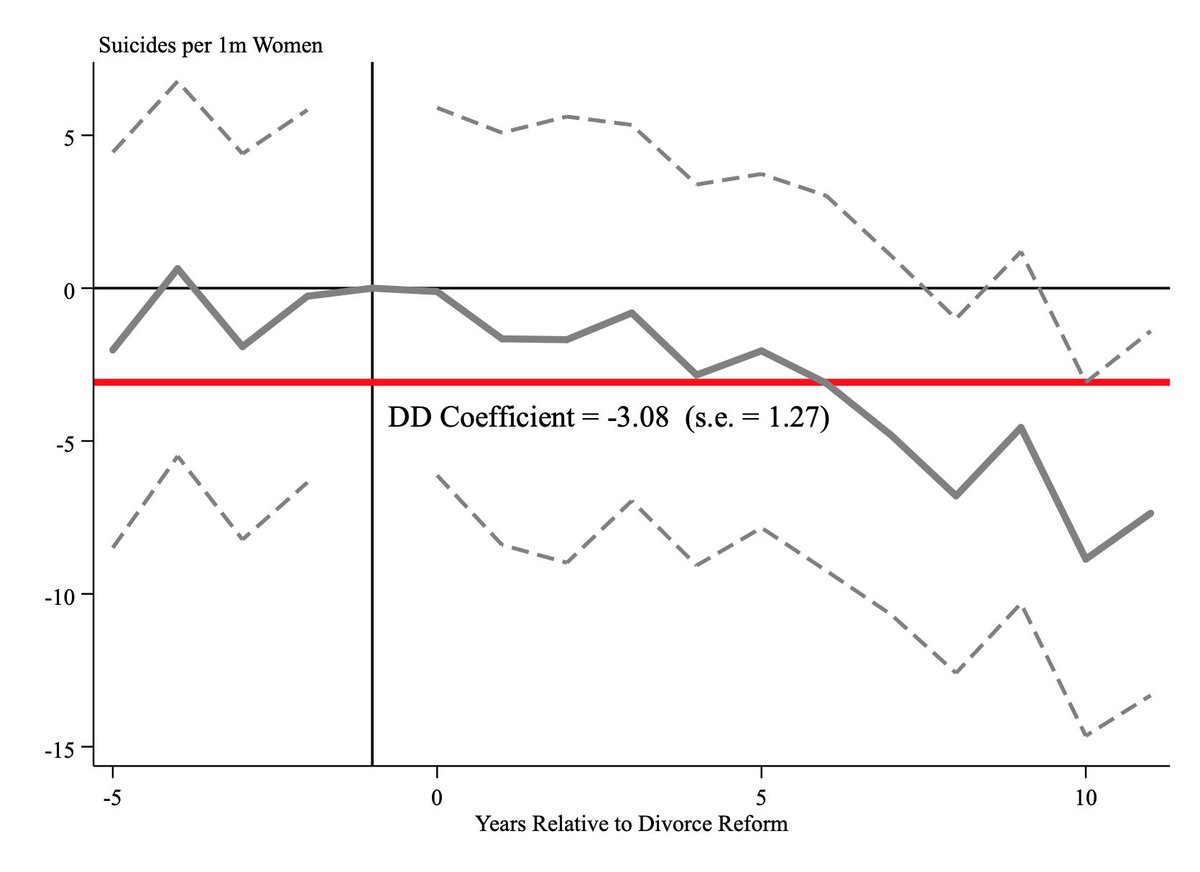
This produces @BetseyStevenson and @JustinWolfers nice event study for no-fault divorce and female suicide rates (which, btw, was so clearly written up that I nailed the figure with no replication files whatsoever!)
Only show coefs from "balanced" event-times. You see some units *way* before/after treatment, but only for the earliest or latest treated ones. Those coefs are partly driven by level diffs b/w units like here. See how weird and noisy things get at the ends? Those aren't "effects"
Bin up the end points (see recode statements above), and estimate those coefs, but do not report them. You can see when papers do this b/c there's a point on the x-axis that's like "12+" and the coef is way different.

Here they don't look that weird, but they often do.
Another option would be to estimate all the event-study coefs but only plot the balanced ones. I don't think it matters much and it really really doesn't matter here:
A very characteristic ES problem is when you forget to include those endpoints. Then "the" omitted category is a combination of -1 and the earliest/latest coefs. It produces a picture with an anomalous dip right at "-1":
I say omit -1, but some people like omitting other pre dummies. It just shifts the whole line. Here's what happens if you omit the earliest balanced pre dummy.

I think it makes the coefs hard to read, but its not a big deal really. (Don't omit unbalanced periods though)
And for fun, lets pick on unit-specific linear trends. This example has no clear pre-trends (their intended target) but it does have time-varying effects (their unintended target). Trends ruin a perfectly good event-study for bad reasons. They just rotate the line around -1
And finally, let me plug my graphing style, which puts one line through coefs and one line through upper/lower CIs rather than connecting with vertical error bars. To me, lines make it easier to evaluate dynamics and approximate what you'd get if you had higher frequency data.
Oh, and I learned all of this working with @martha_j_bailey for the last 10 years!

• • •

Missing some Tweet in this thread? You can try to force a refresh
 

Keep Current with professional age forecaster

professional age forecaster Profile picture

Stay in touch and get notified when new unrolls are available from this author!

Read all threads

This Thread may be Removed Anytime!

PDF

Twitter may remove this content at anytime! Save it as PDF for later use!

Try unrolling a thread yourself!

how to unroll video
  1. Follow @ThreadReaderApp to mention us!

  2. From a Twitter thread mention us with a keyword "unroll"
@threadreaderapp unroll

Practice here first or read more on our help page!

More from @agoodmanbacon

Aug 23, 2022
So @DrJPCunningham and I updated our paper on Legal Services, switching the whole thing from TWFE to Callaway/Sant’Anna (@pedrohcgs)

Learned a ton while doing this and I think our methods section turned out great and help some folks:

goodman-bacon.com/pdfs/cgb_lsp.p…
The key thing is that we need to use control strategies to find a good comparison group. Our (staggered) treatment went mainly to big cities and we chose to use an *untreated* comparison group.

So we faced all the control options available in Sant’Anna/Zhao (@ZhaoBean).
First approach is “outcome regression” using state-by-urban group dummies (up to 3 bins of the 1960 %urban variable defined for every state).

We get mean ΔY for untreated counties in every one of those bins and subtract it from mean ΔY for treated counties in the same bins Image
Read 9 tweets
Apr 5, 2022
Macroeconomists are doing some wicked data entry recently. Three examples I’ve seen probably in the last month alone:
@A_Fieldhouse, Howard, Koch, and Munro digitize UI claims by state and month to extend state level u/e measures back to 1947!

econstor.eu/bitstream/1041… Image
Hoffman, @piazzesi, and Schneider digitized Labor Turnover Survey data on labor flows by city and month for manufacturing back to 1957!

web.stanford.edu/~schneidr/Flui… Image
Read 5 tweets
Nov 1, 2021
I recently dug into @TymonSloczynski's awesome and mind-bending paper, "Interpreting OLS Estimands When Treatment Effects Are Heterogeneous: Smaller Groups Get Larger Weights

people.brandeis.edu/~tslocz/Sloczy…

I had to make some graphs to figure it out and I do love to share a good graph!
the main result is that if you run this:
y = AX + BD + e
you get average of the Average Treatment Effect on the Treated (ATT) and on the Untreated (ATU)

BUT

The weight on ATT is *inversely* proportional to the size of the treatment group. Wait WHAT?
Imagine that this is the distribution of some X in your control group. The height of the dot shows the mean outcome for the control group members and the horizontal position shows their mean value of X.
Read 12 tweets
Oct 26, 2020
Excited to *finally* share an old paper w/ @seth_freedman and @nehamm!

goodman-bacon.com/pdfs/fgbh_medi…

Some folks say "Medicaid kills people" b/c they compare recipients to non-recipients while controlling for "a lot" of things. This is a bad idea.

Medicaid does not kill you.
@Avik, for example, made this argument forcefully in 2011 (and it got lots of political traction) based on a paper in @AnnalsofSurgery. That paper is called "Primary Payer Status *Affects* Mortality for Major Surgical Operations" (emphasis mine):
ncbi.nlm.nih.gov/pmc/articles/P…
It regressed in-hospital mortality on insurance dummies for a sample of surgery patients and controlled for "age, gender, income, geographic region, operation, and 30 comorbid conditions."

We ask whether a cross-sectional research design can get a causal effect of Medicaid.
Read 14 tweets
Sep 9, 2019
Excited to share my paper with @DrJPCunningham on welfare participation and family structure in the 1960s (topics that arouse virtually no controversy whatsoever…)

We document an important role for the War on Poverty's Legal Services Program (LSP):

nber.org/papers/w26238
Family structure was pretty stable from at least 1880-1960. About 10% of mothers were unmarried, usually b/c they were widows.

Then an enormous change. Maybe the biggest demographic phenomenon of the 20th century aside from the baby boom. Single parenthood has almost quadrupled.
Why? Well, lots of ideas have been thrown around: contraception? marriageable men? feminism? welfare?

But evidence about the 1960s is often unreliable or descriptive, and causal evidence often focuses on other periods.

That’s where LSP comes in.
Read 19 tweets
Apr 29, 2019
I want to talk about a simple but illuminating thing: "distribution regression".

You have a design and a continuous outcome, but get noisy junk for the average?

Make dummies, 1{y>x}, move x through support of y, estimate effects on each dummy. Traces out effects on F(y). 1/4
Chernozhukov, Fernandez-Val, and Melly (2013) discuss it in all the metricsy detail, but I have found actually using it to be very straightforward.

Here it is for my long-run Medicaid paper. I get a noisy-ish thing for avg earnings, but really striking effects for the dist. 2/4
Also, because these are effects on CDFs, and the integral of the CDF is the mean, if you multiply each dot by bin size you basically recover the OLS coef on means. Thanks, Riemann! 3/4
Read 8 tweets

Did Thread Reader help you today?

Support us! We are indie developers!


This site is made by just two indie developers on a laptop doing marketing, support and development! Read more about the story.

Become a Premium Member ($3/month or $30/year) and get exclusive features!

Become Premium

Don't want to be a Premium member but still want to support us?

Make a small donation by buying us coffee ($5) or help with server cost ($10)

Donate via Paypal

Or Donate anonymously using crypto!

Ethereum

0xfe58350B80634f60Fa6Dc149a72b4DFbc17D341E copy

Bitcoin

3ATGMxNzCUFzxpMCHL5sWSt4DVtS8UqXpi copy

Thank you for your support!

Follow Us!

:(