msandifo Profile picture
Nov 21, 2019 17 tweets 6 min read Read on X
"Blind Freddy" should be able to see the world is in a bit of a pickle in regard to GHG emissions. Despite the amazing developments in clean energy technology, energy emissions continue to rise in a dance that is tuned to the economy. Image
The challenge in meeting Paris targets (26% below 2005 levels by 2030) is getting worse by the year. For a proportional contribution, the global energy sector already needs to reduce emissions by 4% each year, rising 0.5% in 2018 Image
Global emissions reductions are really hard - energy sector emissions have not reduced by anywhere near 4% any year in the last 40. In fact, only 4 times have annual energy emissions gone down appreciably, and only in significant economic downturns, as most recently in '09. Image
Where does Australia sit in all this and what can it do?
First, some basic Australian energy facts.
1) Australian annual energy sector emissions have grown in absolute terms since 2005 by about 32 million tonnes. Image
2) On a per capita basis Australian energy sector emissions have been falling (since 2007), but not as fast as in other comparable countries such as the US. At 16.6 tonnes CO2e per person per year Australia has the highest per capita emissions of developed nations ("dots" = 2009) Image
3) as evident in the recent drought (following closely on the Millennium drought) so intense that the Darling River (draining 8% of the continent) has ceased to flow, and unprecedented Spring bushfires, etc. Australia is particularly vulnerable to the impacts of climate change
4) A proportionate contribution to meeting Paris targets without recourse to carry-over credits (which many consider to be morally dubious, at best) requires Australia to reduce energy emissions by over 3% each year, and the challenge gets harder as each year of delay passes. Image
Despite only contributing about 1.2% of global energy sector emissions, Australia's extraordinarily high per capita emissions and its unique vulnerability make a strong moral and (long-term)economic case to contribute to the global effort. Image
Given that it seems to be lagging on commitments, what should Australia best do?
Again some facts help inform actions.
1) Australia's electricity sector is doing ok. Emissions are falling rapidly, and are on track ... Image
... mainly because of steep declines in domestic coal use which has been falling at an average rate of 2% per year since 2005. Image
2) Australia's oil emissions/consumption (mainly in road transport) is growing at 1.8% per year slightly above the historical average, largely in line with population increase. Image
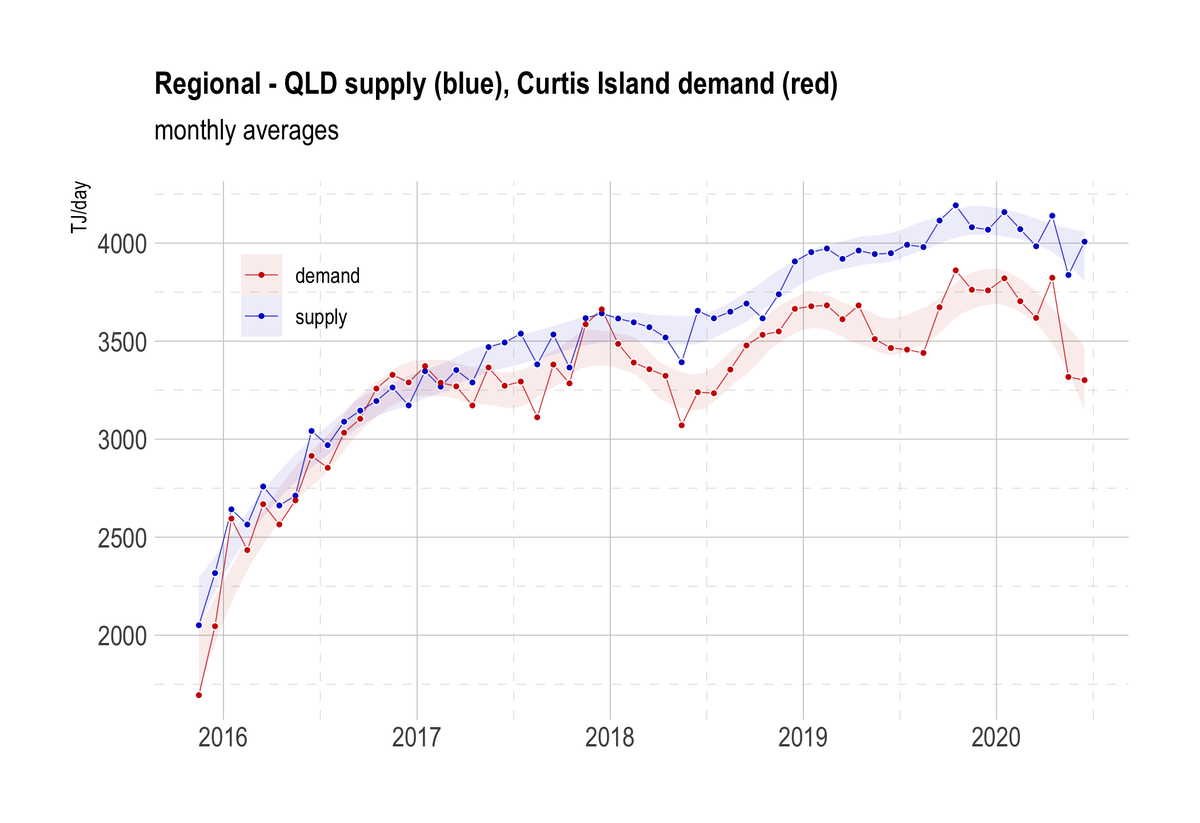
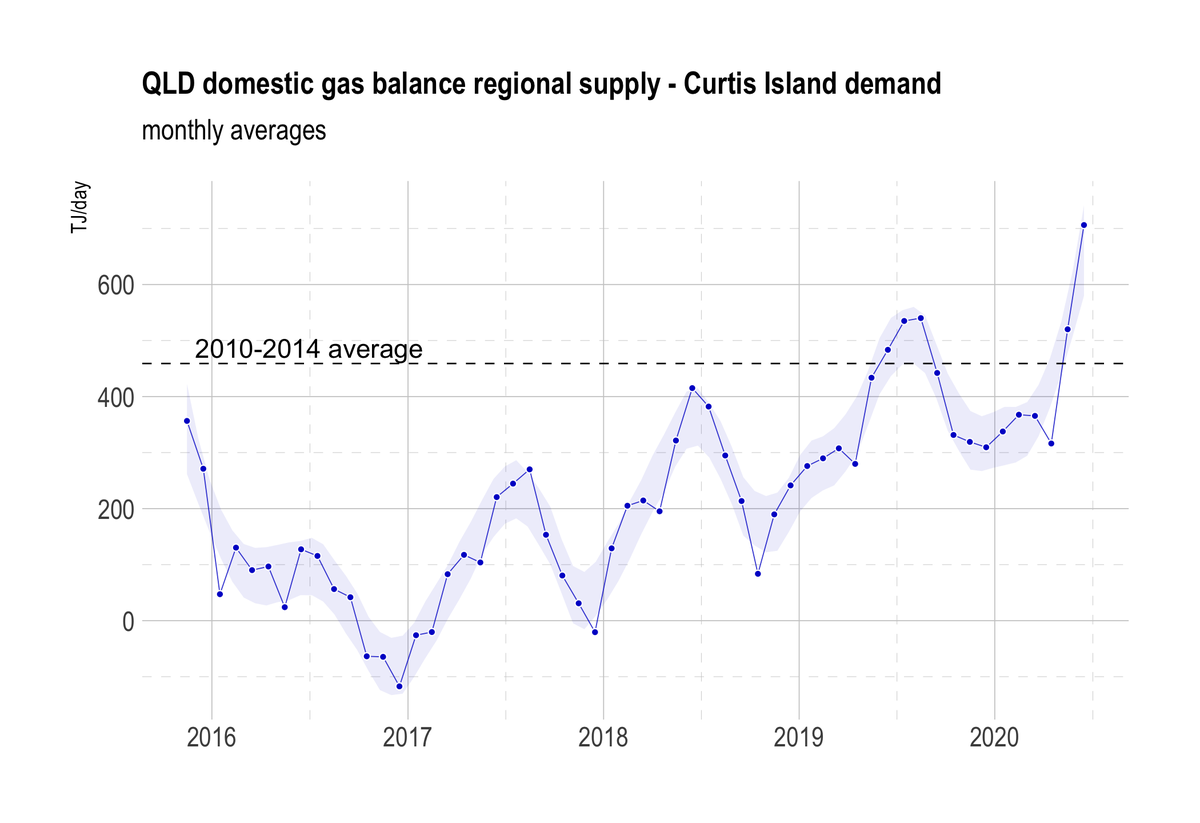
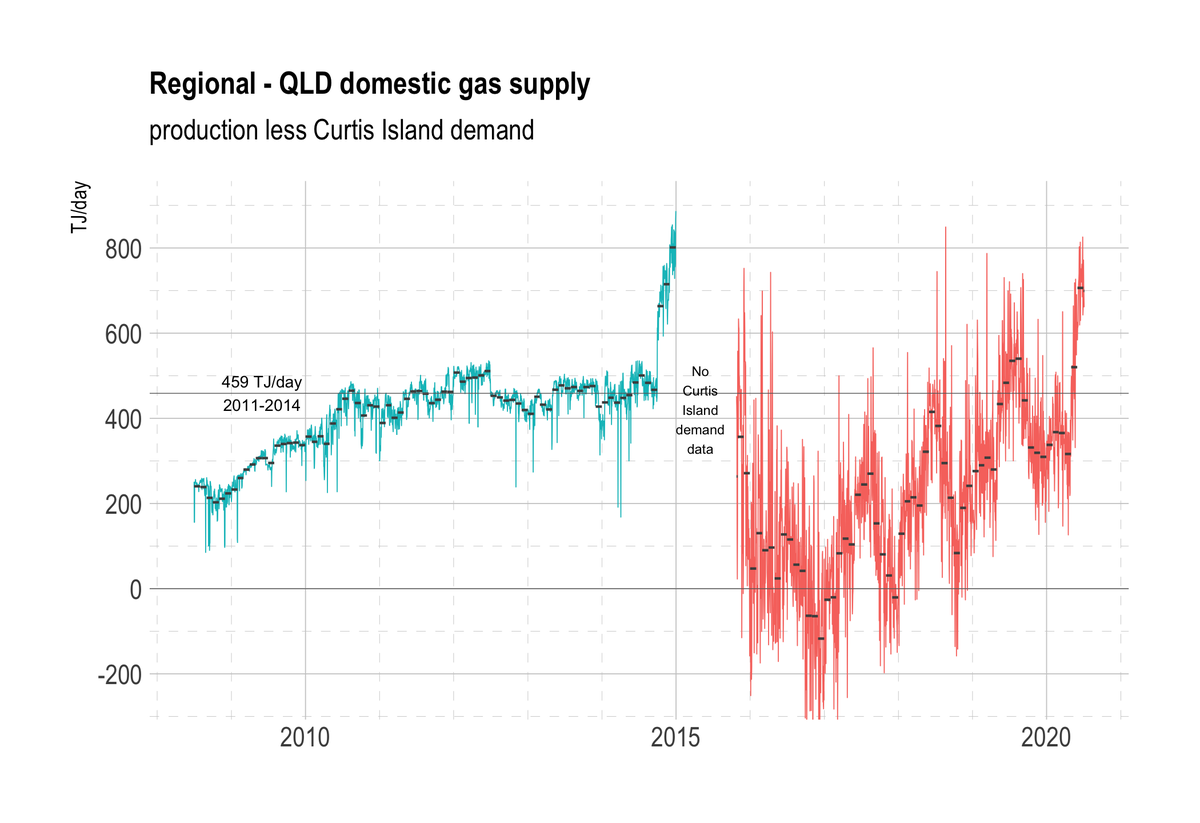
3) Australia's gas emissions/consumption are rising steeply at over 6% per year mainly because of gas use in LNG production. Image
4) To reiterate, the result is that total Australian energy sector emissions are now 32 million tonnes higher than they were in 2005. They will need to drop by a total of 130 million tonnes in 2030 to make a proportionate contribution to Paris Image
These facts evidence where the hard work for Australia lies. To meet Paris commitments it needs to continue the heavy lifting done by the electricity sector, work on fuel efficiency standards and electrification in the transport sector, and curtail gas use in LNG production
Can it do this? Electrification of transport helps address looming fuel security issues. LNG compression can be electrified with low carbon renewable energy. Desal, mineral processing and hydrogen production all fit with a low carbon economy as per Ross Garnaut's #Superpower Image
With will, we should believe, Australia can do it. It should take heart from comparator countries such as the UK that have already achieved Paris targets in their energy sector. But Australia must act fast, time is running out, for it and the world. Image
It should mandate the sub-surface sequestering of all co-produced reservoir CO2 from existing gas fields Image

• • •

Missing some Tweet in this thread? You can try to force a refresh
 

Keep Current with msandifo

msandifo Profile picture

Stay in touch and get notified when new unrolls are available from this author!

Read all threads

This Thread may be Removed Anytime!

PDF

Twitter may remove this content at anytime! Save it as PDF for later use!

Try unrolling a thread yourself!

how to unroll video
  1. Follow @ThreadReaderApp to mention us!

  2. From a Twitter thread mention us with a keyword "unroll"
@threadreaderapp unroll

Practice here first or read more on our help page!

More from @msandifo

Sep 24, 2020
more on gas fugitives ...
The Bakken in North Dakota is an important unconventional (shale) hydrocarbon play. Gas flaring lights the fields at night so clearly they are visible by satellite.
geology.com/articles/oil-f…
In the Bakken, oil is the commodity that drives investment, with gas a by-product, hence so much flaring. It is one big tight oil producer, but a bit player in gas, partly because of remoteness.
by late 2019, pre COVID, the Bakken was producing about 25 million tonnes of gas (annualised) of which about 80% found its way to market, with about 5 million tonnes reported as flared (equal to ~750 TJ/day or about half the demand of the Australian east-coast market, ex LNG)
Read 13 tweets
Sep 18, 2020
just another reason why OZ gas emissions are not quite what our guv would want you to believe.
our conventional gas fields are quite rich in CO2, almost all* of which is directly vented from processing plants such as Longford.
*only Gorgon is mandated to re-inject Image
and Gippsland in detail, with Tuna particularly CO2-rich... Image
then add the 9-10% gas directly used in LNG processing, which vents CO2 from the likes of Curtis Island .... Image
Read 5 tweets
Sep 16, 2020
a new-ish study - if you really want to get to the bottom of the gas story.

acp.copernicus.org/preprints/acp-… - Schneising et al. 2020

tl;dr- latest Tropomi satellite retrievals show 1.2-1.6% of total gas production for US shale gas basins is directly vented to the atmosphere
Hold on, only 1.2-1.6% is ok, isn't it? Or is it.
Remember shale gas is purported to be the transition fuel allowing the US to switch away from coal with massive emissions savings, down about ~700 million tonnes per year of more than 10% since 2007, according to BP. Image
What's not to like about that.
Must remember, an awful lot of gas in these basins does not get to market but is flared and or vented on site, and so is not included in the CO2 emissions inventories such as BP.
Read 7 tweets
Aug 29, 2020
Want to know why we don't need gas import terminals or new gas supply?

AGL nails it ...
discover.agl.com.au/your-home/heat…

“Over half of Australians still rely on gas as a source of energy, but few realise that there’s a more cost-effective, energy-efficient option – heat pumps”
In regards to the clamour for new gas supply and the "gas-fired recovery" the key question is
"if gas is so critical to industrial supply, then why are we wasting it heating homes?" when, as AGL says, more efficient options such as reverse cycle air conditioners are in homes
So why not look at how gas is allocated

for full details see ...
rpubs.com/msandifo/653368

as summarised below
Read 18 tweets
Jul 21, 2020
Latest AEMO quarterly update reports electricity prices plunge to lowest levels in 5 years
aemo.com.au/news/qed-q2

The AEMO presser fingers COVID-19, but really it is
really a text-book example of market power (ie monopolistic pricing).

see also @AFR afr.com/companies/ener…
1. Queensland coal seam gas production has been increasing more than LNG exports since early 2018 ImageImage
2. So instead of southern gas flowing north to help fill LNG cargoes (at 300 TJ/day across 2016), northern gas is now flowing south again (at an average rate of 100 TJ/day across 2019), as it was prior to LNG exports starting in 2015. ImageImage
Read 9 tweets
Jul 20, 2020
Come on @AFR you can do better than this

"Ironically, [opponents] allege that current domestic and global gas prices are too low to cover the cost of launching Narrabri. This ignores the temporary collapse in global demand for gas amid a once-in-a-century pandemic."

But ...
gas prices started to collapse back in early 2019, way before COVID-19.

and why was this ... Image
because local QLD CSG supply finally started to deliver over and above LNG export demand Image
Read 5 tweets

Did Thread Reader help you today?

Support us! We are indie developers!


This site is made by just two indie developers on a laptop doing marketing, support and development! Read more about the story.

Become a Premium Member ($3/month or $30/year) and get exclusive features!

Become Premium

Don't want to be a Premium member but still want to support us?

Make a small donation by buying us coffee ($5) or help with server cost ($10)

Donate via Paypal

Or Donate anonymously using crypto!

Ethereum

0xfe58350B80634f60Fa6Dc149a72b4DFbc17D341E copy

Bitcoin

3ATGMxNzCUFzxpMCHL5sWSt4DVtS8UqXpi copy

Thank you for your support!

Follow Us!

:(