
I'm an introvert, so my life is social distancing. I'm a pro at this shit.
On today's docket: updating two old Arduino projects (removing my dependence on Strings—if you know, you know) and starting a new project for school; a soil temperature and capacitance monitor. 🤓
On today's docket: updating two old Arduino projects (removing my dependence on Strings—if you know, you know) and starting a new project for school; a soil temperature and capacitance monitor. 🤓
Day 4: This phase of these projects is always a challenge for me: getting the whole circuit semi-permanent yet easily worked with, i.e., easily disassembled. Sometimes I am really happy with the end-product and others I just want it done. This is becoming the latter. 

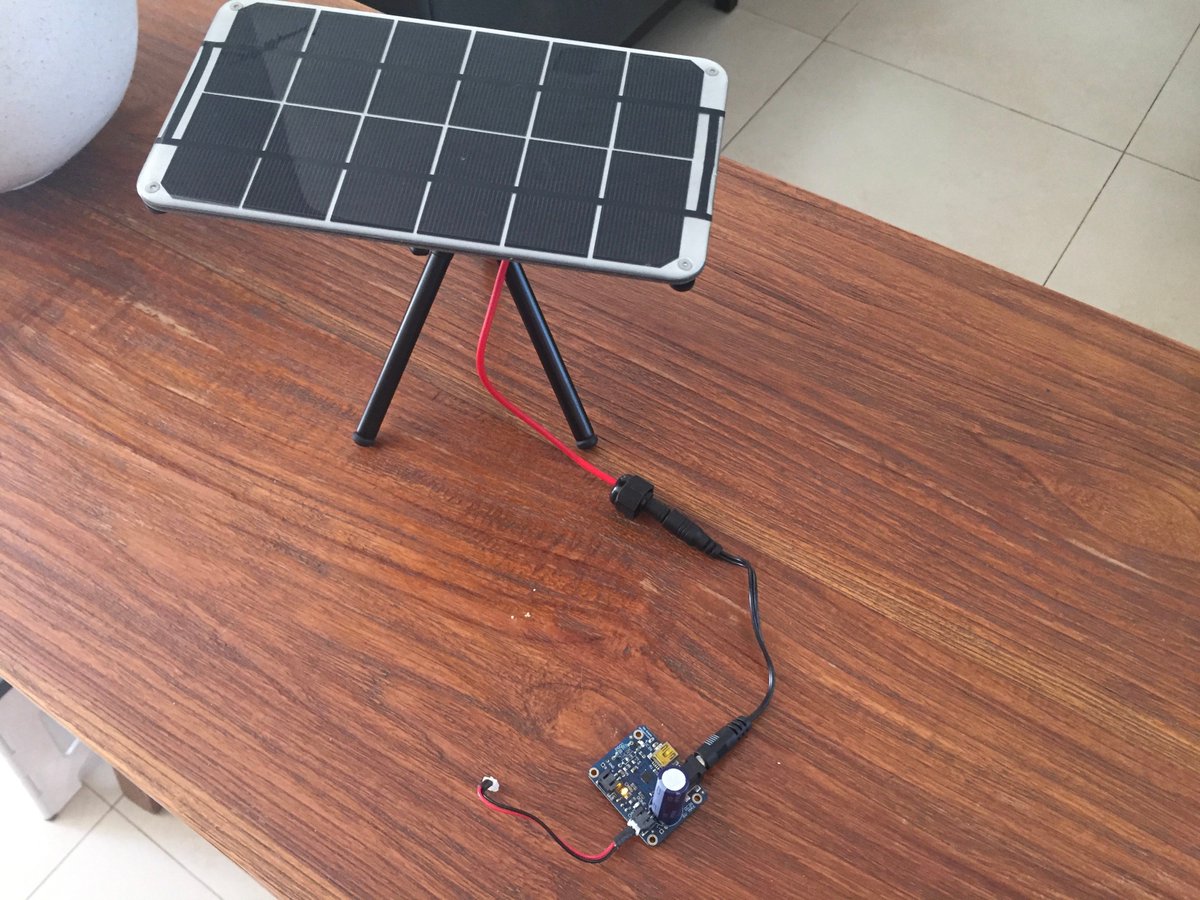
Yes, that’s gratuitous use of hot glue to stabilize a rather ugly way to connect jumper cables. I usually use male bits on the board but I am low on components and I haven’t found the necessary stores here in Bali yet. 🤷♂️
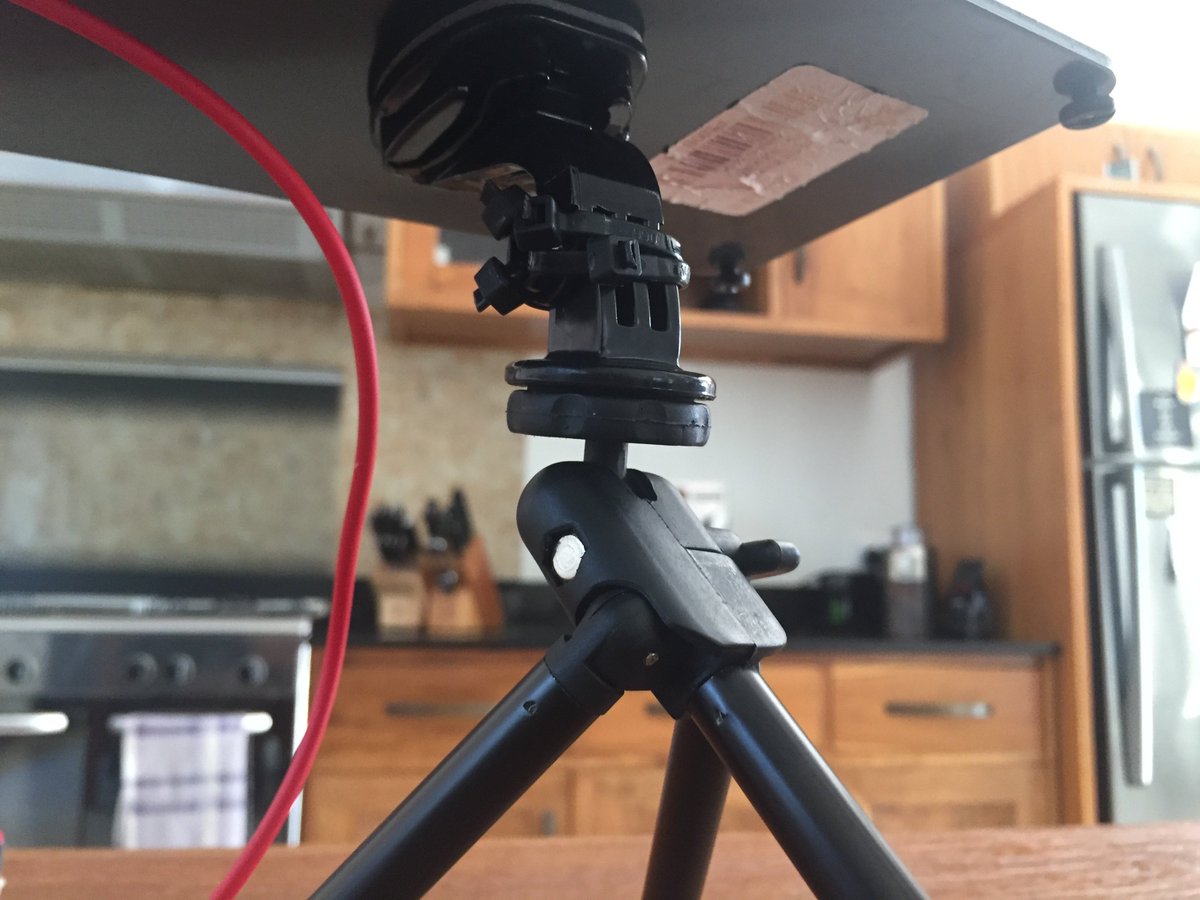
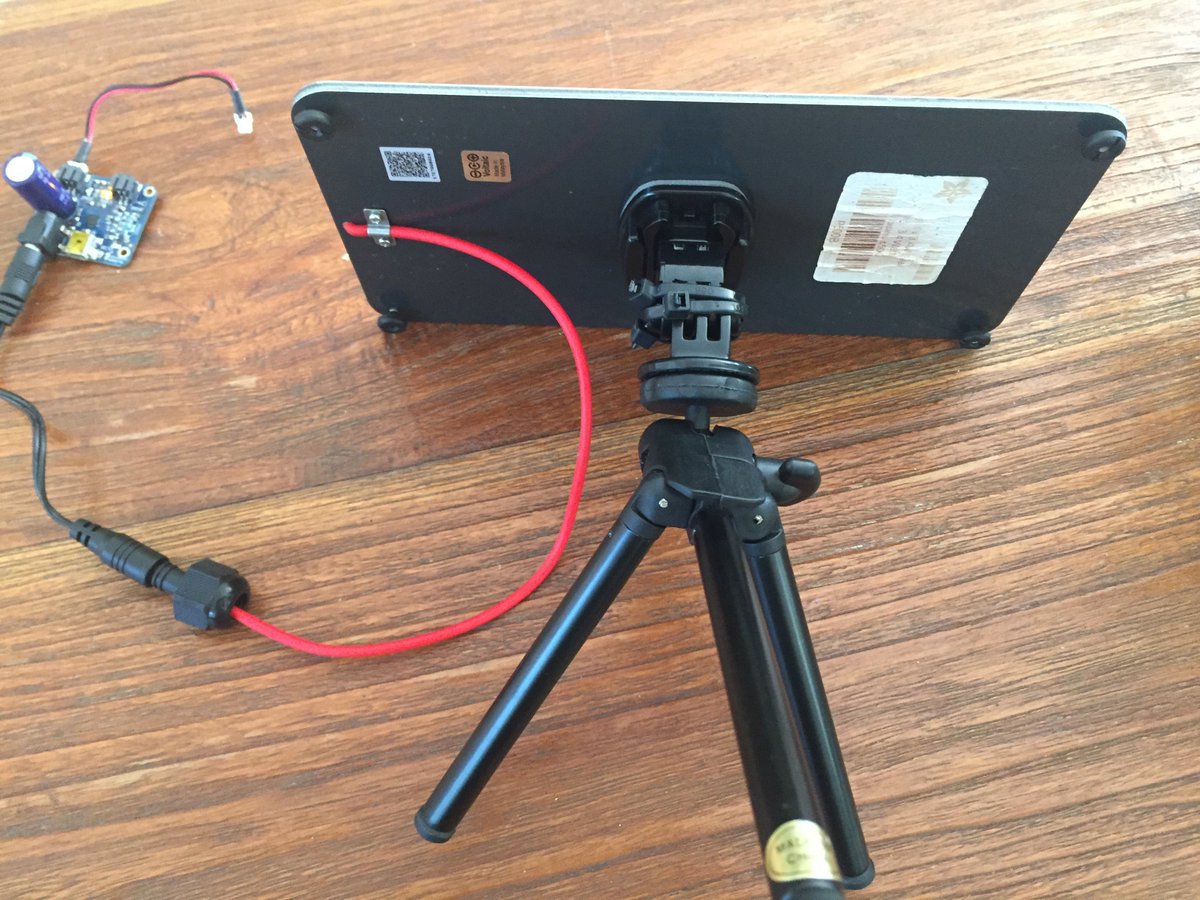
Found some unused GoPro mounts and a small tripod to use for the solar panel.
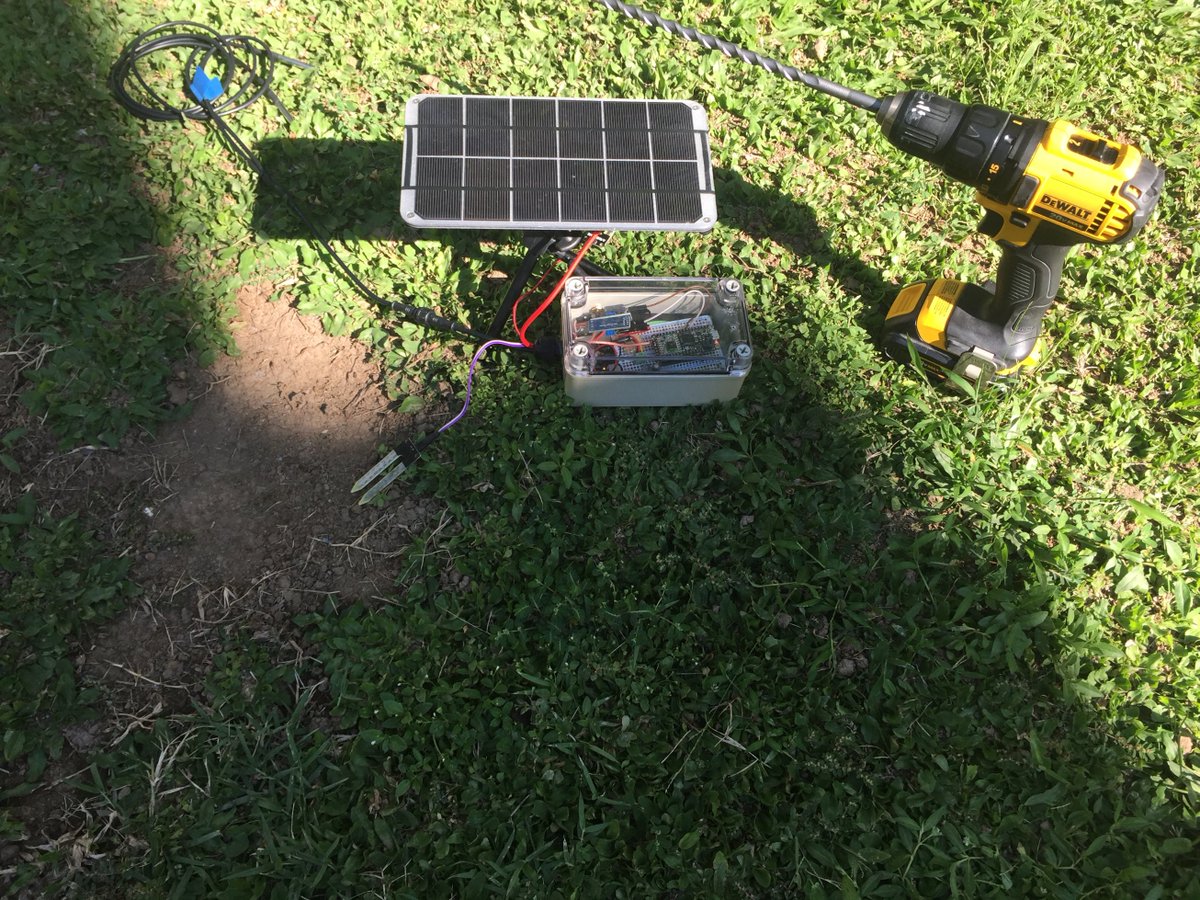
Picked up a 10X260mm masonry bit for another project (adding a drain hole to a flower pot) and it worked perfectly for the temp probes. I marked 15cm on the bit with a sharpie. I'm happy with the installation and am receiving "live" data now.

Day 5: 17 hours of data has been collected so far. Temperature data seems reliable but there is something up with the moisture data. It could be a few things: poor soil-to-probe contact and/or poor mappings. I also wonder if switching (+) and (-) on the probes has any effect.
I don't think switching (+) and (-) would have an effect but I don't know how else to explain the difference in readings from the dev/test environment to the soil.
I changed the dashboard at io.Adafruit by adding a single graph of both temps to see any significant divergence. None so far. I'm wondering if the probes are too deep and/or too close to one-another to show a difference caused by ground-cover. io.adafruit.com/mcwresearch/da…
Day 8: I scrambled for the last two days to get everything buttoned-down by Monday and I think I've achieved that. I got a lot done over the weekend and have had the unit redeployed for 16 hours and everything looks good.
One of the things I did on Saturday was to add an hourly routine where the device reports the battery level so I can see the power usage & performance. During the sunniest parts of the day you can see the device getting 6volts from the solar panel then by sun-down it's 100% batt.

I'm still dubious about the FC-28 moisture meters. One of the things I changed over the weekend was to have the sensor send the raw data from them to the web gateway where I can more easily change the mapping. The meters return an analog value between 0-1023 with 123 = dry
My current mapping for both FC-28 sensors is 1023=0, 380=100. That means the gateway does the math to convert the range 1023-380 to 0%-100%.
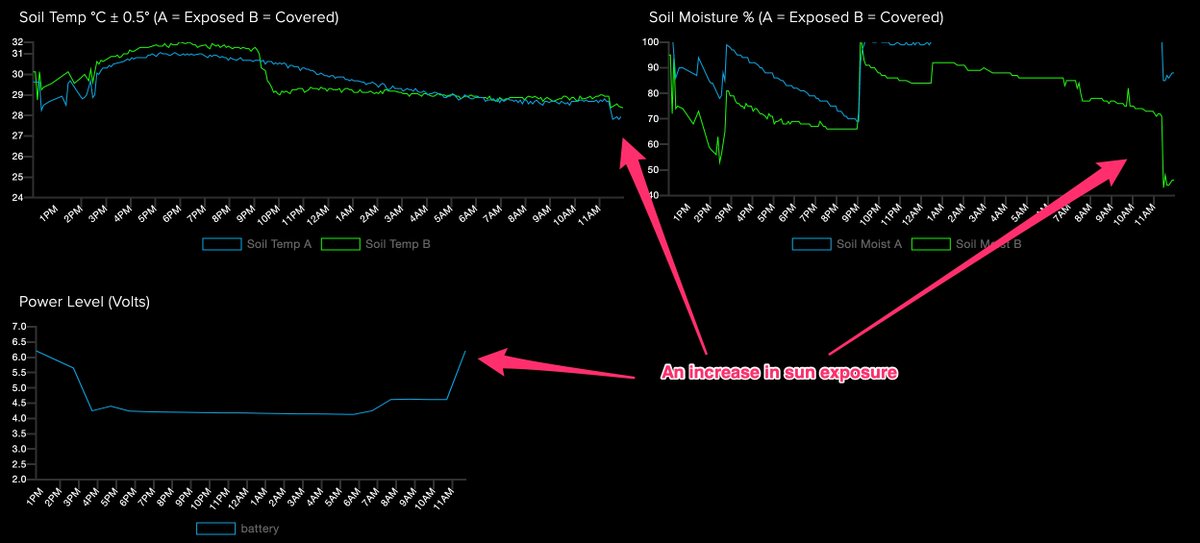
Over the first 16 hours you can see some interesting trends. During the hottest part of the day the readings get pretty squirrelly and then as the soil cools the curves smooth and converge, eventually crossing.
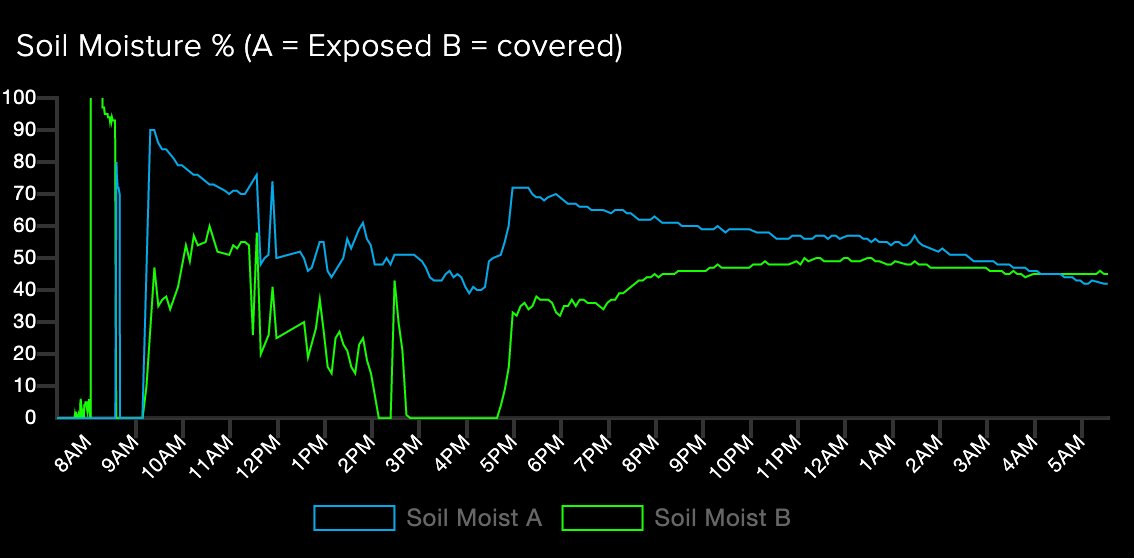
The converging+crossing was expected. The cover crop (broadleaf grass) should act as a lid to retain more moisture in the system than exposed soil. In the previous two graphs, data before 10a is not production data (not from the soil, but my desk).
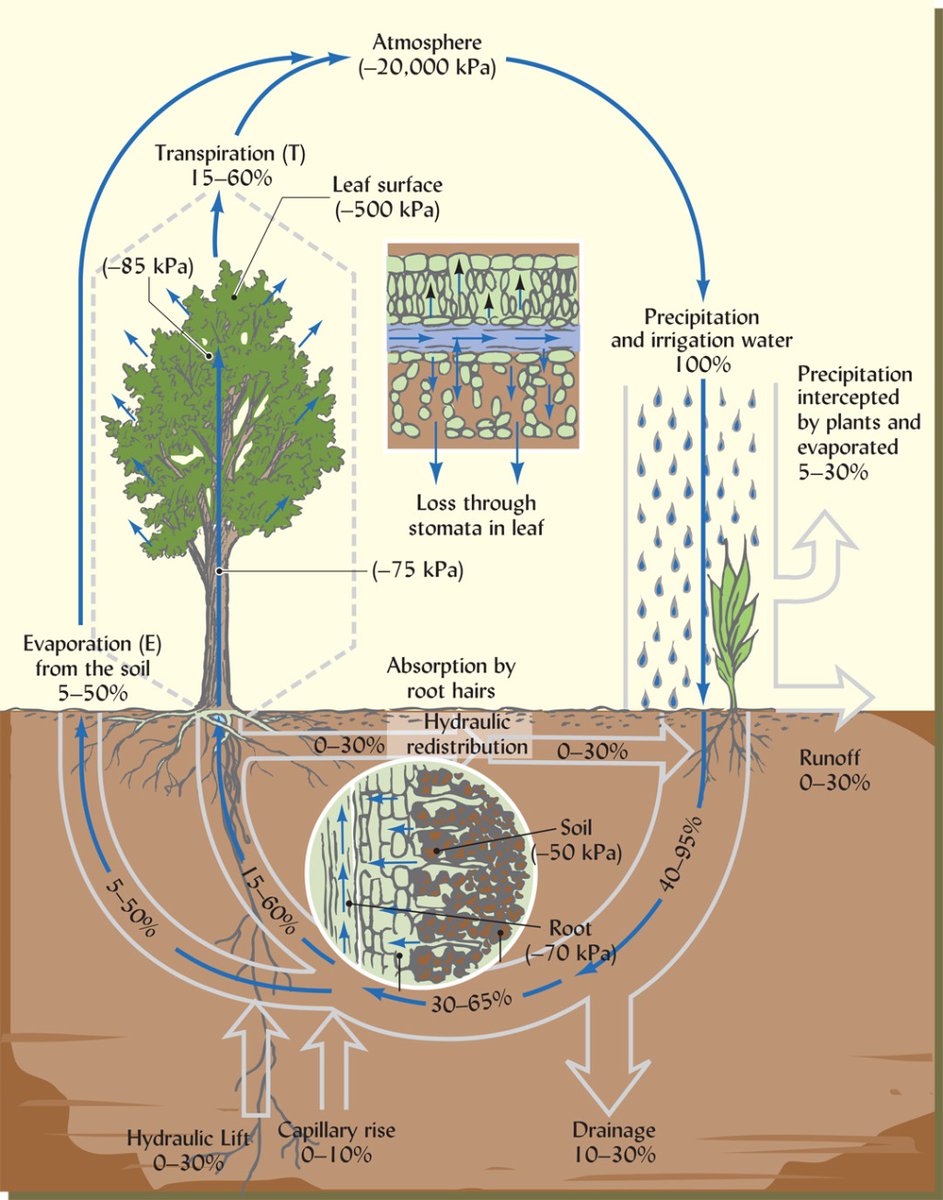
During the hottest part of the day, the grass is likely taking up water to cool itself, moving a lot of water from the soil straight through to the atmosphere via transpiration. That could partly explain the severe drop in moisture measured by probe B from 3p-4p
As the sun goes down and the system cools, water located deeper in the soil moves up via hydraulic lift, capillary rise, etc. (image: “The Nature and Properties of Soils” by Brady and Weil, 15th Ed.)
The code for the soil sensor, links for most of the components used in the build, and a (still-developing) wiki about the unit can be found on GitHub github.com/OilSlick/soil_…
A good rain drops the temperature of the soil for a while. It rained briefly, hard for maybe 30 minutes and now we're back to full sun and you can see the effect on both temp and moisture. 👍
It looks like I have a problem with the overall sensor with full sun exposure. With full sun on the unit, I get faulty readings (6v = full sun on solar panel). This could be a heat problem or an over-voltage problem.
The challenge if it's over-voltage is I get only one power-feed from the lipo charger. The charger decides if power comes from the batt or panel. So I have to use an LDO regulator, which means the bottom of my battery life goes from ~3.0v to 3.7v with a .4v drop-out regulator.
That may not be a problem. So far I have yet to see the battery below 4.0 but we also haven't had a full overcast day either. I have so far gotten a full recharge on the battery every day. An option would be to add the regulator and also another battery in parallel.
Over-powering the device was definitely the cause of the squirrelly data. We're two hours into peak sun on the panel and all readings seem much more stable. The gap in data yesterday from ~3:30 - 5:45 was me taking it offline to install the regulator.
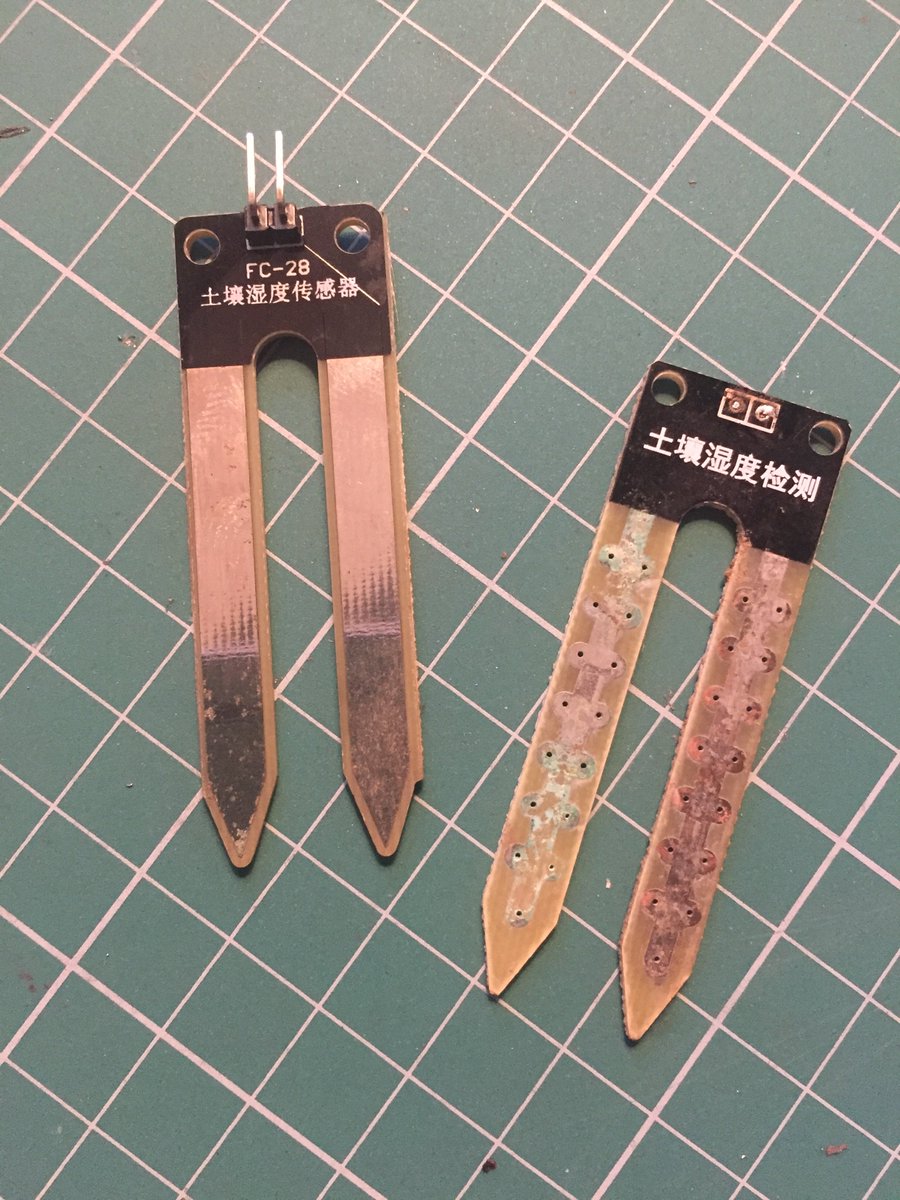
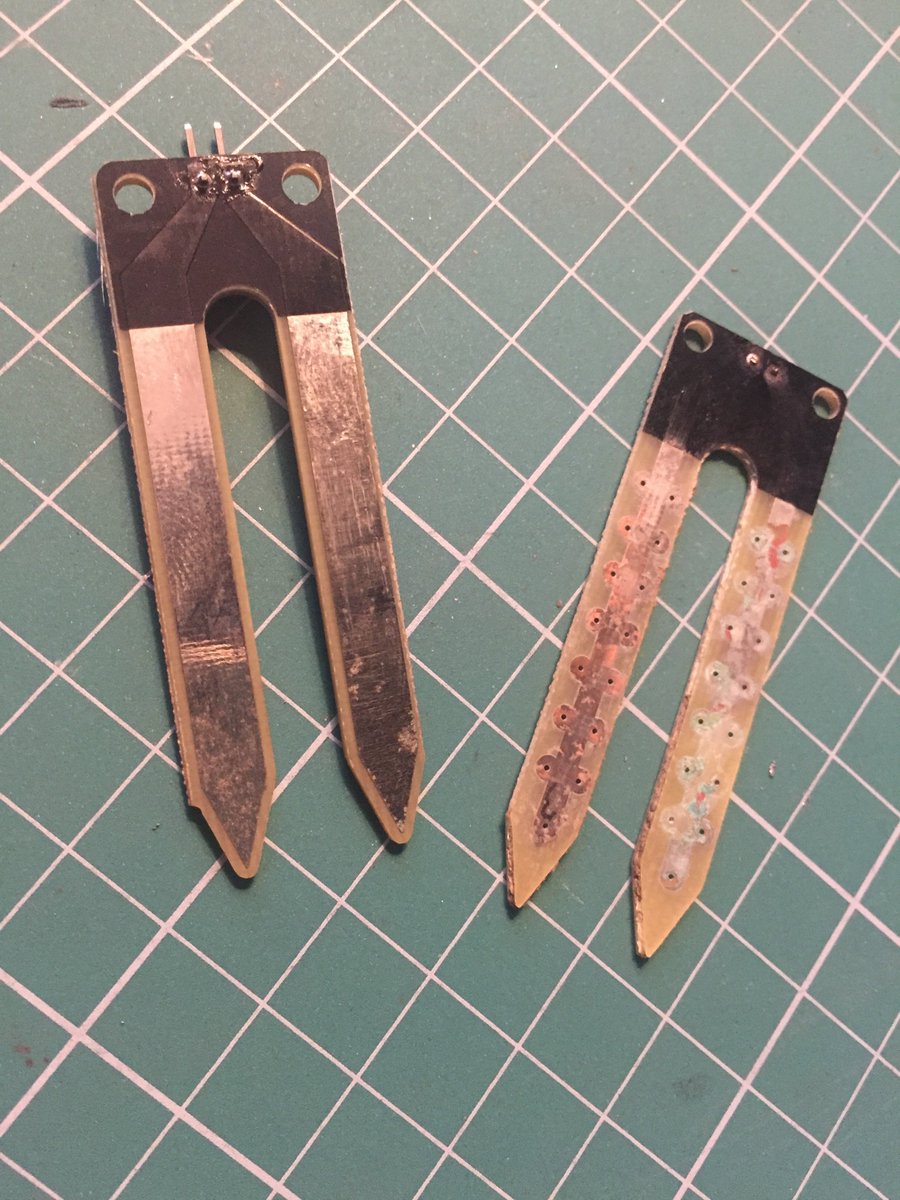
I was hoping to save the actual probe that had corroded but I wasn't able to remove the old, remaining contact posts. But I found another one from an old project (a plant hydrator that pumped water automatically). That probe is a bit different from the original:
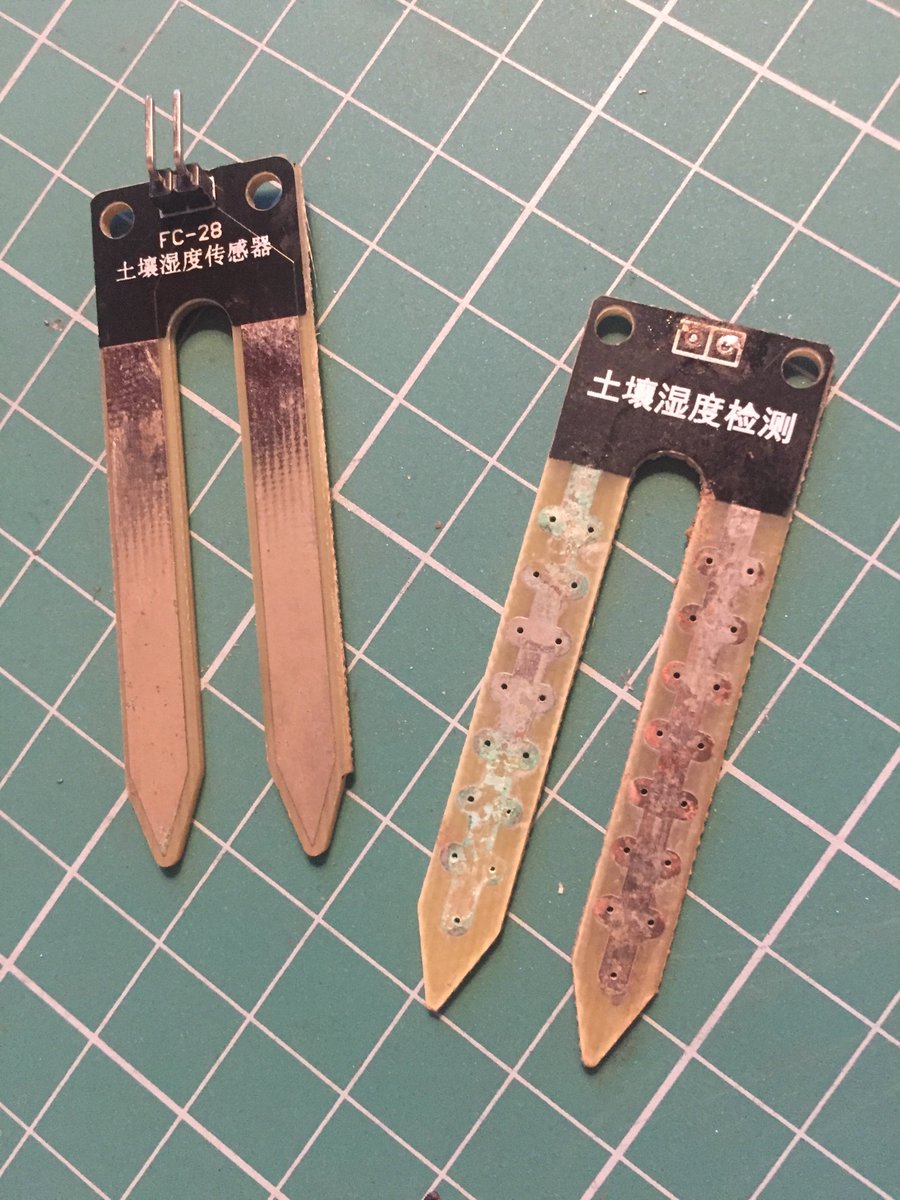
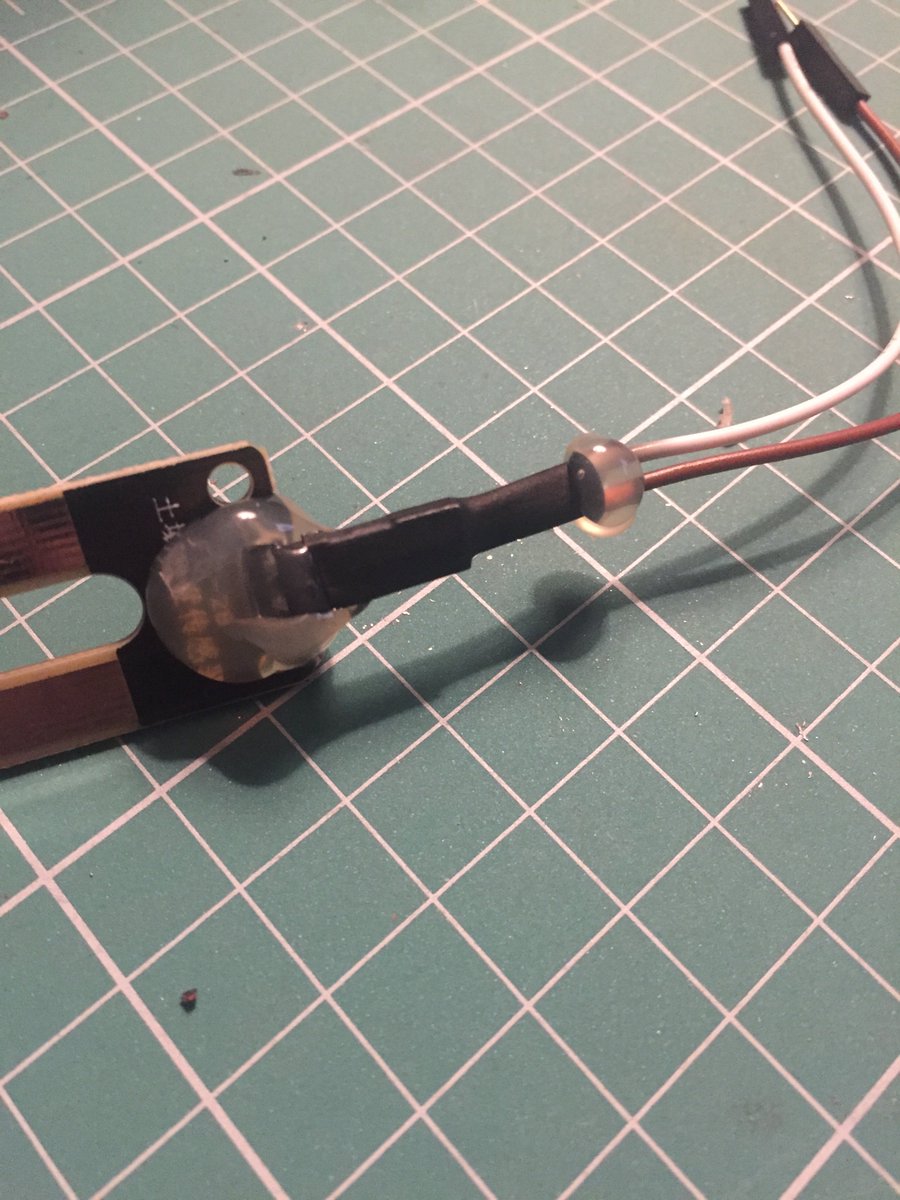
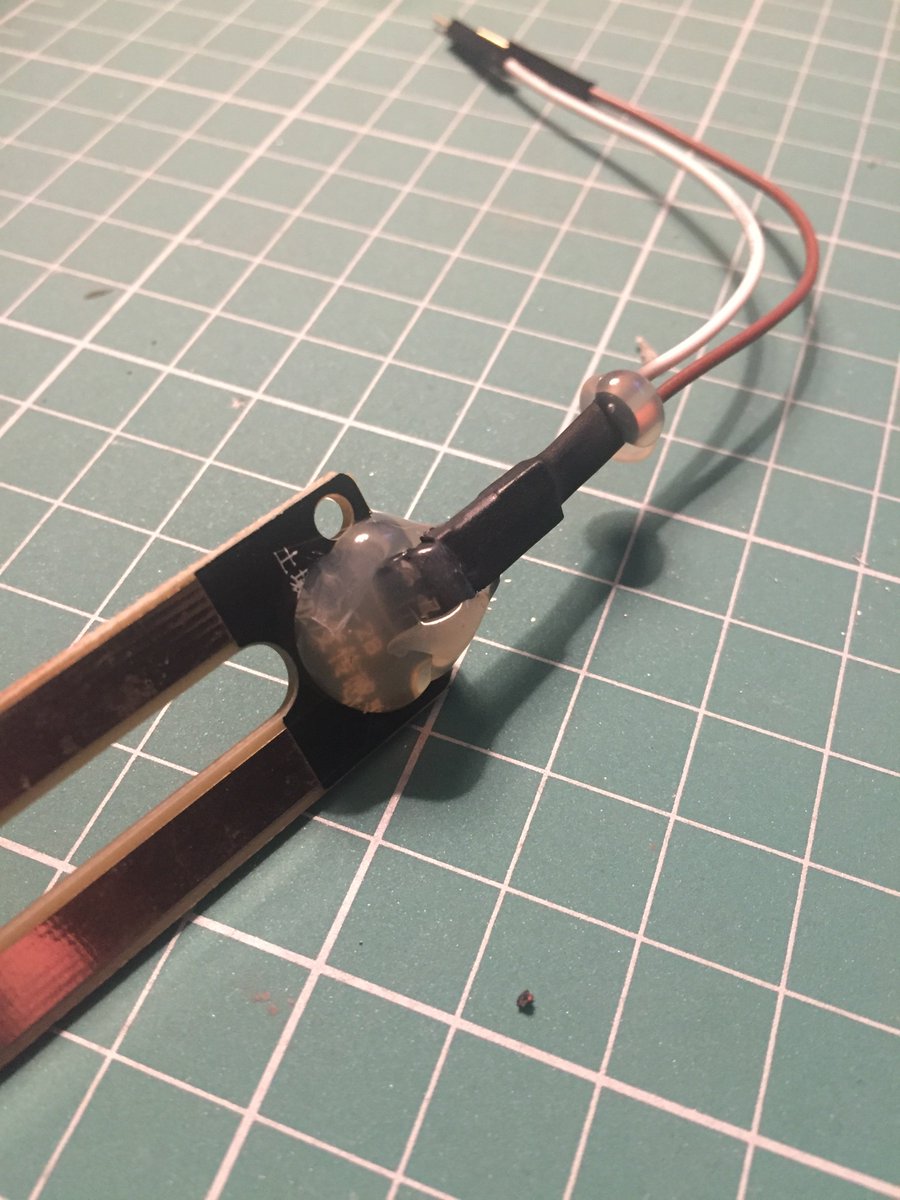
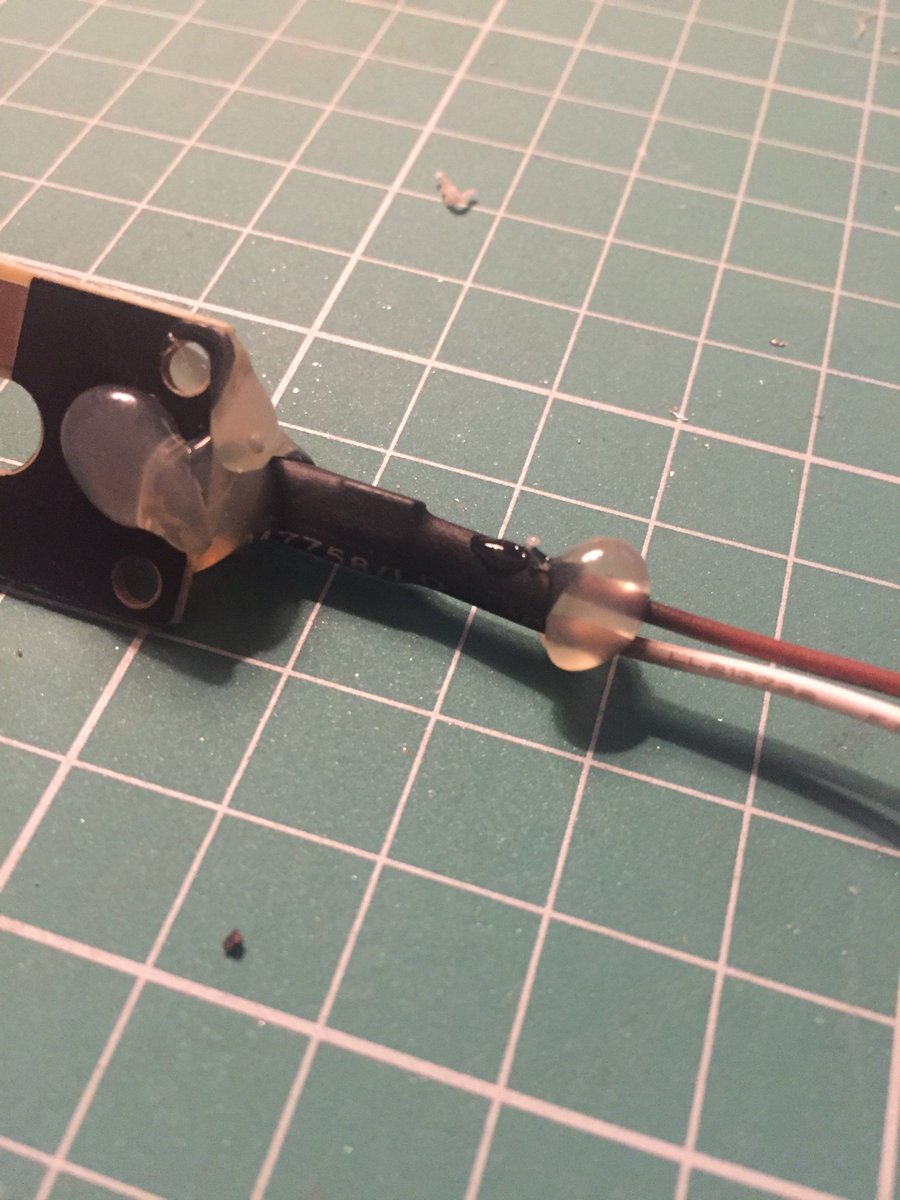
To help prevent a similar fate with this probe's contacts, I used some heat-shrink wrap around the wires and then some hot-glue to try to seal things up around the contacts:
The new probe has been in soil for 12 hours and reporting data. Now to roughly calibrate it. That means placing it in a glass of water to find out what it reports as full saturation on an analog scale of 1023 - 0, with 1023 being fully dry. Then I'll use map() to convert it to %
This is where it's handy to have another device doing the data conversion, because I can have different mappings for different probes and change them without taking the main sensor offline and opening it up (I've sealed it with tape to help make sure it's waterproof).
I adjusted the mapping function of the moisture data, to accommodate the new probe installed. This time instead of using a glass of water, I just saturated the soil and noted the raw readings at obvious soil saturation.
Interestingly, the readings from sensor B (that is original) was right inline with what I got in a glass of water on my desk. So I didn't need to adjust the mappings for that probe.
And after posting that last tweet I realized I applied the mappings backwards. That's now been fixed and I hope (hope) that I can now sit back and let it collect data. 🤞
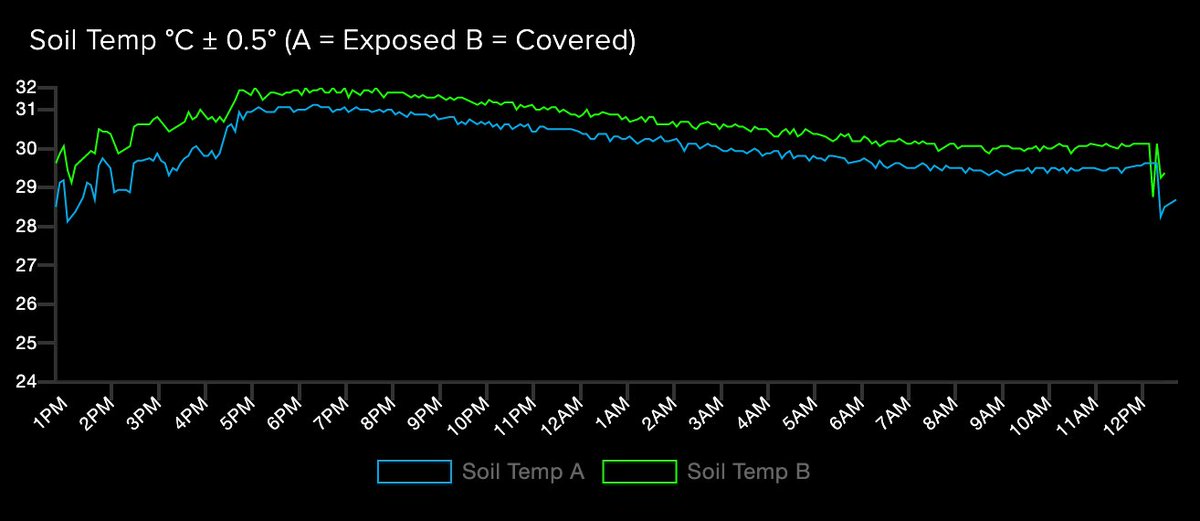
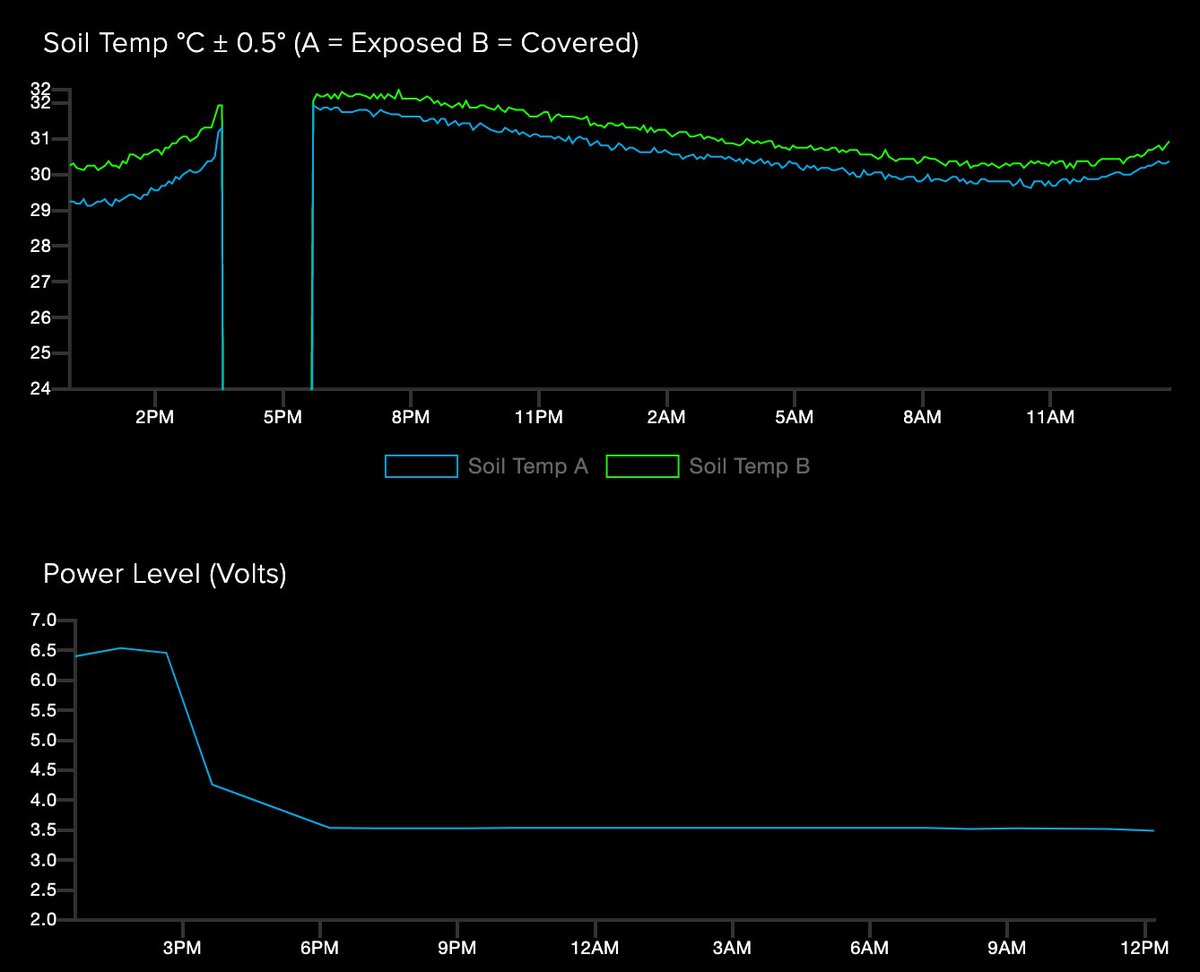
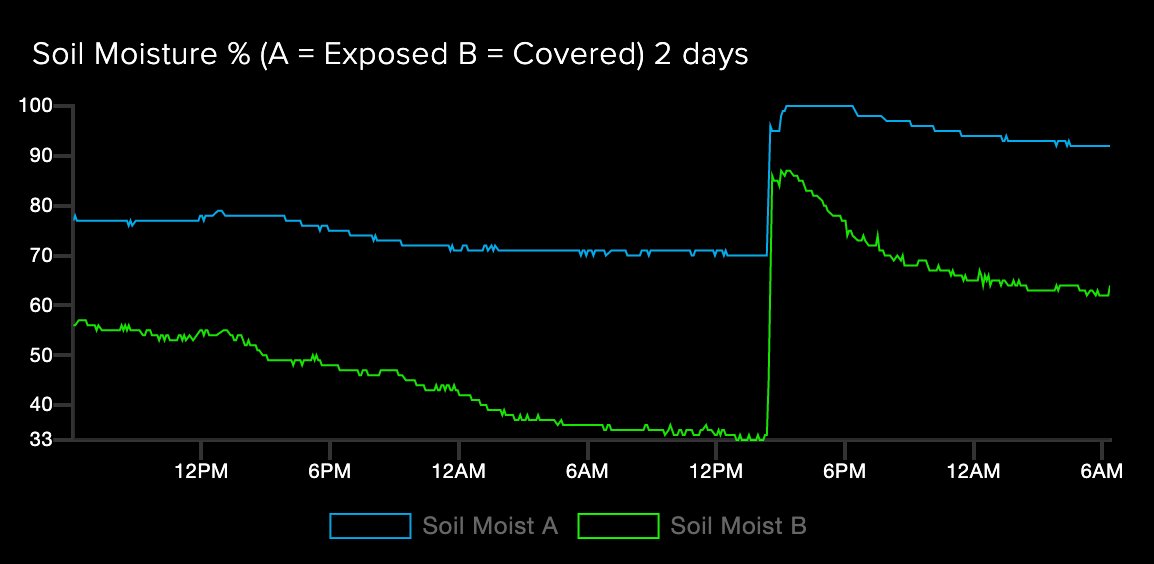
This is a graph showing 48 hours of data. Yesterday (the second hump) was an overcast/cloudy day and you can see the result on the soil temperature compared to the sunny day before:

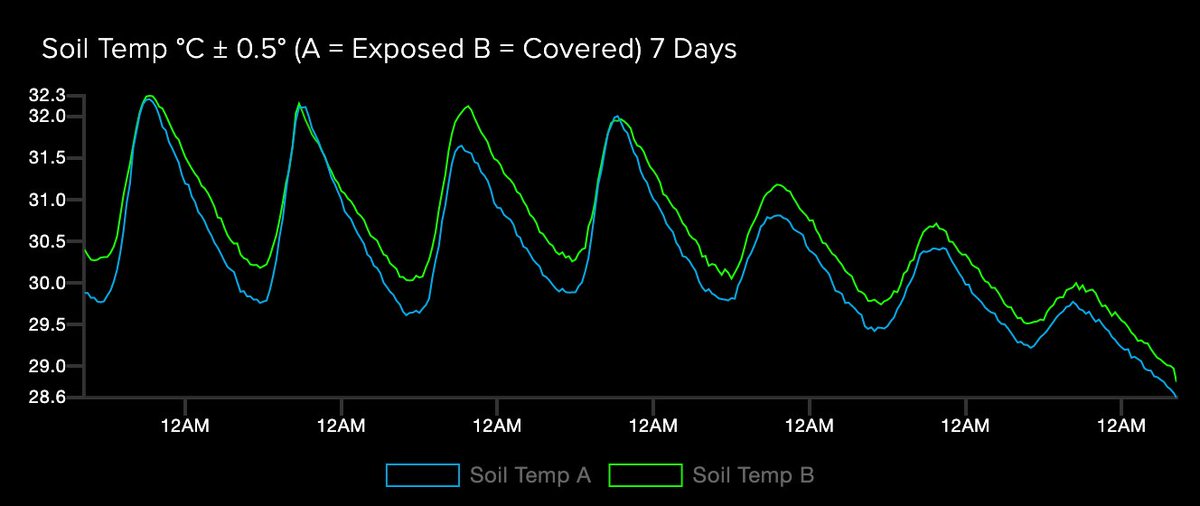
Second day in a row of mostly overcast weather and you can see the peak soil temperature trending down. Today's peak looks like about 1.3°C lower than two days ago:
Three overcast days have had an interesting effect on the daily soil temperature patterns (we're flattening the curve over here!). Yesterday we had some good rain and it remained overcast all day, reducing the amount of moisture lost from the soil to evaporation:
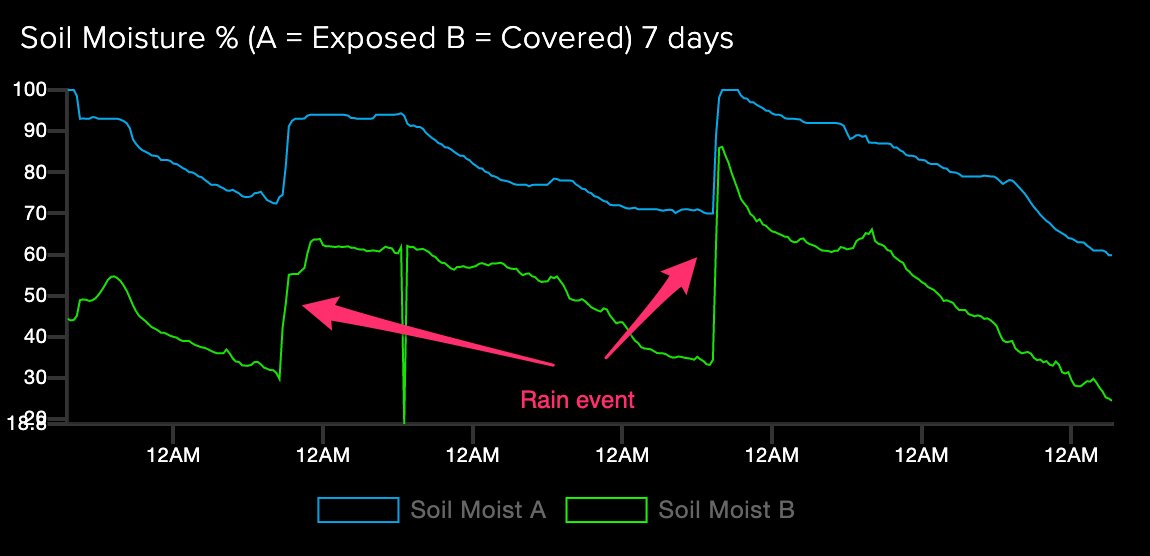
A seven day overview better illustrates the effect of multiple days of overcast. I now have enough data that I've added 7-day graphs to the dashboard. There are now 24h, 2d, and 7d graphs.
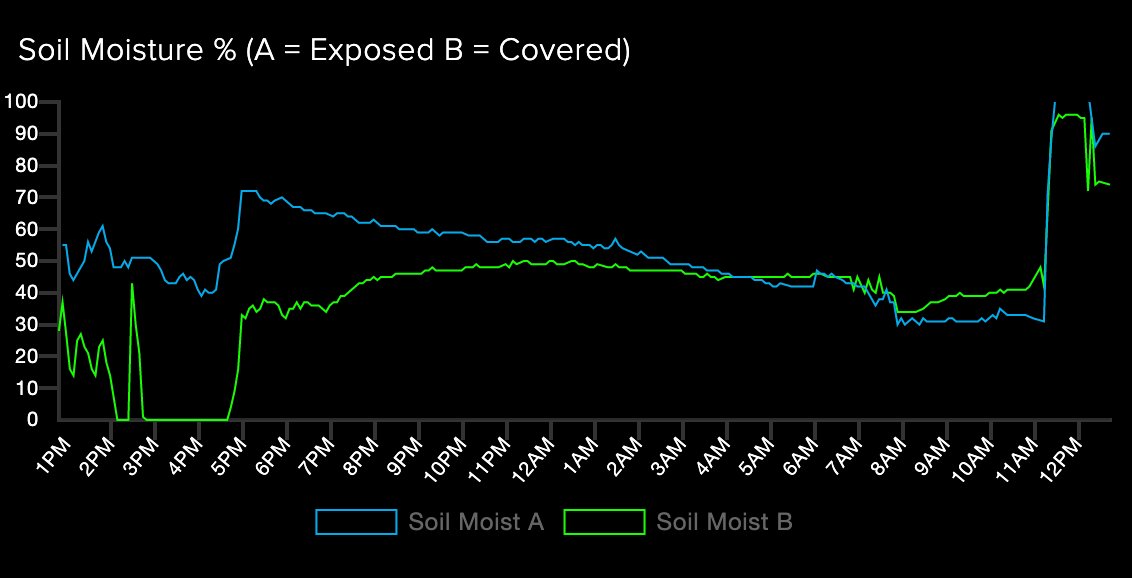
It only takes about two days for this very sandy Bali soil to lose the water gained from a rain. Now I understand why I have to water the garden so much in the dry season!
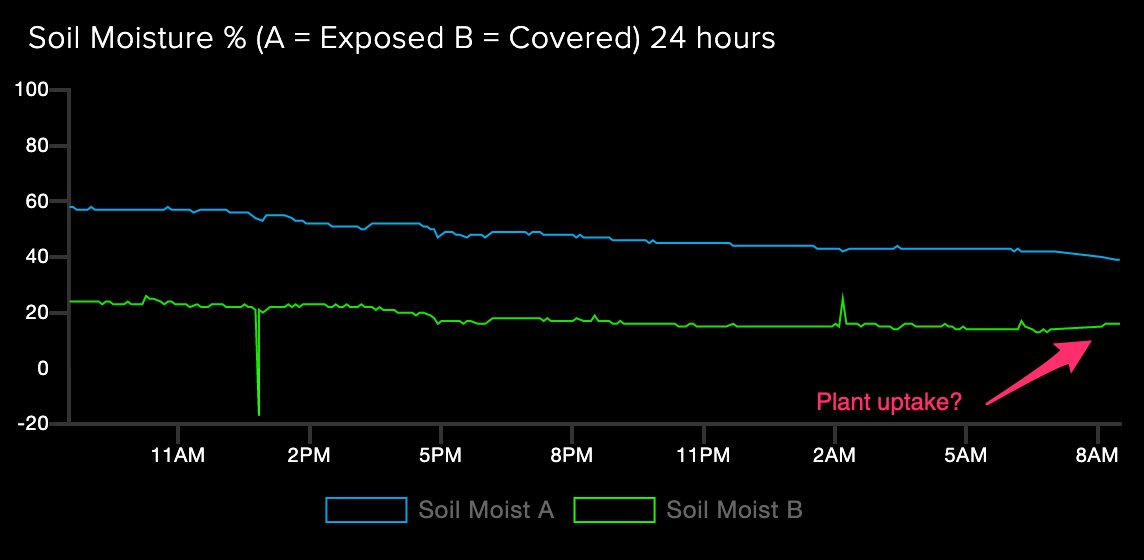
I'm wondering if the uptick in moisture for the covered soil in this graph is plant (grass) uptake of water drawing more water into the monitored zone. It's not rain or irrigation and the exposed sample is showing the opposite (and expected) trend.
A new event yesterday; the temp of the exposed soil crossed the temp of the covered soil. My theory is the soil had become so dry that the exposed sample was easier to heat (direct sun + less water to buffer raising temps)
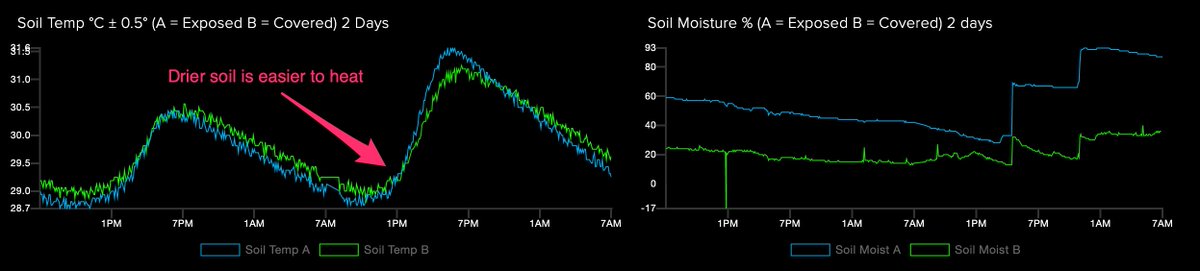
Water insulates (buffers) against temperature changes because of its heat capacity. It takes more energy to raise the temp of water 1° than it does to raise the soil temp 1°. But once heat capacity is satisfied, thermal conductivity kicks in and it transfers heat well.
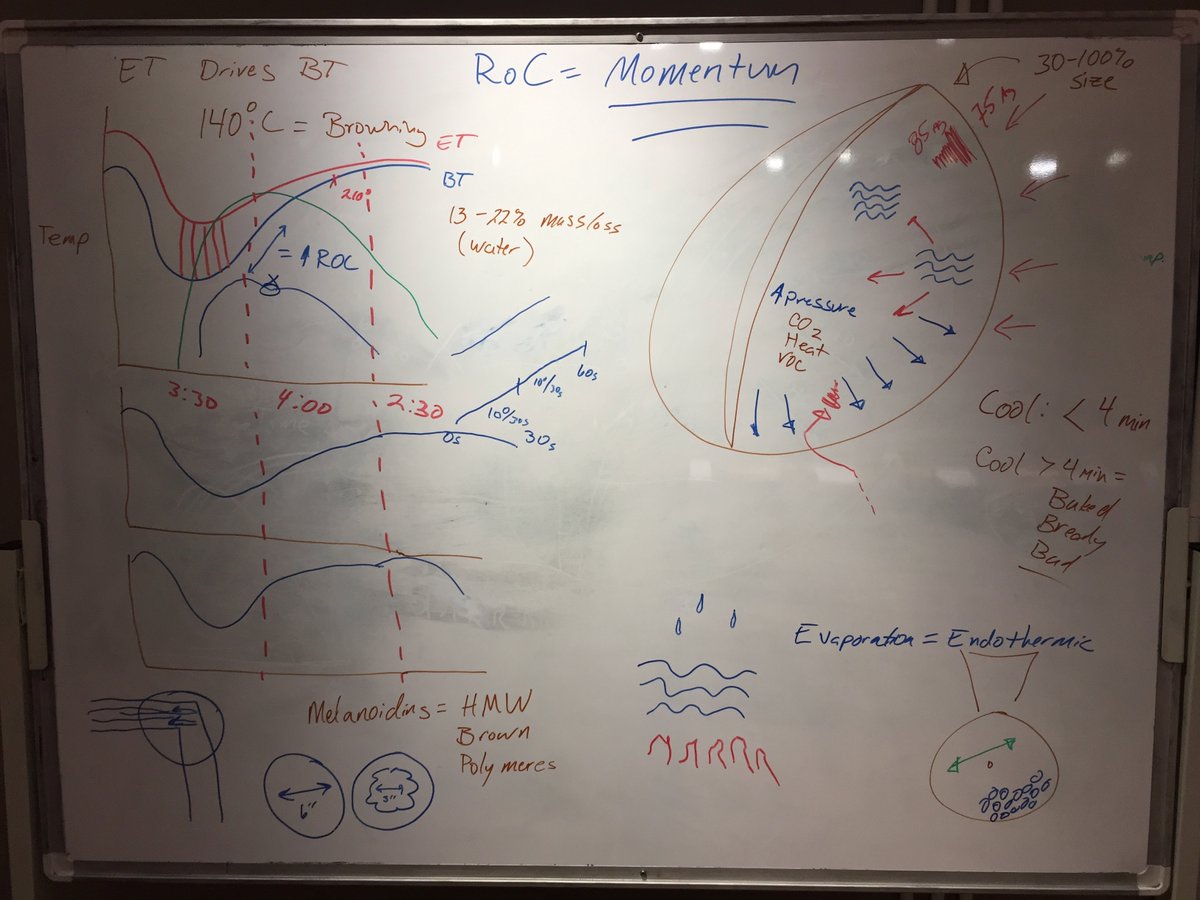
I talk about these two physical properties of water in my intermediate roasting classes because #coffee roasters leverage them both to roast coffee. Science FTW! caffeinated.training
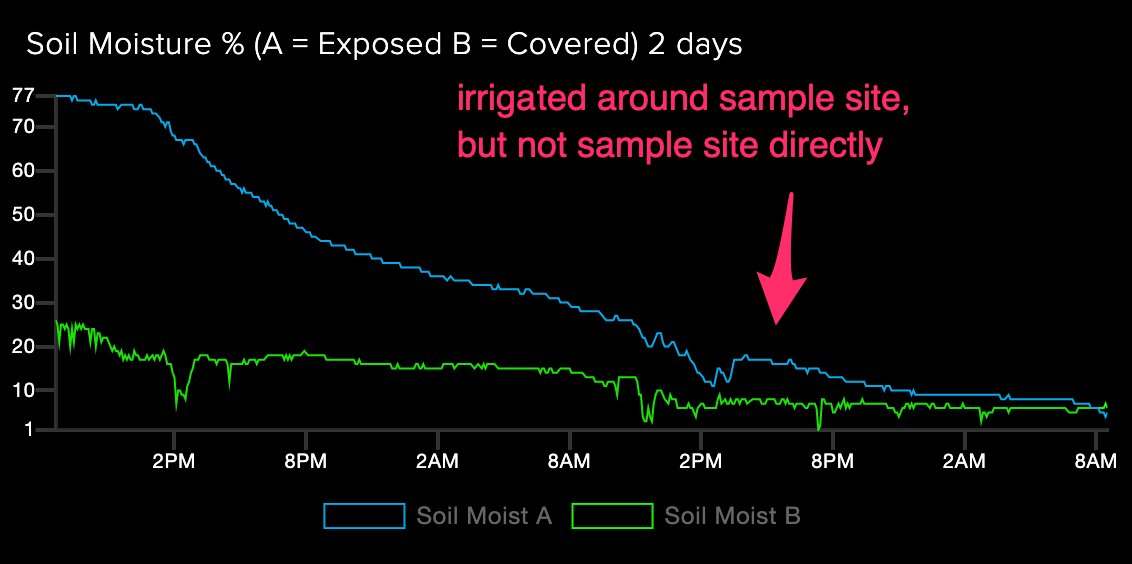
Two days ago I irrigated around the sample site but not the site directly (maybe a 6" perimeter) and there has been very little, lateral water movement in this very sandy system. It looks like at this dryness, water largely flows down with gravity.
@threadreaderapp unroll

