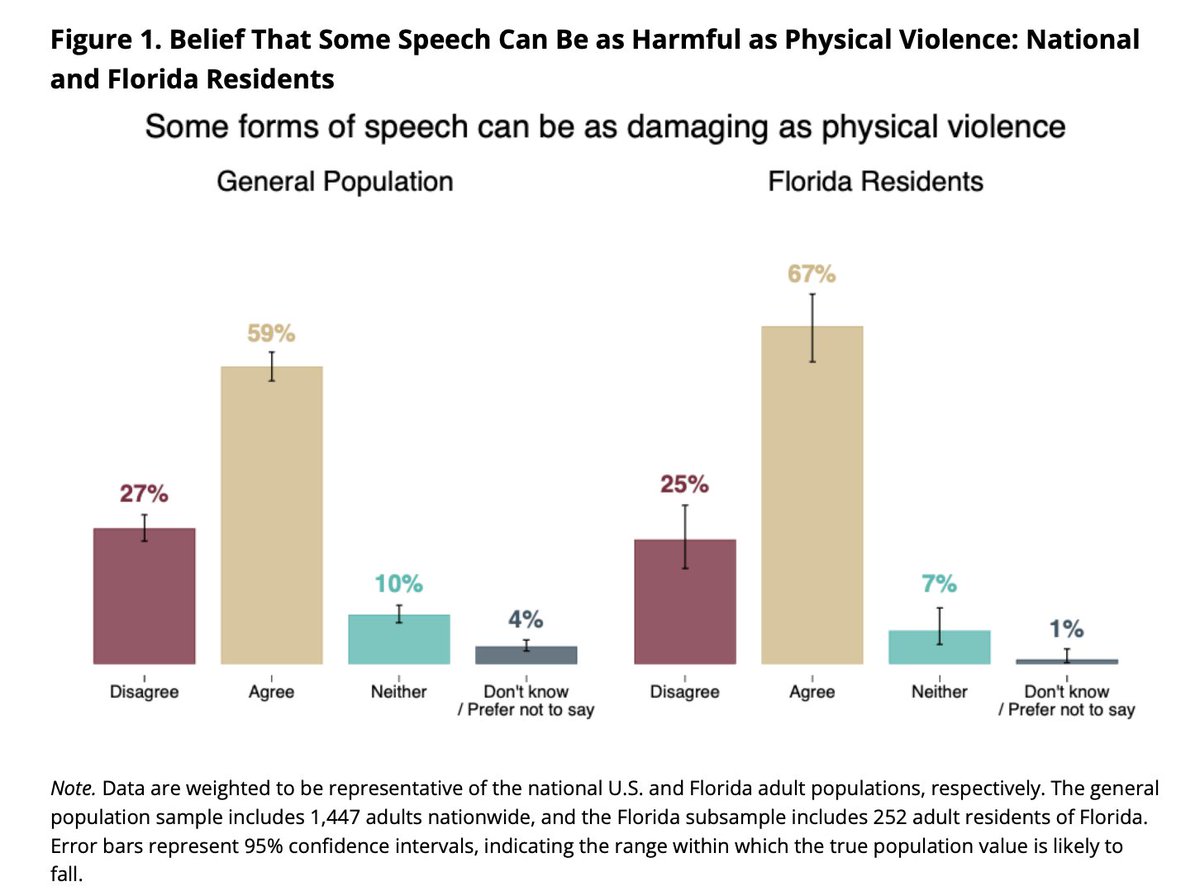
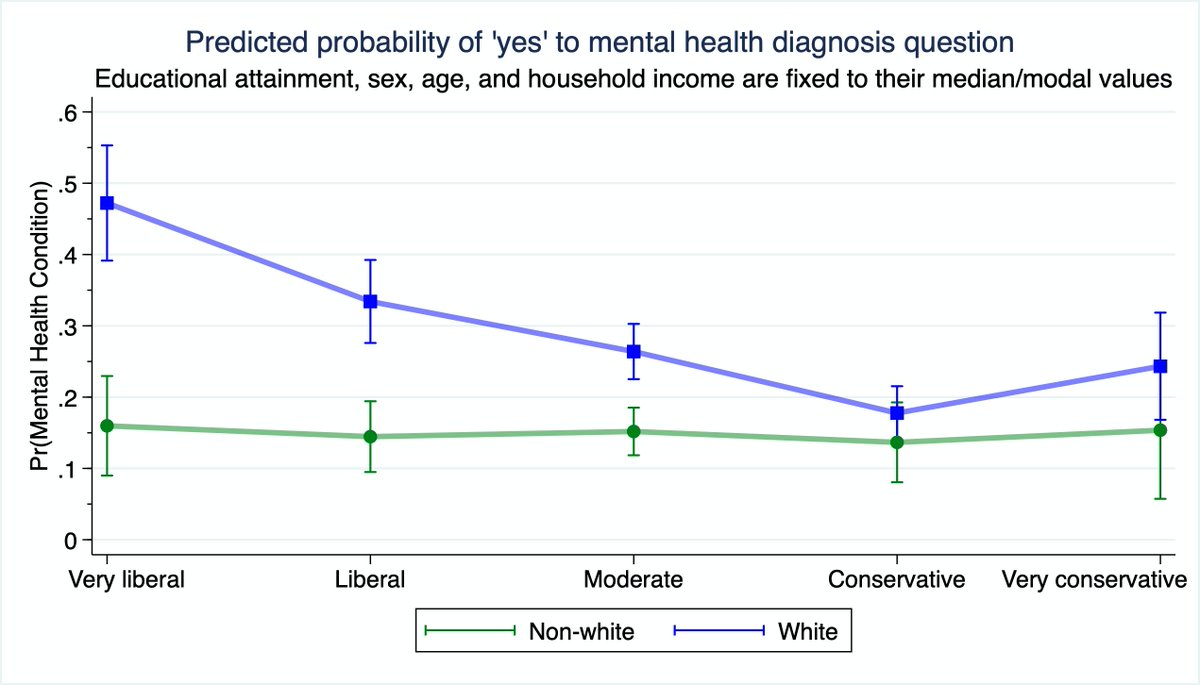
1/n Two interesting findings thus far from my analysis of Pew's March 2020 COVID-19 survey. First, white (and especially 'very') liberals are far more likely than all other ideological-racial subgroups to report being diagnosed with a mental health condition.
2/n Somewhat surprisingly, this difference further grows when we add standard controls
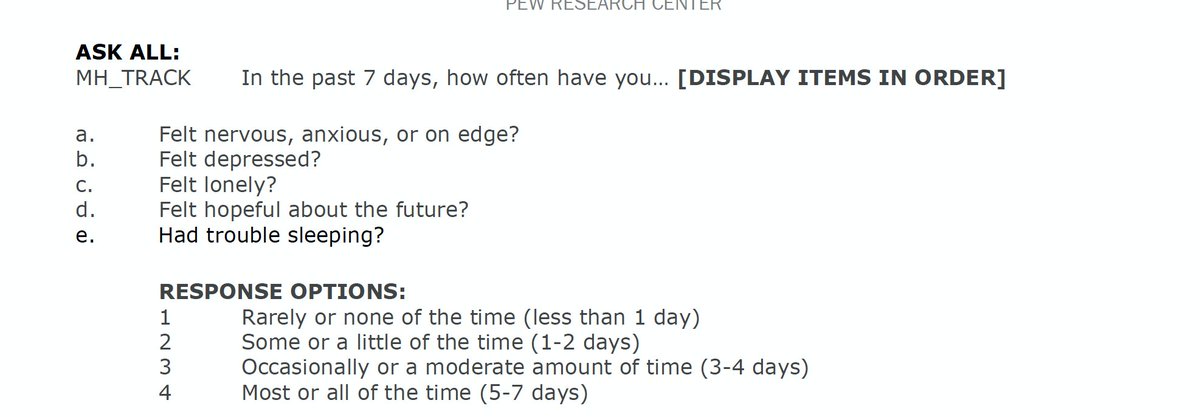
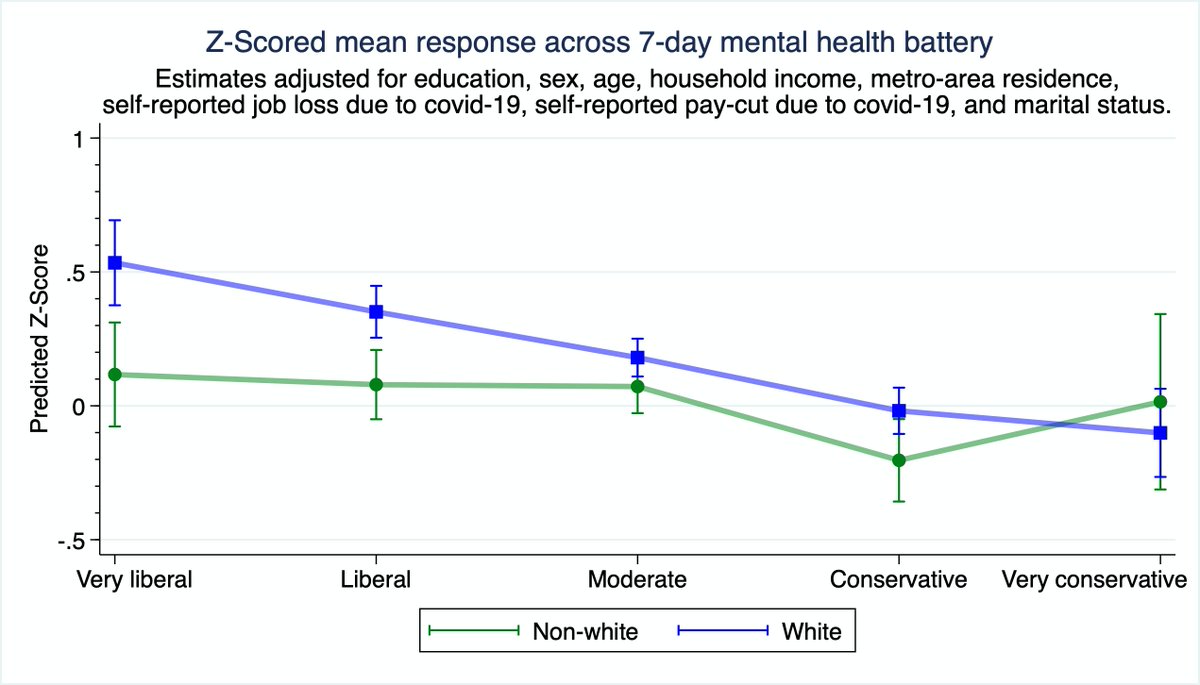
3/n We next turn to mean responses to this battery, which asks about the frequency at which respondents experienced specific mental health issues over the previous 7 days
4/n The differences are more modest here, but still significant
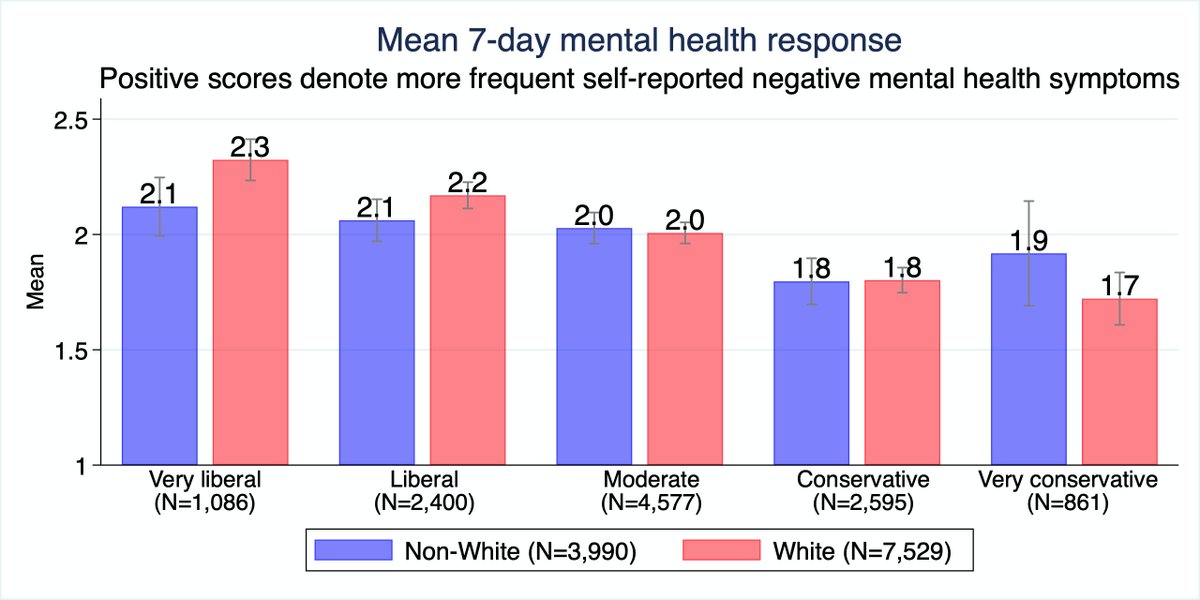
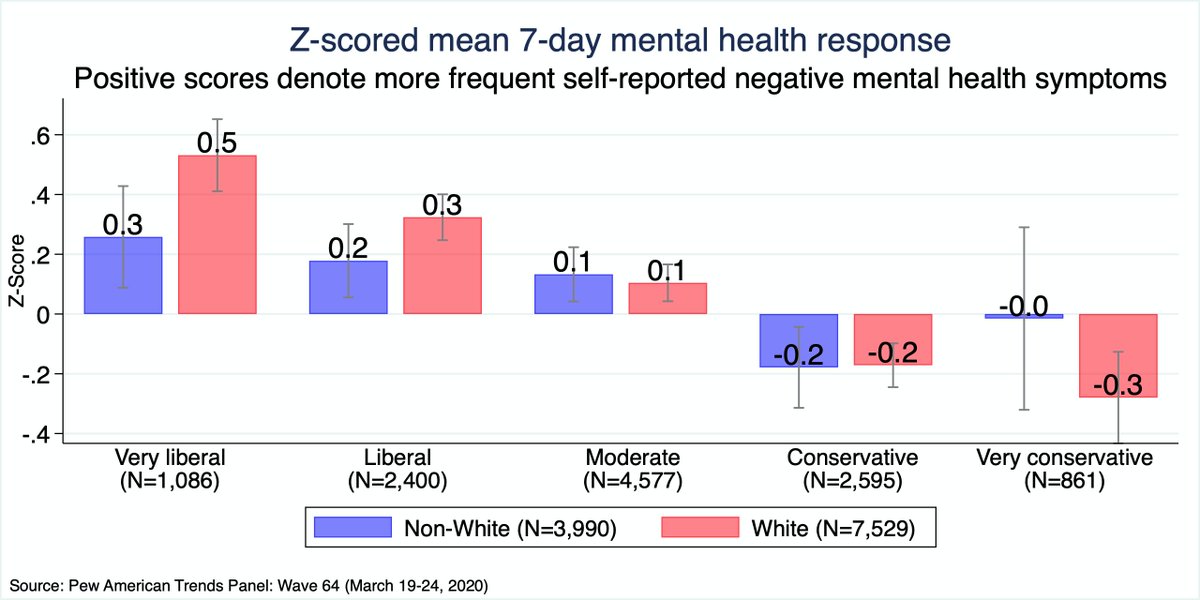
5/n They are also robust to several potential confounds (e.g. job loss, pay-cuts, marital status)
6/n However, entering the 'mental health diagnosis' variable into the model does (perhaps naturally) narrow the difference.
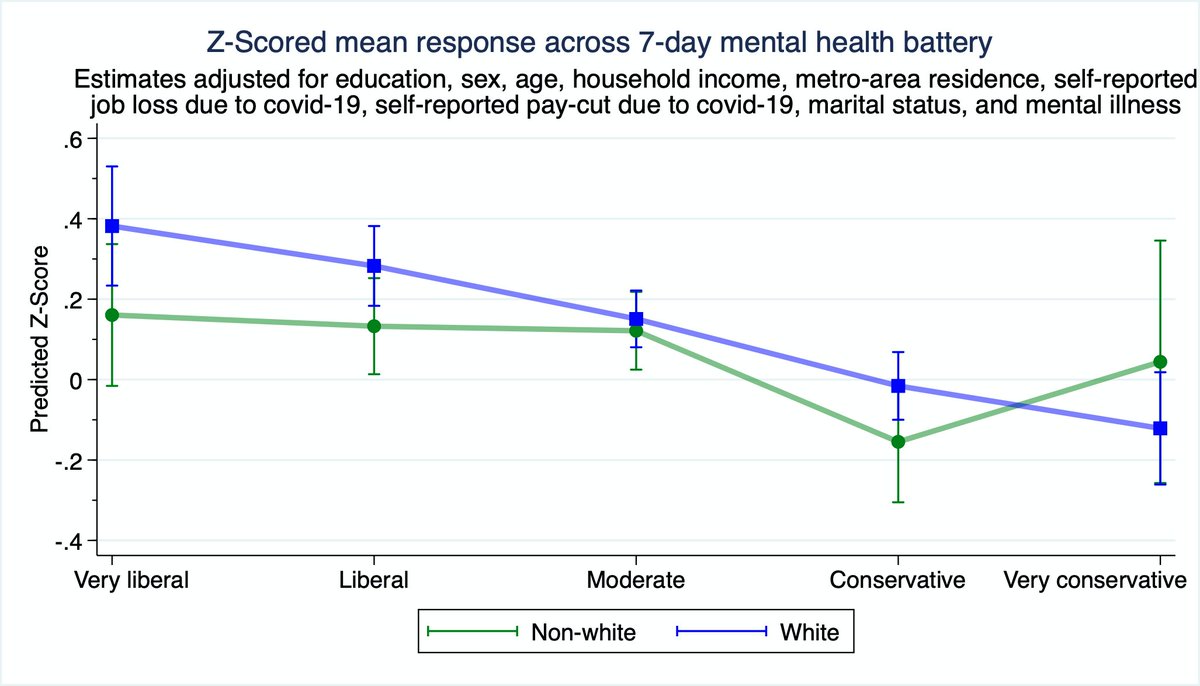
7/n In other words, at least some of the differences in the covid-mental health battery between white liberals and others are accounted for by the former's higher likelihood of being diagnosed with a mental health condition.
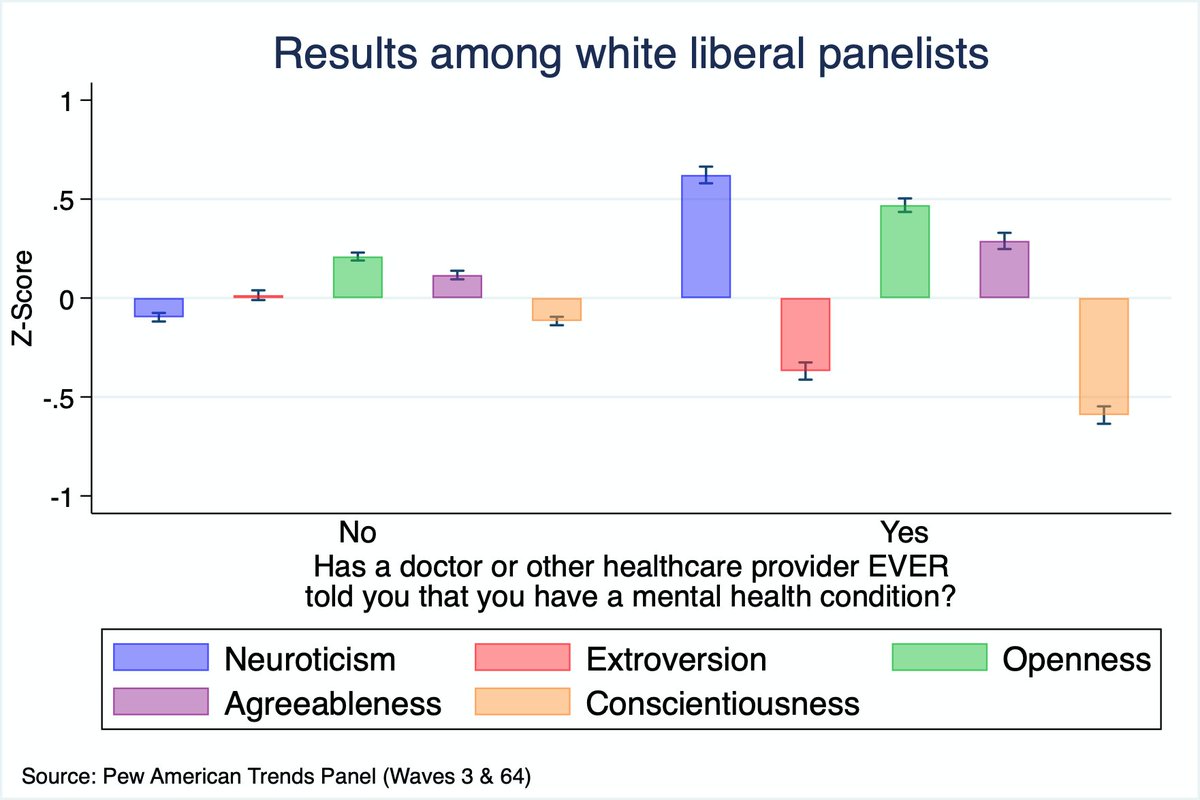
8/n It's possible that the disparities in self-reported diagnosis are simply or partly a function of white liberals being more likely to seek mental health evaluations. I don't have the data to answer this question. But given that they also tend to score higher on neuroticism..
9/n (and, not to mention, score lower on life satisfaction/happiness), I think at least some of this difference is genuine.
10/n I didn't write this thread to mock white liberals or their apparently disproportionate rates of mental illness (and you shouldn't either). Rather, this is a question that's underexplored and which may shed light on attitudinal differences towards various social policies.
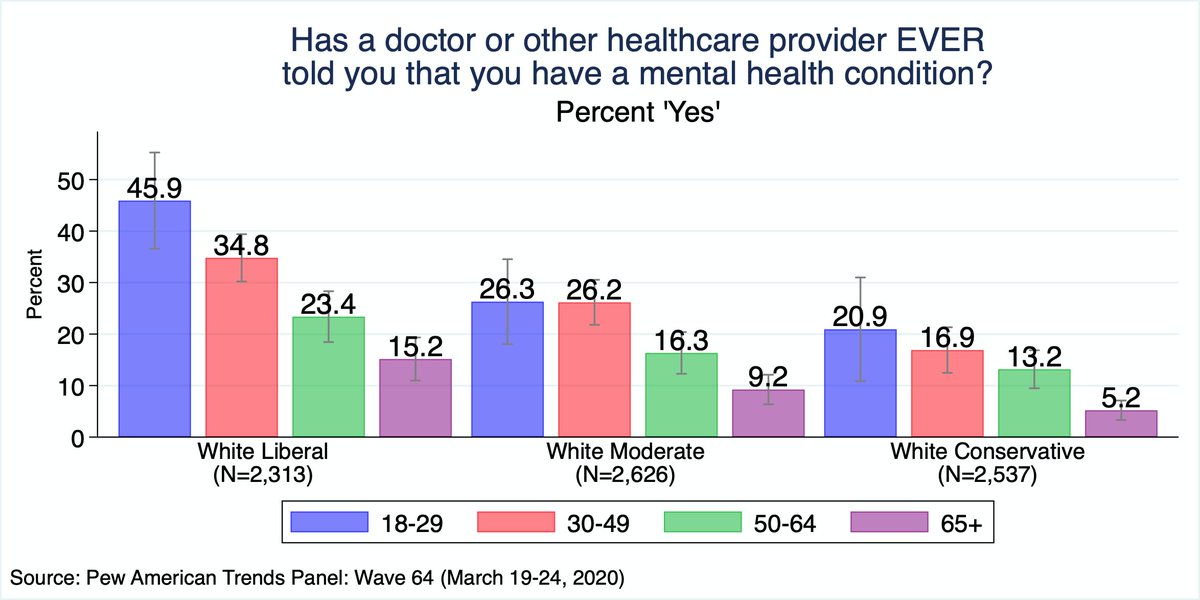
11/n Overall, and with one exception (white moderates), those in 18-29 age group are more likely to report being diagnosed with a mental health condition. The differences among white liberals, though, are striking: almost half of white liberals in this cohort report a diagnosis.
12/n @jean_twenge would like to get your thoughts on this. I know you've studied some of these trends.
13/n Big 5 personality profiles for white libs who report/don't report receiving a mental health condition diagnosis.
14/n One of the things that concern me about liberal social engineering and norm-promotion efforts is that they ostensibly cater to those who are emotionally fragile or those with specific personality profiles. Those with different personality profiles or have higher emotional..
15/n stability are just expected to shut up and deal with it.
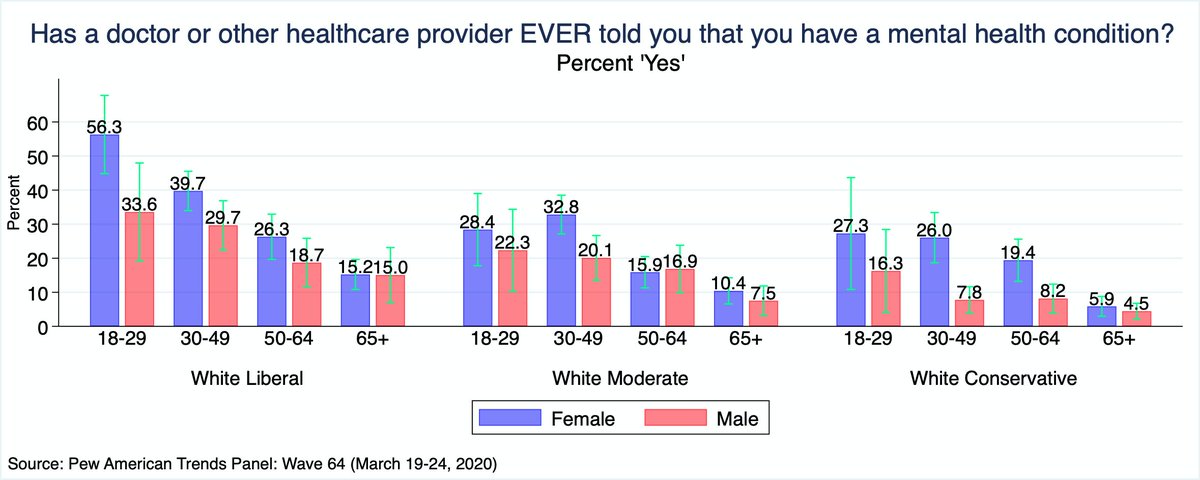
16/n Some of you asked for it, so here is the last chart broken down by gender. Biggest gap within age x ideological groups is between white liberal men (33.6%) and women (56.3%) in the 18-29 category
1/Thrilled to share @fsuigc’s latest report, based on a national survey of 1,447 U.S. adults we conducted in late September—one week after the assassination of Charlie Kirk.
We examine how Americans think about harmful speech and whether physical violence can ever be justified to stop its public expression.
1/ I'm delighted to finally share some of the work I've done since joining @fsuigc.
Last month, we published a report about political tolerance based on national survey data (N=1,004) we collected during the summer. In this study, we measure political tolerance as the willingness to interact with or accept people with opposing political views across different relational contexts. For comparison, we also measured tolerance towards ex-felons and flat earthers.
2/ As shown in the table below, across all contexts, people are much more willing to engage with people with opposing political views than the other two target groups. Regardless of the target group, though, openness tends to decline as the intimacy of an engagement increases. For instance, whereas 73% would engage in a social/recreational activity with political opponents (ex-Felon: 54%, flat-earther: 49%) without reservation, just 41% would be willing to date them (ex-Felon: 22%, flat-earther: 19%)
3/Consistent with this intimacy 'gradient', our analysis finds that our 7 tolerance items best fit a 3-factor structure, which is depicted in the table below.
1/ Updated racial ingroup vs. outgroup feeling thermometer differentials from the ANES. In sum, while the 'curve has flattened', the attitudinal effects of the Great Awokening persist (at least wrt race). If you thought or hoped otherwise, sorry to disappoint.
2/ In fact, coverage linking Israel to “genocide” now exceeds that of every actual or widely recognized genocide of the last 40 years, including:
Rwanda (1994)
Darfur (2003–2008)
Bosnia (Srebrenica, 1995)
Myanmar (Rohingya, 2017–Present)
Yazidis (ISIS, 2014–2017)
3/ In The New York Times, for example, the spike in 2023–2024 mentions of “genocide” alongside “Israel” is more than 9x larger than the peak for Rwanda in the mid-1990s and nearly 6x the peak for the more recent Darfur genocide.
1/ One of the more counterintuitive findings in my latest article:
Historically, when Democrats only control the House, an average of just over 10 race-conscious provisions are added to the NDAA per year.
When they control both the House and Senate? That number drops to about 4.
But why?
2/ First, what makes the House so powerful here?
Simple: the House Armed Services Committee (HASC) writes the first draft of the NDAA.
If you control the House, you control the blueprint—and the early language that often survives reconciliation. That’s where ideological riders get embedded.
3/But why are more race-conscious provisions added under divided government?
While I can’t say for sure, my reasoning is this: when Democrats only control the House, the NDAA becomes one of the few legislative vehicles guaranteed to pass.
Standalone race-conscious or DEI bills are less likely to survive the Senate.
🚨1/ Just released what may be my most significant project to date:
The first in-depth, data-driven account of how racial preferences actually operated at a U.S. service academy (the U.S. Naval Academy)—and the recent federal court case that challenged them (and lost).
Published on my Substack, the report draws on thousands of pages of filings, depositions, internal admissions data, and expert reports from Students for Fair Admissions v. USNA—a case that flew under the radar, despite its profound constitutional and institutional stakes.
2/ The full report runs ~115 pages—so there’s a lot to unpack. Too much for a single thread.
Thus, over the coming days, I’ll be posting a series of threads, each walking through key sections.
Note that these threads are high-level summaries—many important details are left out. I strongly encourage reading the full report for the complete picture.
Here’s the outline for this series of threads:
Thread 1 (this one): What the internal data reveal about USNA’s use of race—and how the Academy tried (and failed) to discredit the revelations.
Thread 2: The government’s sweeping (and evidence-free) justification for race-based admissions—and why it collapses under scrutiny.
Thread 3: How a federal judge upheld the policy—and why his ruling still matters, even after Trump’s executive order rescinded the policy.
Thread 4: What can be done to permanently outlaw race-based admissions at the service academies—or at least make it far harder for future administrations to reinstate them.
3/ Thread #1: What the Data Reveal
Like Harvard, USNA didn’t deny using race in admissions. It simply described it as “limited” and non-determinative.
At the same time, USNA admitted it never even attempted to measure race’s impact on outcomes—begging the question: how can it call race a “limited” factor if it never quantified its effect?