
1. This is COVID-19 progression data of the world projected on a log scale for 23 days
2. Y-axis is log-scale. Plotting started when COVID cases crossed 200 in any given country
3. So important point to remember is that on Y-axis
0=200
1=2000
2=20,000
3=2,00,000
4=20,00,000
2. Y-axis is log-scale. Plotting started when COVID cases crossed 200 in any given country
3. So important point to remember is that on Y-axis
0=200
1=2000
2=20,000
3=2,00,000
4=20,00,000
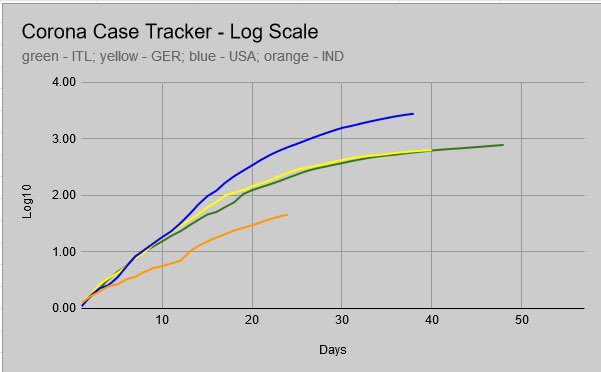
4. So on day-10 when other countries had crossed 7-8 thousand, India was in 1500 range.
5. Then Tablighi jamat fiasco happens. That point (looks like a sudden bump) is for all to see. That screwed up all the precautions of India for containing this pandemic.
5. Then Tablighi jamat fiasco happens. That point (looks like a sudden bump) is for all to see. That screwed up all the precautions of India for containing this pandemic.

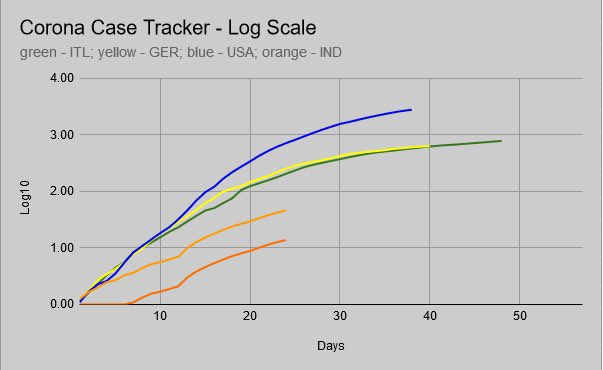
6. This is most important part. What is assumed here is only 60% of new cases (post tablighi Islamic event) is due to “single source”.
7. Assuming if only these 70% (it is actually 80% in many cases) had not happened, India’s graph would have looked like that dark orange line
7. Assuming if only these 70% (it is actually 80% in many cases) had not happened, India’s graph would have looked like that dark orange line

8. What this actually means is we would have been at around 2K to 3K cases today & not 8K if not for this tablighi sabotage
9. Point to note as @iMac_too has repeatedly said - even most of the pre-tablighi cases were mostly of peacefuls returning from ME & bringing corona along
9. Point to note as @iMac_too has repeatedly said - even most of the pre-tablighi cases were mostly of peacefuls returning from ME & bringing corona along
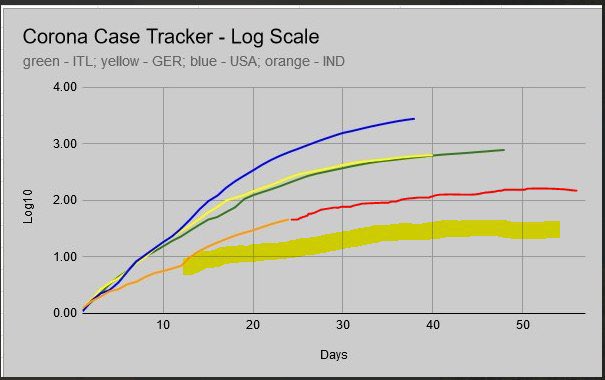
10. This is projecton of where India will probably plateau (compared to where India would have plateaued if not for Tablighi sabotage).
11. Stark difference. Matter of thousands of lives not being at risk. Lockdowns getting lifted earlier. Earlier recovery of economy.
11. Stark difference. Matter of thousands of lives not being at risk. Lockdowns getting lifted earlier. Earlier recovery of economy.
12. Who pays for medieval barbarism at full display on our streets? Disgusting and Barbaric behaviour with police and nurses and doctors?
13. Whole India pays
14. This manufacturer - (accidental??) distributor relationship betn China & tablighi jammies needs to be understood
13. Whole India pays
14. This manufacturer - (accidental??) distributor relationship betn China & tablighi jammies needs to be understood
Ending this thread with this image
Rāmdāsa swāmi imploring viTThala (pacifist form of Shri Hari) to take up arms. Here Indian state is that pacifist pānDuranga. It needs to shed this secular nonsense and deal with it with firm hands.
इथे का रे उभा श्रीरामा
मनमोहन मेघश्यामा
Rāmdāsa swāmi imploring viTThala (pacifist form of Shri Hari) to take up arms. Here Indian state is that pacifist pānDuranga. It needs to shed this secular nonsense and deal with it with firm hands.
इथे का रे उभा श्रीरामा
मनमोहन मेघश्यामा

PS —>
This simultaneous internal virus spread by tablighis and general misbehaviour and India-Pakistan land and maritime border and LOC heating up is happening in far too coordinated manner.
It has been noted.
This simultaneous internal virus spread by tablighis and general misbehaviour and India-Pakistan land and maritime border and LOC heating up is happening in far too coordinated manner.
It has been noted.
Special thanks to @khatvaanga ji for cataloging this data. And @Prasannasimha ji for model projection. 🙏🙏

