
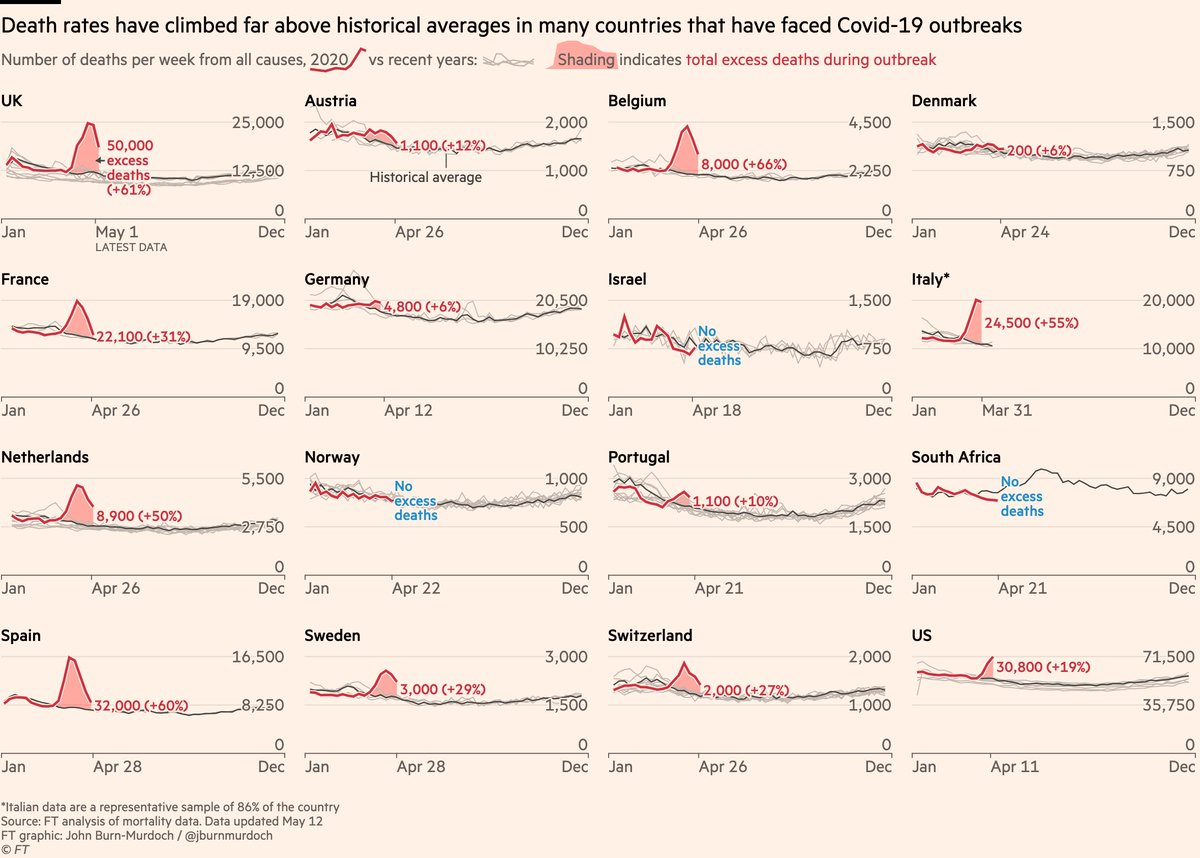
NEW: we’ve updated our excess mortality tracker, the gold-standard measure for Covid deaths, allowing like-for-like comparisons btwn countries
UK had 50,000 more deaths than usual in March & April vs 27,000 reported Covid deaths at the time
Free to read: ft.com/content/a26fbf…
UK had 50,000 more deaths than usual in March & April vs 27,000 reported Covid deaths at the time
Free to read: ft.com/content/a26fbf…
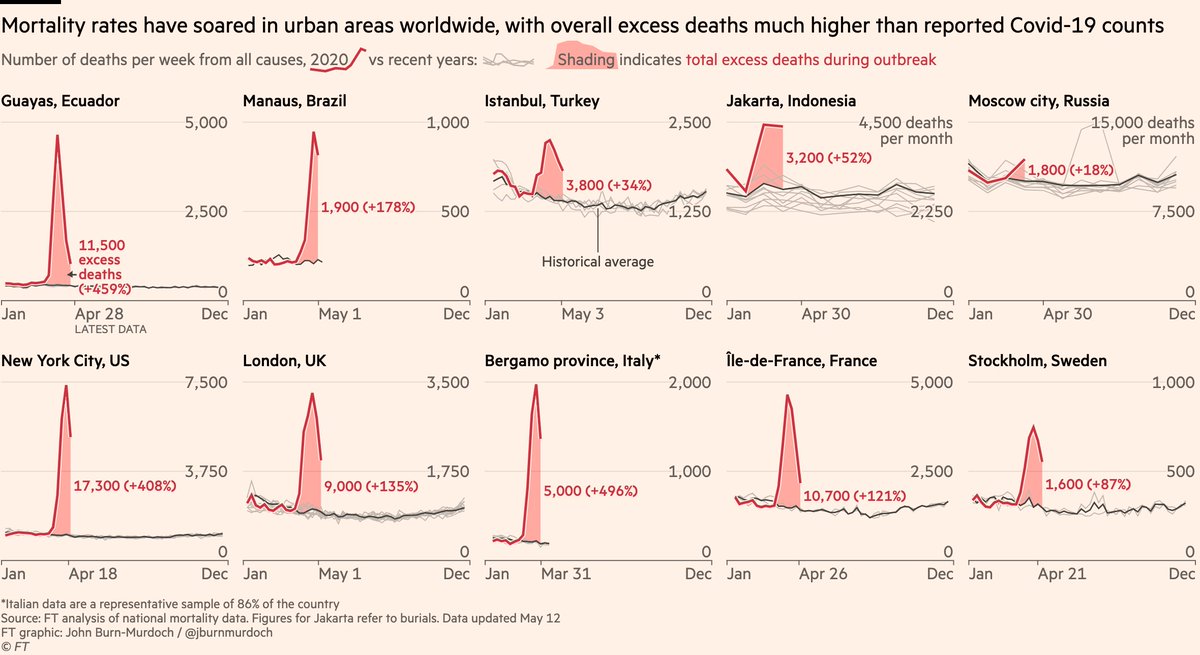
We’ve also added new data for the worst-hit cities and regions:
• We’re showing data for urban epicentres of Brazil, Turkey and Russia; all battling fierce outbreaks and under-reporting Covid deaths
• Excess death toll in Guayas province, Ecuador’s epicentre, continues to rise
• We’re showing data for urban epicentres of Brazil, Turkey and Russia; all battling fierce outbreaks and under-reporting Covid deaths
• Excess death toll in Guayas province, Ecuador’s epicentre, continues to rise
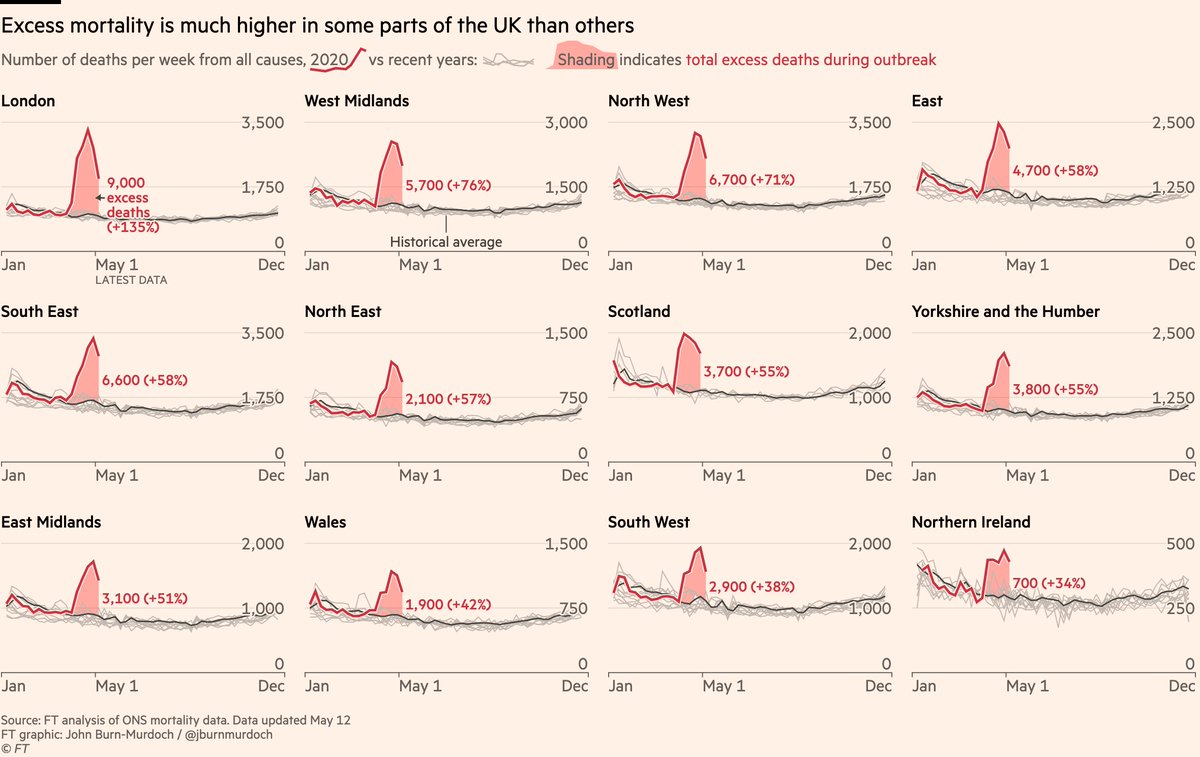
We now have excess mortality data for all UK countries & regions.
Deaths in March & April were:
• 66% higher than usual in England
• +55% in Scotland
• +42% in Wales
• +34% in Northern Ireland
New story today from @ChrisGiles_ on UK excess deaths: ft.com/content/40fc89…
Deaths in March & April were:
• 66% higher than usual in England
• +55% in Scotland
• +42% in Wales
• +34% in Northern Ireland
New story today from @ChrisGiles_ on UK excess deaths: ft.com/content/40fc89…
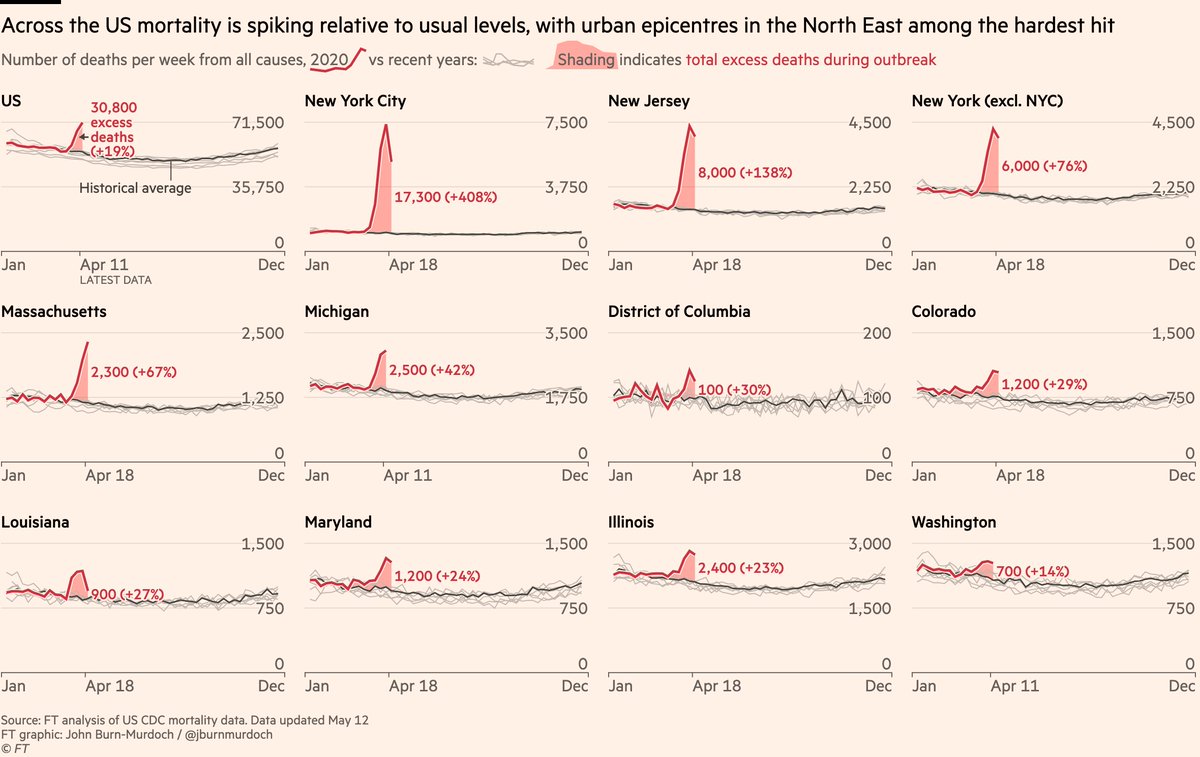
In the US, we’ve added more states as data has arrived.
Urban North East still the epicentre, but several other states and D.C. also affected.
Nationally, US was already on 30,800 excess deaths by April 11. That was relatively early in US outbreak, and this number will rise.
Urban North East still the epicentre, but several other states and D.C. also affected.
Nationally, US was already on 30,800 excess deaths by April 11. That was relatively early in US outbreak, and this number will rise.
Overall across the 22 countries for which we have excess mortality data, we find 207,000 excess deaths during recent weeks.
This is 63% higher than the number of Covid deaths reported in these countries at the time.
Data for all countries: ft.com/content/a26fbf…
This is 63% higher than the number of Covid deaths reported in these countries at the time.
Data for all countries: ft.com/content/a26fbf…
More talk today about UK having Europe’s highest death toll.
Today’s @ONS number can’t be compared to other countries, so definitive answer here will come from excess deaths.
Right now, impossible to say if UK is worst in Europe, as Italy has only published March excess deaths.
Today’s @ONS number can’t be compared to other countries, so definitive answer here will come from excess deaths.
Right now, impossible to say if UK is worst in Europe, as Italy has only published March excess deaths.
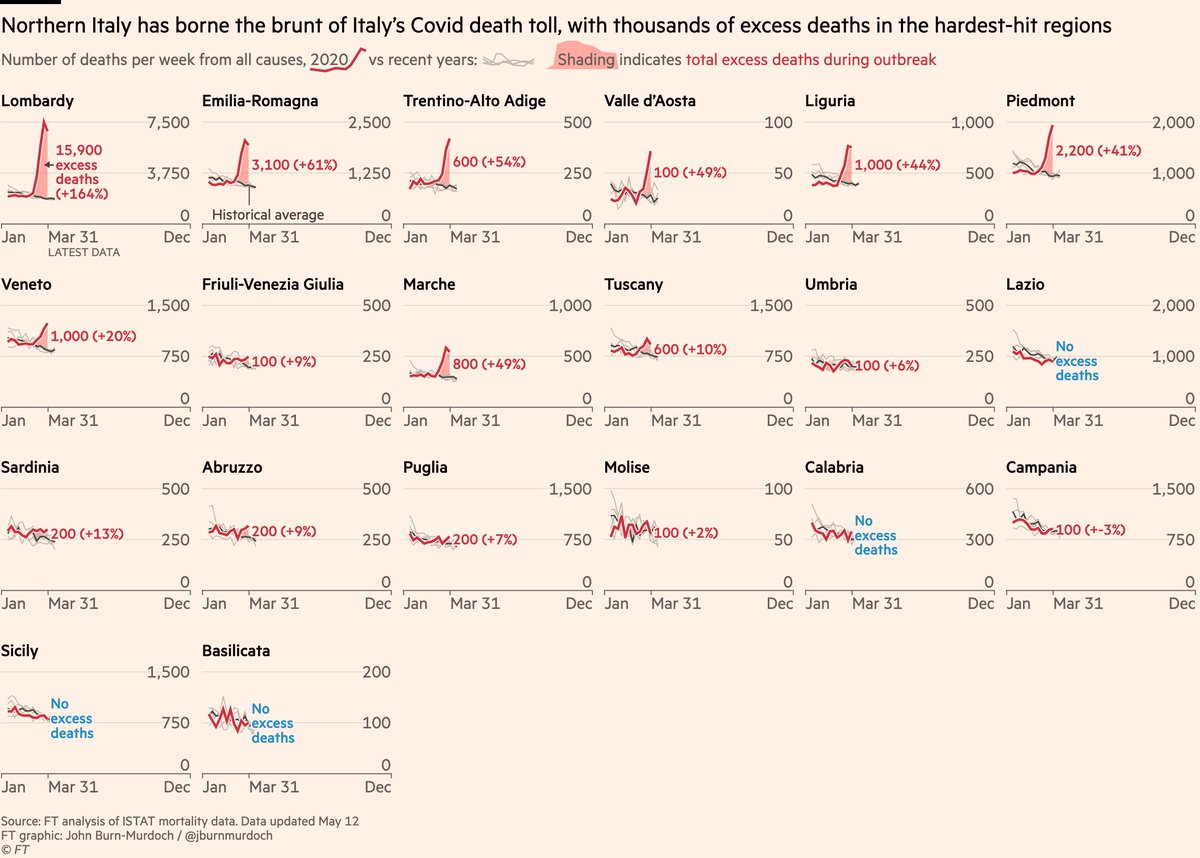
One other metric for whether a country handled its Covid crisis well is how many regions suffer bad outbreaks.
Here’s Italy’s data at region level, sorted north to south.
Lombardy was hit hard, and two other northern regions saw excess deaths of 50%+, so that’s 3/19 regions
Here’s Italy’s data at region level, sorted north to south.
Lombardy was hit hard, and two other northern regions saw excess deaths of 50%+, so that’s 3/19 regions
Here’s the UK.
9/12 regions have excess deaths above 50%.
Utility of the "how many regions" measure is it shows whether a country managed to contain its outbreak in one broad area, as Italy & China did.
Bad outbreaks in multiple regions suggest action was taken too late.
9/12 regions have excess deaths above 50%.
Utility of the "how many regions" measure is it shows whether a country managed to contain its outbreak in one broad area, as Italy & China did.
Bad outbreaks in multiple regions suggest action was taken too late.

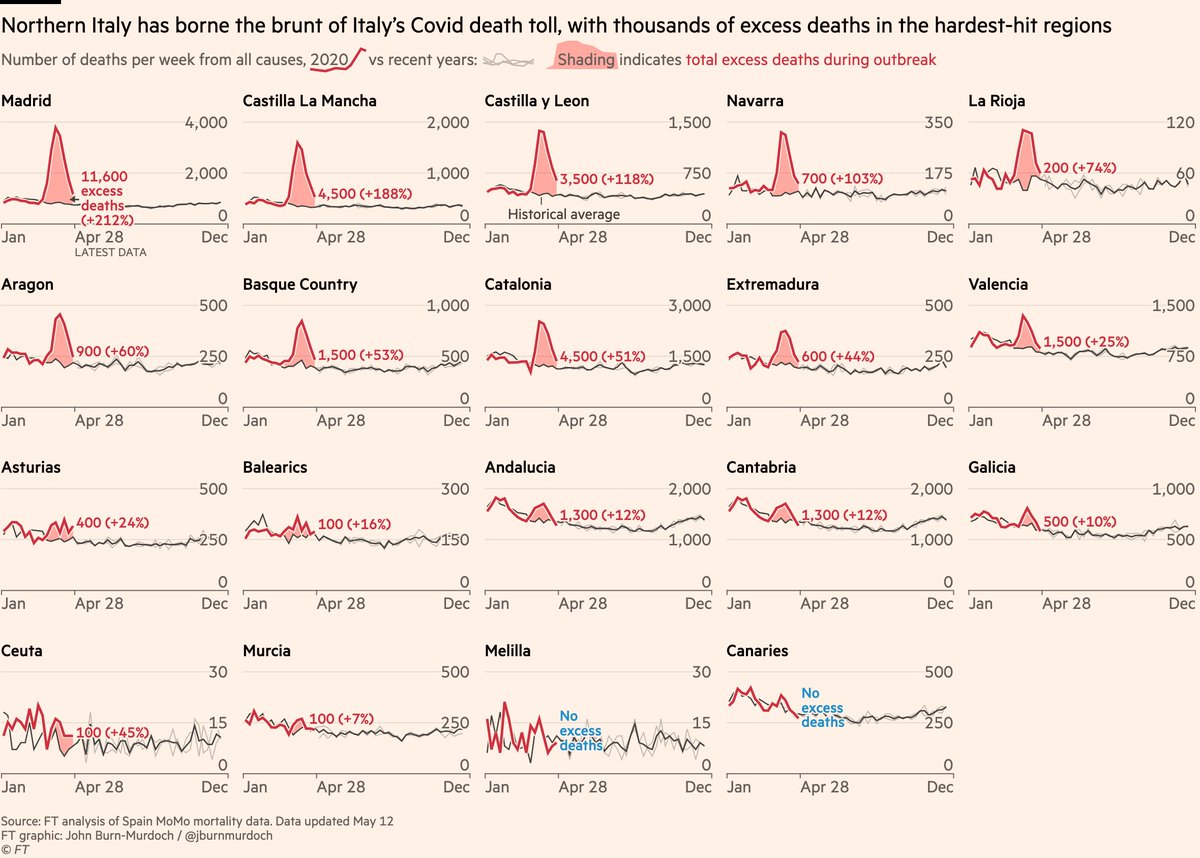
Here’s the same for Spain.
Many Spanish regions had very severe outbreaks. Four saw all-cause deaths double, and a total of 8/19 saw at least a 50% spike.
Many Spanish regions had very severe outbreaks. Four saw all-cause deaths double, and a total of 8/19 saw at least a 50% spike.
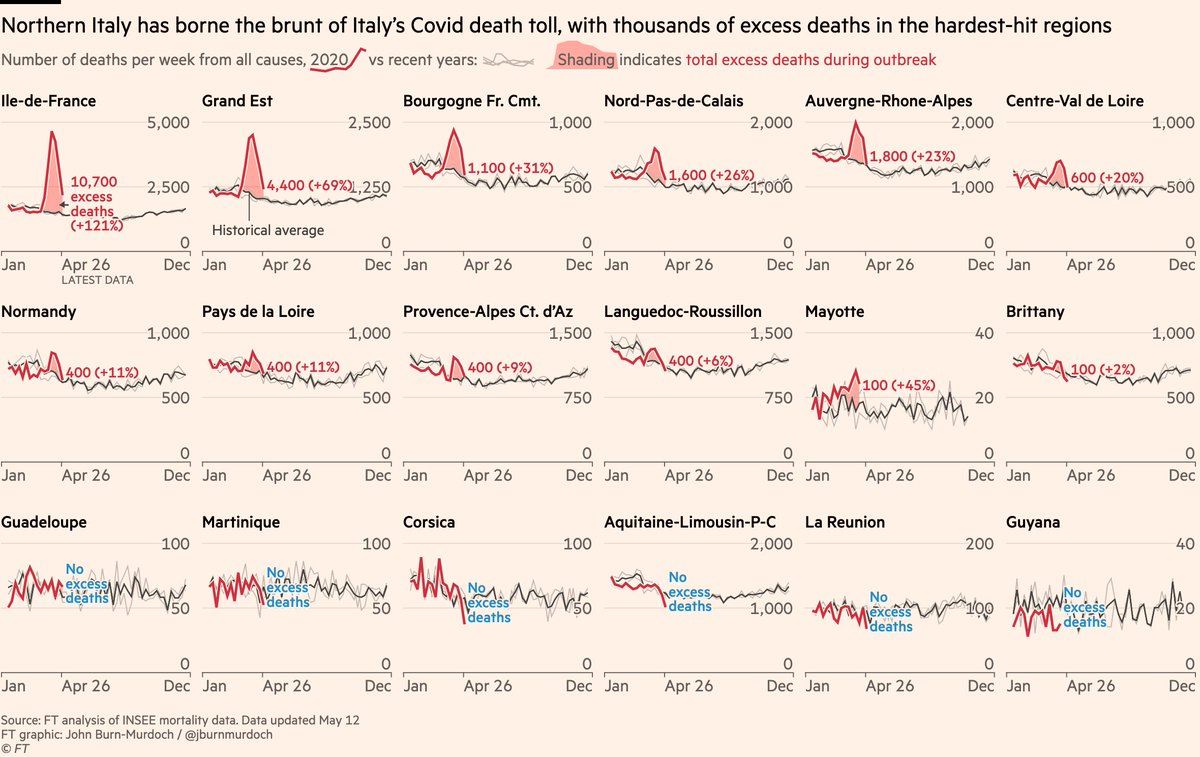
And now France.
Paris suffered badly, and the Grand Est also faced a bad outbreak, but although most other regions were affected none saw all-cause deaths increase by 50% or more.
Paris suffered badly, and the Grand Est also faced a bad outbreak, but although most other regions were affected none saw all-cause deaths increase by 50% or more.
Please point me to more all-cause deaths data.
India & Mexico are our top targets, but any country is appreciated.
Ideally daily, weekly or monthly data, for multiple years, and including 2020. Can be for one town or city, not just nationally.
📦➡ coronavirus-data@ft.com 🙏
India & Mexico are our top targets, but any country is appreciated.
Ideally daily, weekly or monthly data, for multiple years, and including 2020. Can be for one town or city, not just nationally.
📦➡ coronavirus-data@ft.com 🙏


