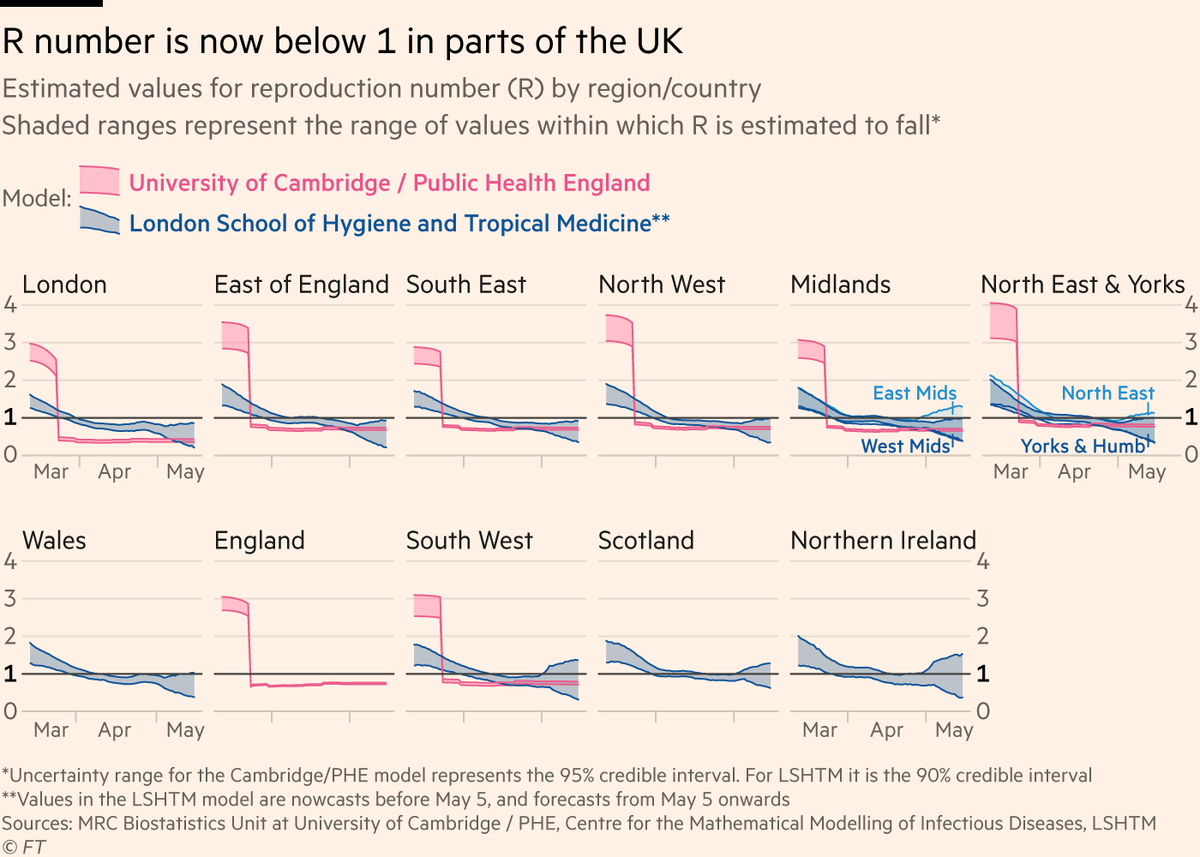
Two models from leading epidemiologists put Covid-19 R number below 1 in many parts of UK.
Models from @LSHTM and @MRC_BSU/@PHE_uk put R below 1 in London, South East and East. May be slightly above 1 in Scotland, N. Ire
Story -> ft.com/content/a3145d…

1) ⚠️ Uncertainty ranges! ⚠️ We’re deliberately not plotting central estimates or indeed any hard numbers here, because the models produce ranges not precise numbers.
LSHTM (blue) based mainly on cases data, hence steady evolution.
Cambridge/PHE (pink) includes data on mobility levels & lockdown, giving a more sudden step-change.
These are methodological differences. Neither necessarily more "true".
Some reports today that UK R number could be creeping back up towards 1. As you can see, the concept of a UK-wide R number is misleading.
Like outbreaks themselves, the reproduction number also varies from place to place.
This is very possible, and it’s both wrong and dangerous to assume R crossing below 1 is the end. What goes down very much can go up.


