A personal information manager / IDE with a DAG as it’s underlying data structure. This allows for a single node to appear in multiple places which enables Xanadu style transclusion of content in multiple locations.
• • •
Missing some Tweet in this thread? You can try to
force a refresh
Here’s a thread on Semantic Zoom — a UI design pattern that is becoming prominent in the design scene with AIs enabling multi-level text summaries.
You can get all of these in one place in the Github repo here which will be synchronized as I add to this thread: github.com/prathyvsh/sema…
Semantic zoom is an interaction technique for making the information density in a UI artefact coarser/finer. The representation / functionality afforded at a particular level of detail aligns with the user intent.
TIL that light is an eigenvector of a Lorentz Transformation! I think this means that light plays the role of an invariant when you try to shift between two bases. For example: something like say truth value of an expression when you shift between two logical systems studying it.
I am right now in the middle of researching something else and will have to return to this later, but this page has some real nice pedagogic material on Special Relativity: jila.colorado.edu/~ajsh/sr/sr.ht…
Here is another animation from Wikipedia. Line crossing the vertical axis are sequential events and the line crossing horizontal axis simultaneous ones. The diagonals that remains invariant indicates light. Funny how this shows connections with linear algebra and order theory.
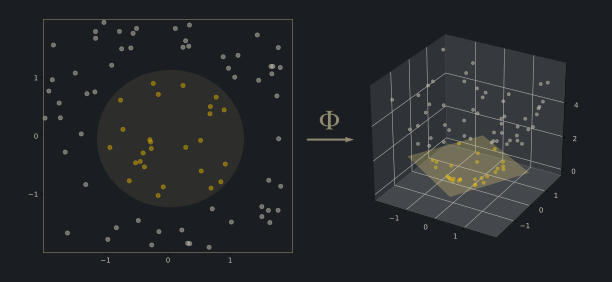
Can’t claim to have even remotely understood this article with the intended precision, but I just loved the exposition of ”Are deep networks just kernel machines?” here: m0nads.wordpress.com/2021/05/09/are…
Stumbled on this discrete visualization of fundamental theorem of calculus by @PeterSaveliev and thought it was amazing!
This is a neat video to watch on how Leibniz conceived his version of fundamental theorem of calculus using the harmonic triangle and telescoping sums:
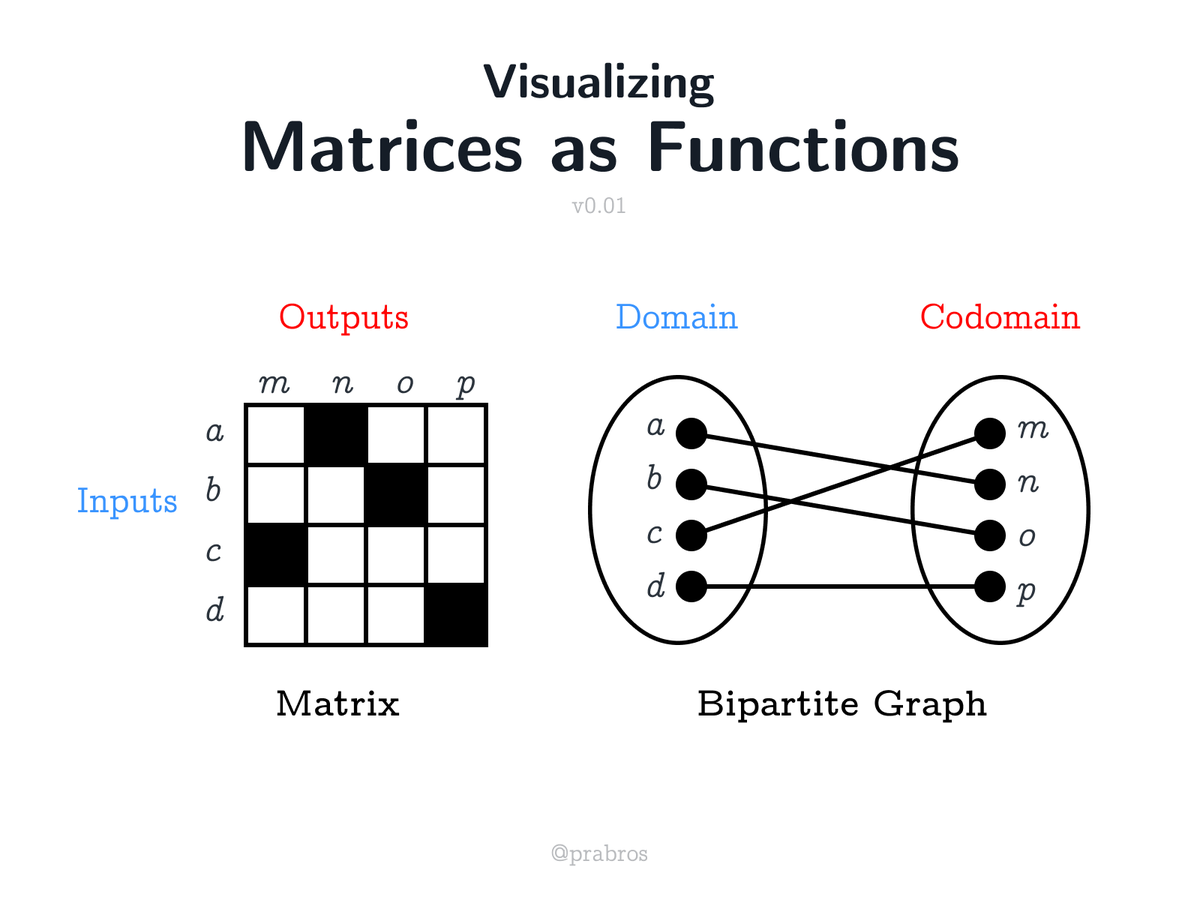
Matrices can be visualized as functions! This enables us to see matrix multiplication as function composition. In this thread let us take a visual tour of these mathematical ideas. To get this thread as a PDF: patternatlas.com/v0/matrices-as…
I stumbled on this idea as a part of my logical explorations. I saw how the matrix way of representing things has an intertwining between simultaneity and sequentiality which is awesome! Let us start uncovering the ideas here by representing matrices as pixel grids.
Let us label the matrix and understand how to represent arbitrary connections. A dark square in the pixel grid means a connection exists between a row element and a column element. A row element can be thought as an input and the corresponding column elements its outputs.
Catalog of Programming Languages for the Enthusiast: Starting a curation on some of the cool indie / lesser known programming language projects I have been stumbling on.
Starting off with Pikelet by @brendanzab. It is a continuous source of inspiration to see Brendan starting from game dev and getting into deep type theory stuff! Check out his language Pikelet: github.com/pikelet-lang/p… and his twitter stream for updates on his work.
I encountered Koka when researching about algebraic effects. Papers from Daan Leijen on its semantics and technical details are available here: microsoft.com/en-us/research…