1/ Big news: We’ve launched a new and revamped version of our Government Salaries Explorer.
We updated the design to be even clearer and more accessible + helpful.
Here’s what it is and how to use it. bit.ly/3e50zTK
We updated the design to be even clearer and more accessible + helpful.
Here’s what it is and how to use it. bit.ly/3e50zTK
2/ The explorer provides detailed salary data for all of the 113 agencies in state government and every position at each of those agencies.
It will be updated four times a year, meaning data will be a lot more up-to-date than it’s been in the past. bit.ly/2LGSJn9
It will be updated four times a year, meaning data will be a lot more up-to-date than it’s been in the past. bit.ly/2LGSJn9
3/ This new version has important context like salary ranges for selected positions.
And we’ve added even more interactive charts and tables to enable comparisons across tenure, ethnicity and gender. bit.ly/3bOBTgG
And we’ve added even more interactive charts and tables to enable comparisons across tenure, ethnicity and gender. bit.ly/3bOBTgG
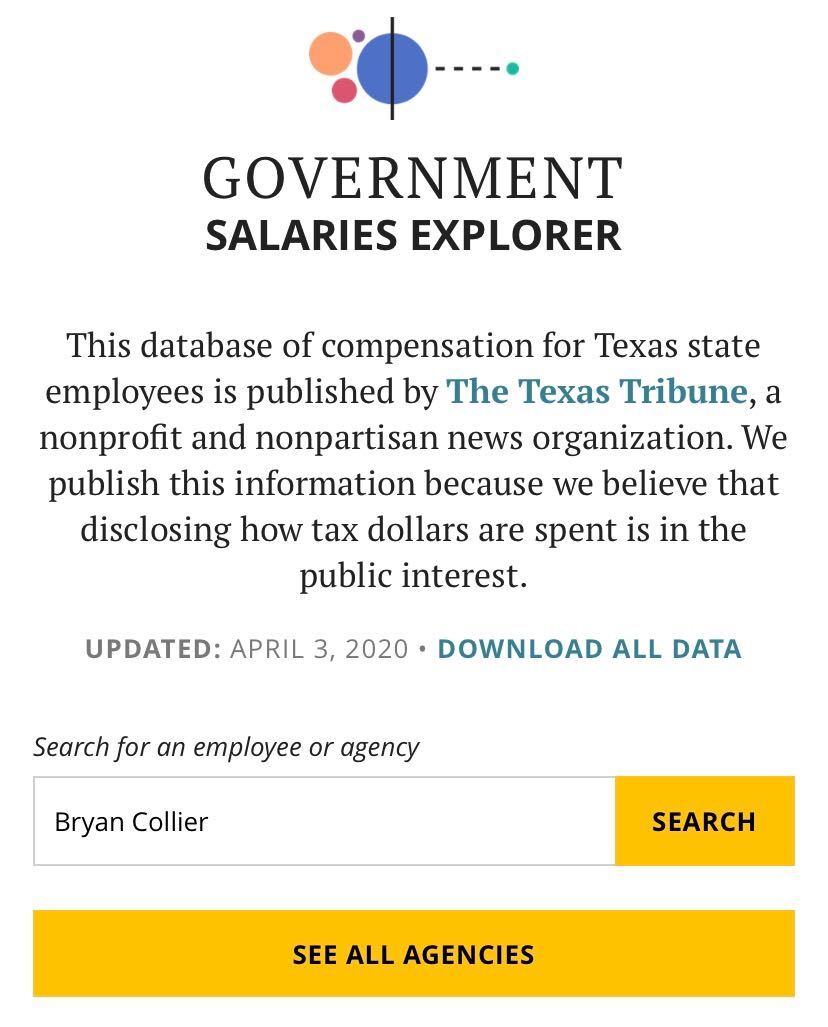
4/ So, how do you use it?
If you are searching for a specific state government worker, type their name in the search bar.
You can also view a complete list of agencies along with their total number of employees and median salary. bit.ly/3e50zTK
If you are searching for a specific state government worker, type their name in the search bar.
You can also view a complete list of agencies along with their total number of employees and median salary. bit.ly/3e50zTK
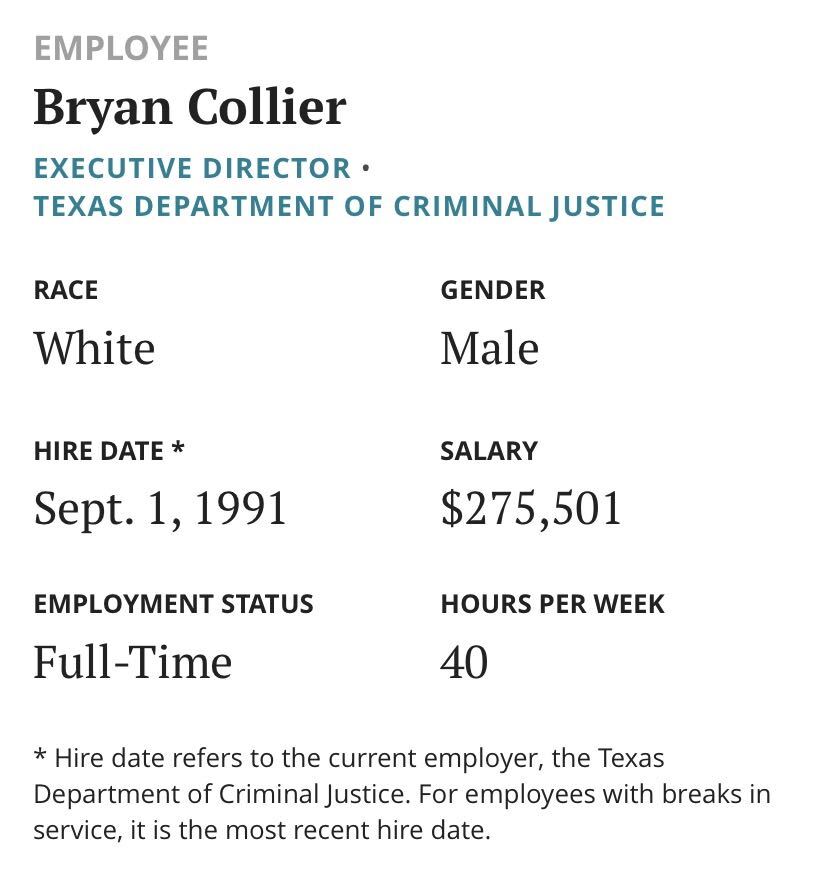
5/ Once you find who you’re looking for, you’ll be able to view information like their hiring date, salary, and employment status, and see their employment history with the state. bit.ly/3e50zTK
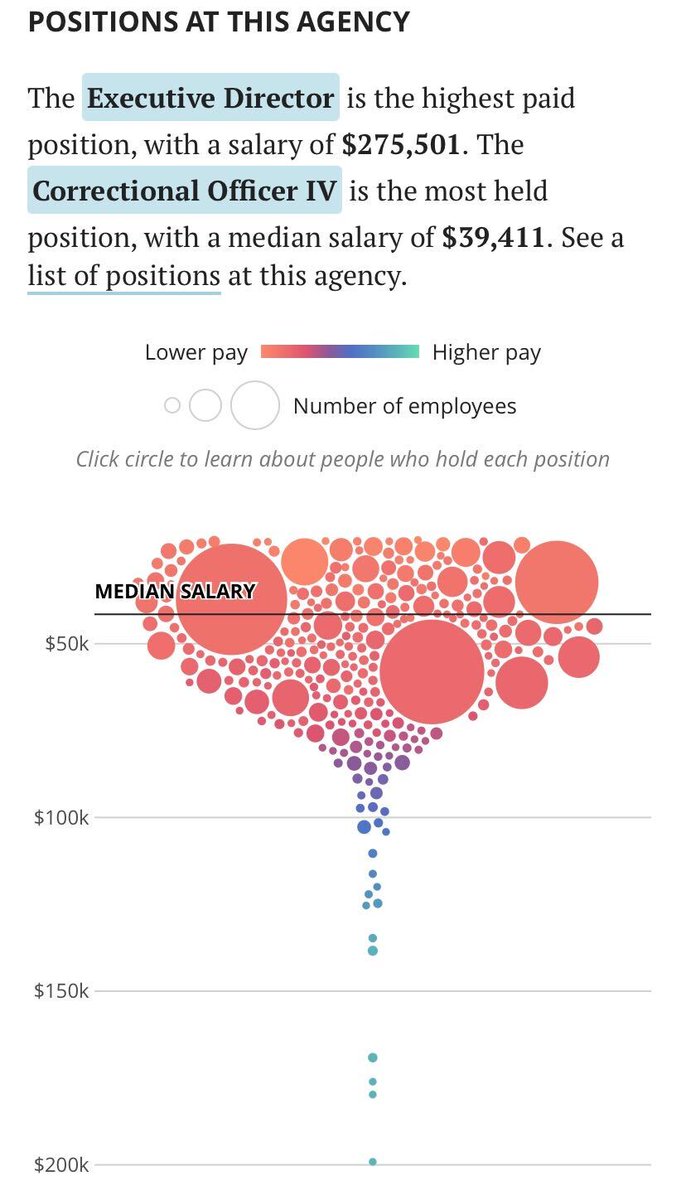
6/ If you are viewing a specific agency, you can use this interactive chart to understand how much workers with different job titles are making as well as the pay gap between the lowest-paying and highest-paying positions. bit.ly/3bOBTgG
7/ The explorer no longer includes salaries for university, public hospital or local government employees.
With this new focus, we’re better able to ensure our data is accurate and up to date.
With this new focus, we’re better able to ensure our data is accurate and up to date.
8/8 As part of designing the new site, we surveyed more than 1,000 readers about how we could make the data more useful to them. We hope you’ll enjoy using it!
Here are some of the frequently asked questions about the explorer: bit.ly/2ZscMxP
Here are some of the frequently asked questions about the explorer: bit.ly/2ZscMxP