
Get Started Building Software (in 1 twitter thread)
I believe everyone should build. Building is the only real validation of our ideas. There is no better way to learn.
Today, that usually means software. I think of software as today's woodworking. Today's metalsmithing.
I believe everyone should build. Building is the only real validation of our ideas. There is no better way to learn.
Today, that usually means software. I think of software as today's woodworking. Today's metalsmithing.
Anyone can build a basic application, with all the major pieces needed to seed more elaborate projects and learning down the road.
Software is about expression. If you want to express your ideas with more than just form, you need to add function.
Let's get started.
Software is about expression. If you want to express your ideas with more than just form, you need to add function.
Let's get started.
You only need a browser, a notepad, and your computer's terminal (command prompt on PC).
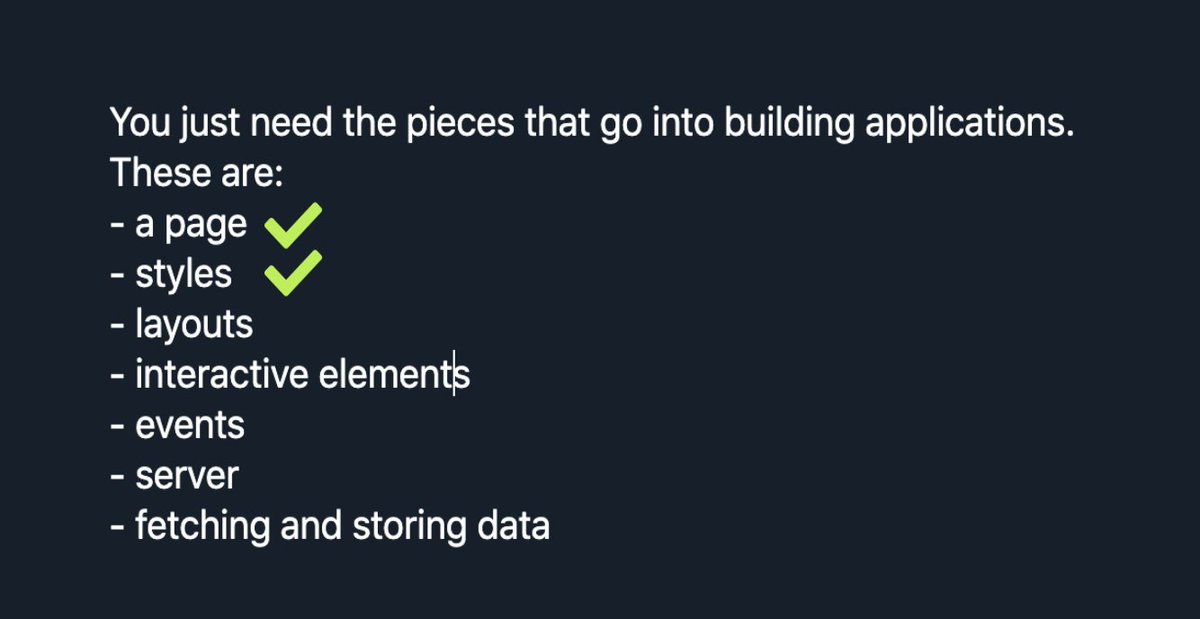
There are a few high-level pieces that go into building all applications:
- a page
- styles
- layouts
- interactive elements
- events
- server
- fetching/storing data
Let's cover these:
There are a few high-level pieces that go into building all applications:
- a page
- styles
- layouts
- interactive elements
- events
- server
- fetching/storing data
Let's cover these:
People rarely write programs from the ground up anymore. That's too slow. Today we use libraries.
We will use JavaScript and Python libraries.
I will choose Azle for front-end stuff and Flask for back-end stuff.
Let's start with our page. Pages always have an index.html file
We will use JavaScript and Python libraries.
I will choose Azle for front-end stuff and Flask for back-end stuff.
Let's start with our page. Pages always have an index.html file
Go to azlejs.com and click on the STARTER HTML icon in the top left. Copy and paste this into notepad (I am using TextWrangler, same idea), then save the file as index.html (on your Desktop). 
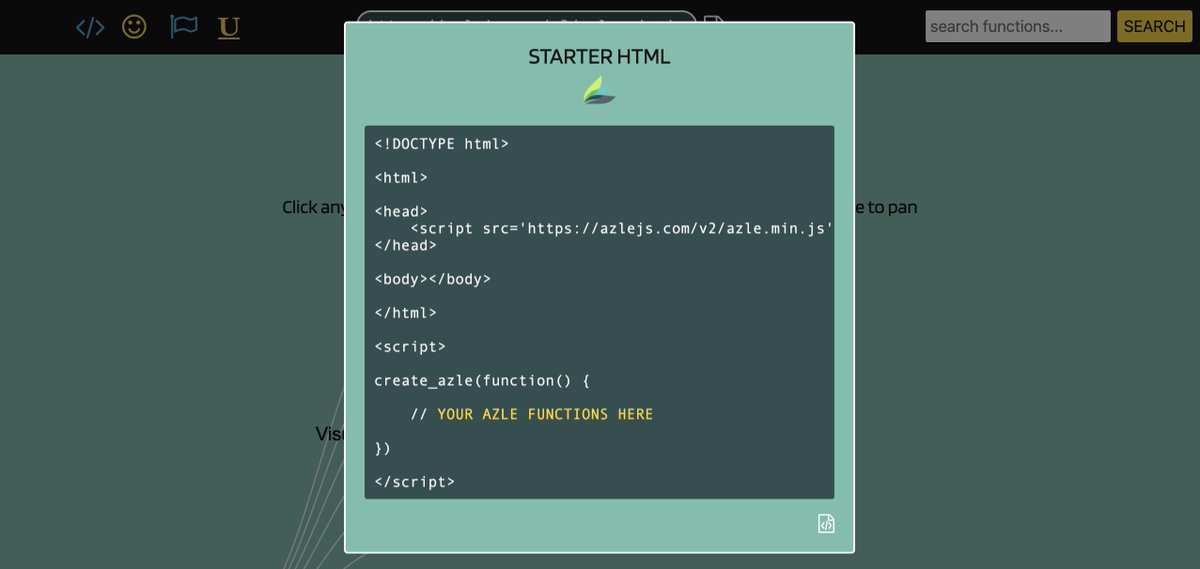
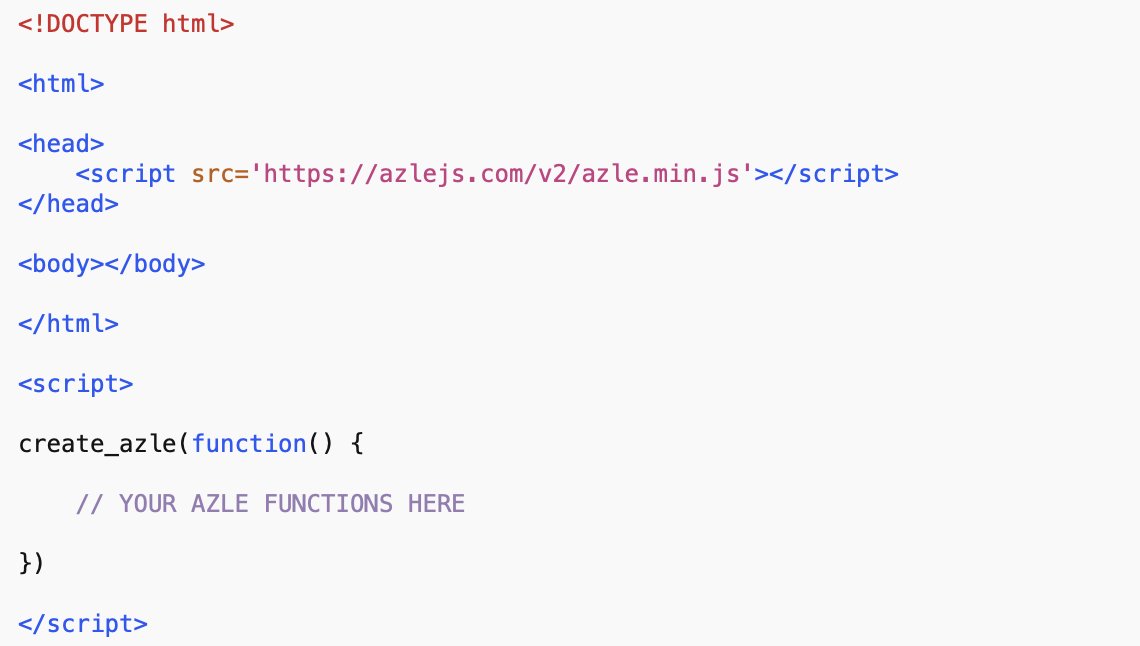
Every web application has an index.html file. It's the "page" your browser points to.
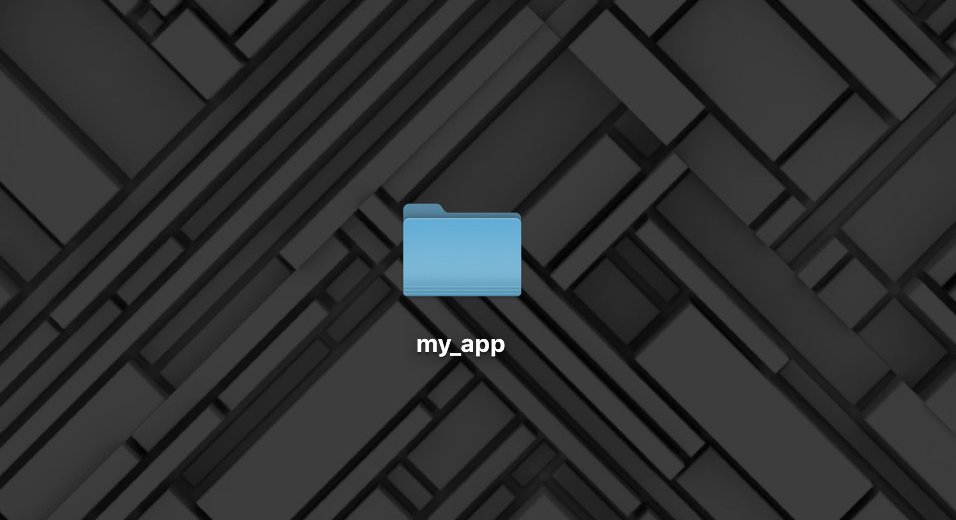
Let's place the file in a folder called my_app, and drag your index.html file into this folder:
Let's place the file in a folder called my_app, and drag your index.html file into this folder:
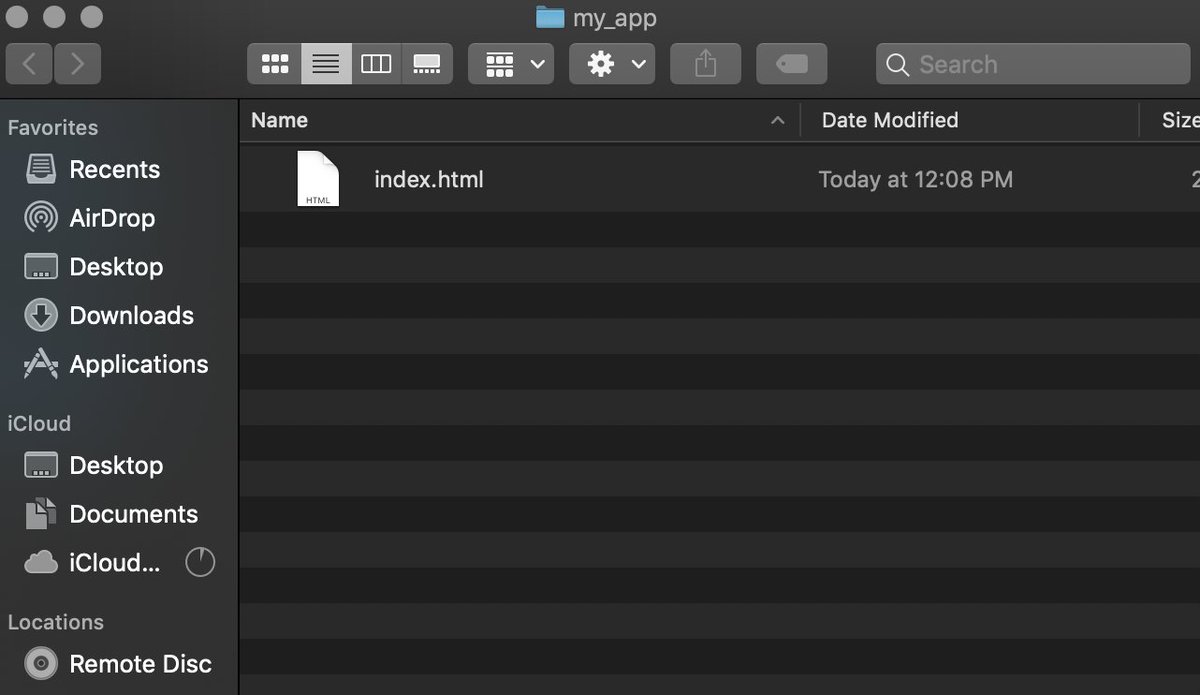
If you right-click the index.html file and choose your browser you can view the page. Doing that now will pop open your browser and show a blank page.
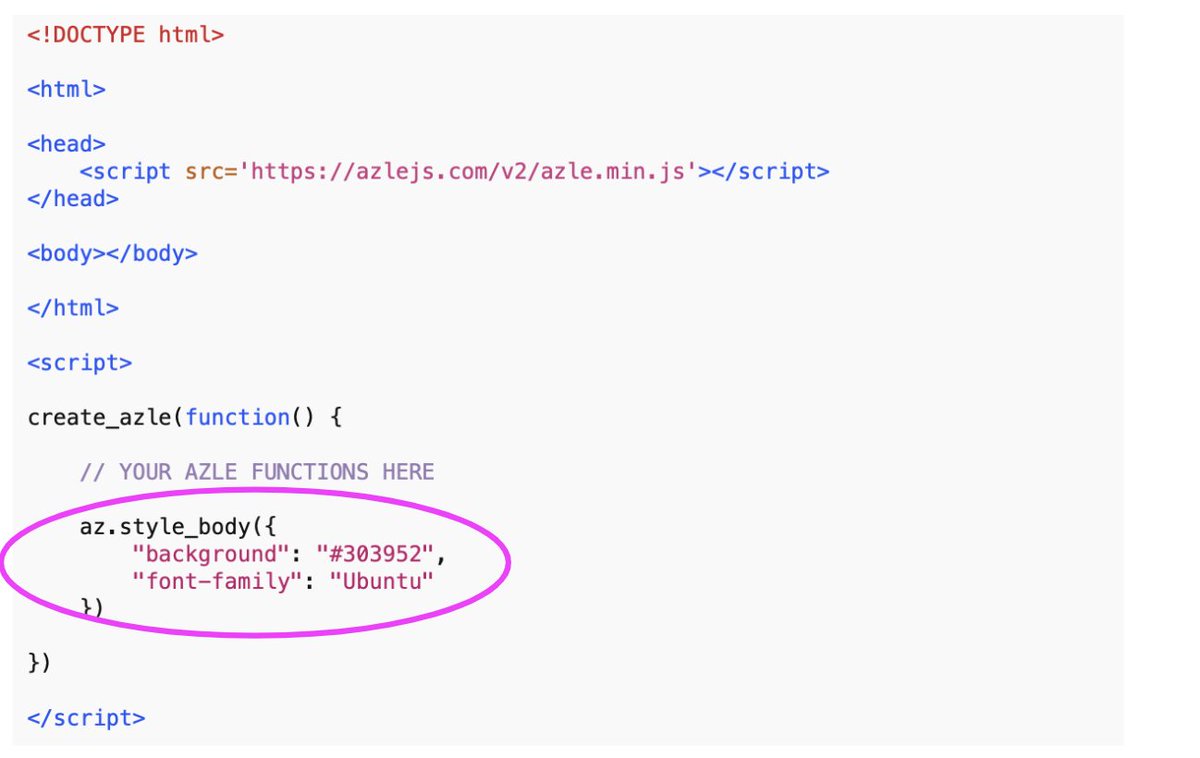
Let's style the page. Good docs tell you how to use their syntax. Go grab the style_body code and paste it into your index.html file.
Don't be like Reddit and think you're cool cuz yer ugly. Go grab some minimalist hex codes and style your page like its 2020.
Nothing says I'm modern like Russian pastel:
flatuicolors.com/palette/ru
Nothing says I'm modern like Russian pastel:
flatuicolors.com/palette/ru
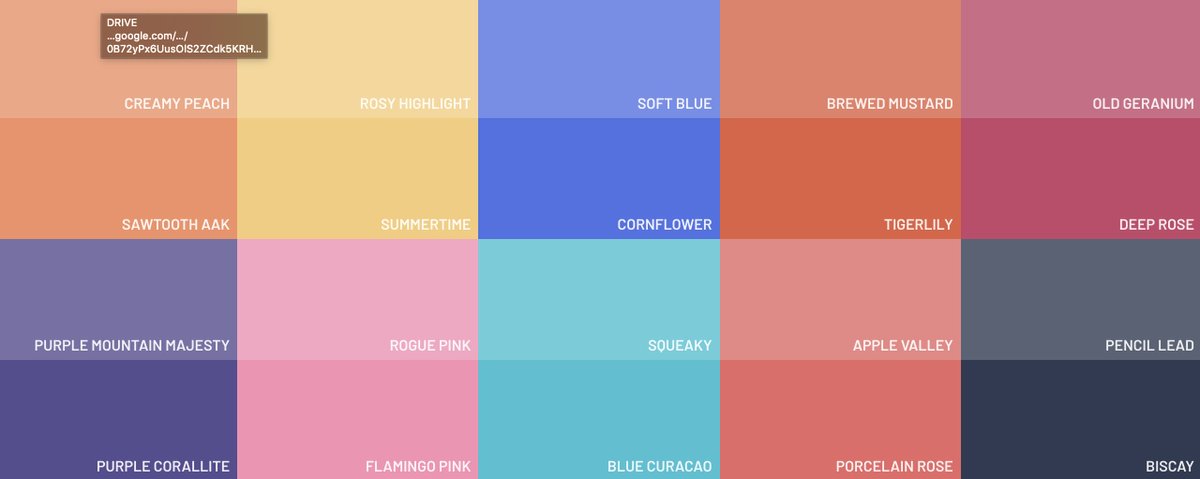
Choose your favorite color by clicking on it. Replace the "background" color in the style_body function with your new color.
I'll choose Biscay.
We also don't want to use standard browser fonts because the only thing worse than looking like Reddit is looking like Craigslist.
I'll choose Biscay.
We also don't want to use standard browser fonts because the only thing worse than looking like Reddit is looking like Craigslist.
Google fonts to the rescue:
fonts.google.com
I'll choose Ubuntu. Nice and modern looking.
Our style_body function now looks like this:
fonts.google.com
I'll choose Ubuntu. Nice and modern looking.
Our style_body function now looks like this:
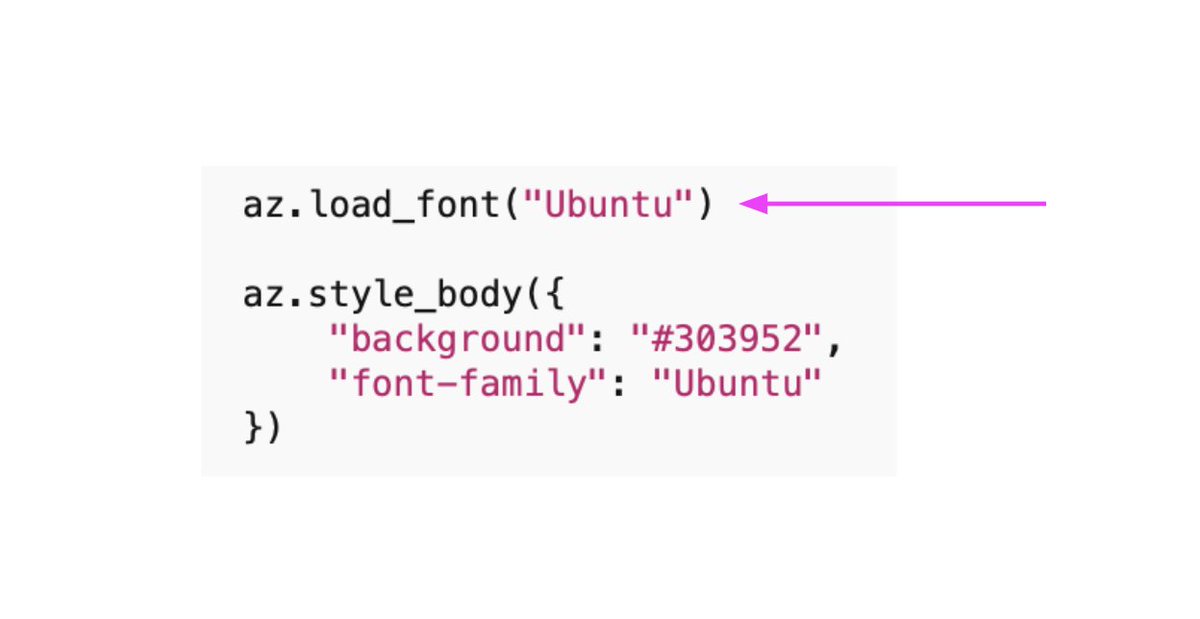
Of course we need to make our Google font available. Let's load that prior to calling our style_body function (remember, docs tell you how to do stuff. Search for "font" in the docs to find the load_font function):
Refresh your browser and you'll see its new background color:

Making progress...
Of course nothing is on our page. Let's change that.
We will add a section to hold our content. Add 1 section now and refresh your browser:
We will add a section to hold our content. Add 1 section now and refresh your browser:
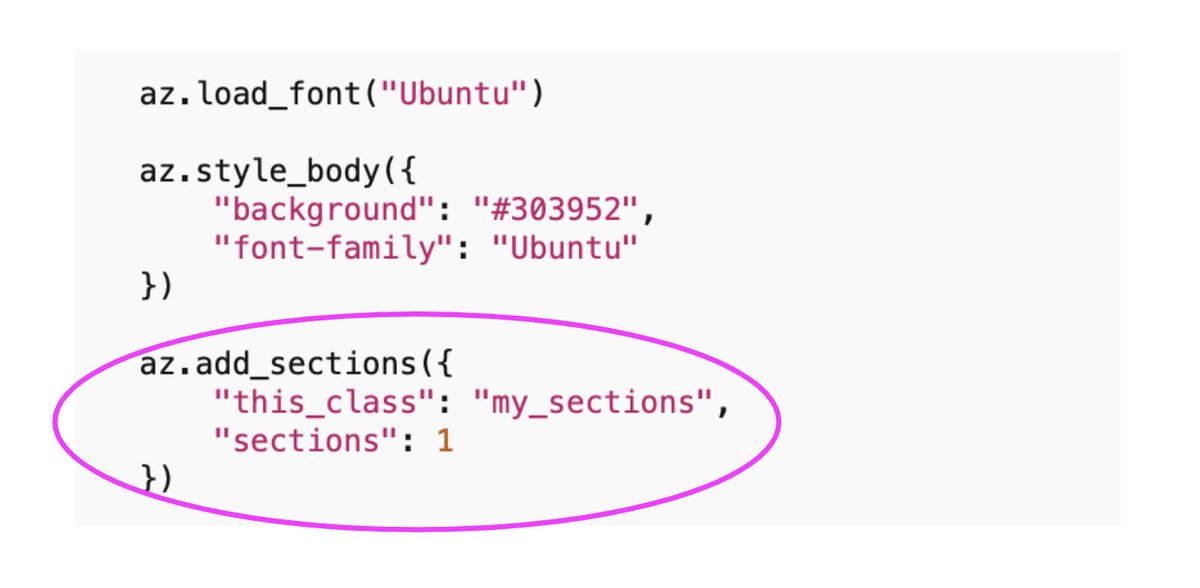

A big blue section appears. Kinda tacky. Let's head back to Russia and see if we can fix that.
Use the style_sections function to style our new section. Note how we are targeting the class name we gave our section ("my_sections"):
Use the style_sections function to style our new section. Note how we are targeting the class name we gave our section ("my_sections"):

This reads as "style the first element with the class name 'my_sections' using the background color I choose."
I will choose Apple Valley as my color. Not sure it's any less tacky but to each their own:
I will choose Apple Valley as my color. Not sure it's any less tacky but to each their own:

Since we want to arrange things on the page we will use layouts. These are just grids; boxes placed on the page, which we fill with text, buttons, sliders, inputs, etc.
I'll add a layout with 2 rows and 1 column:
I'll add a layout with 2 rows and 1 column:

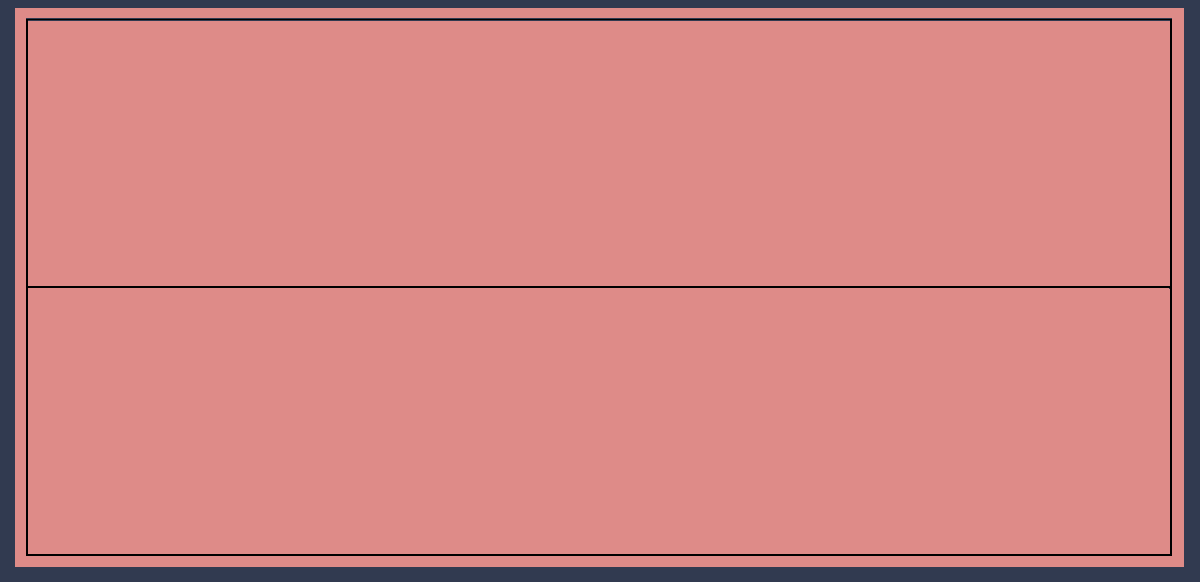
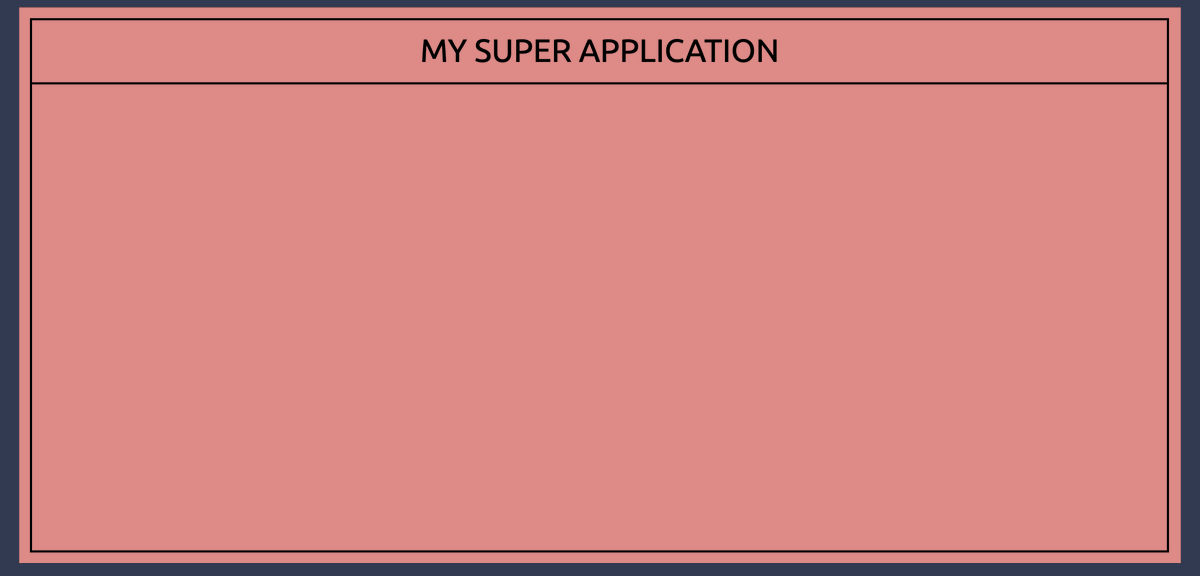
I want the top row to hold my title. First, I'll change its height by targeting the first row of my layout and styling accordingly:
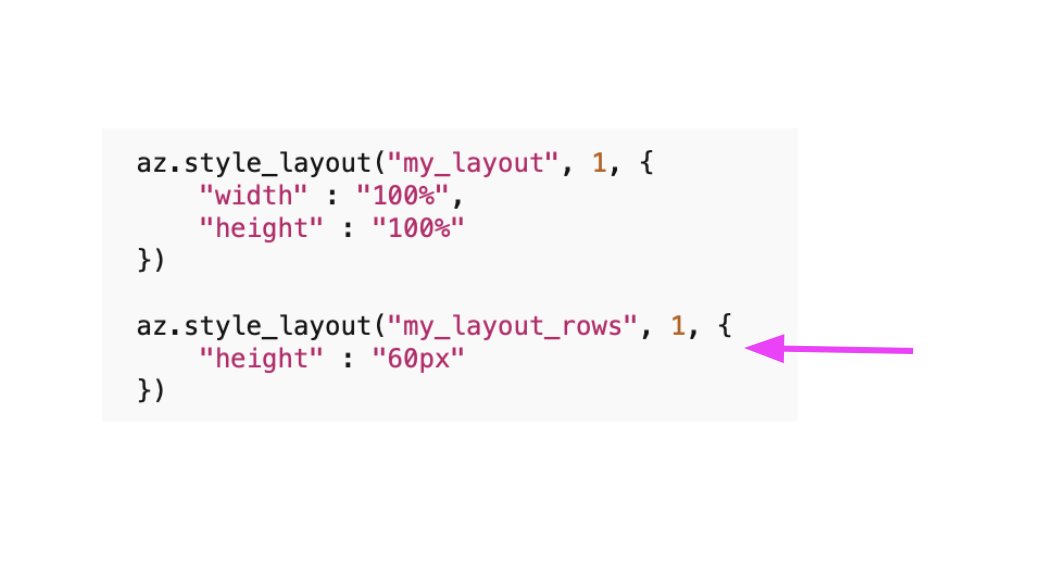
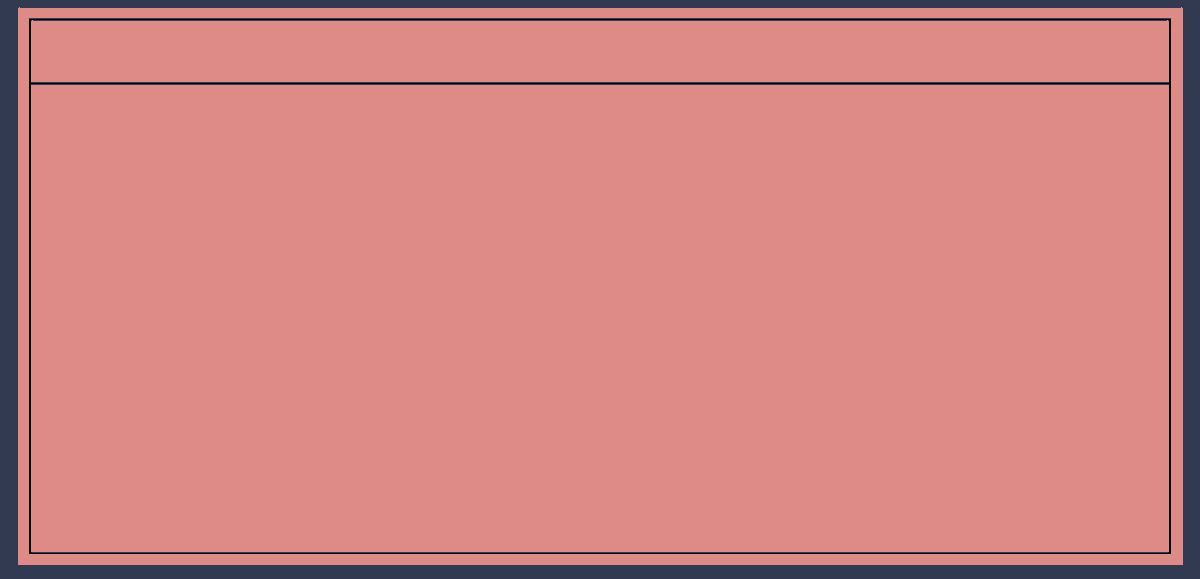
Everything we've been adding inside the curly braces of our style functions is standard CSS styling. As you try to figure out how to achieve the styles you want you search online for the right CSS. With time you will learn many styling tricks.
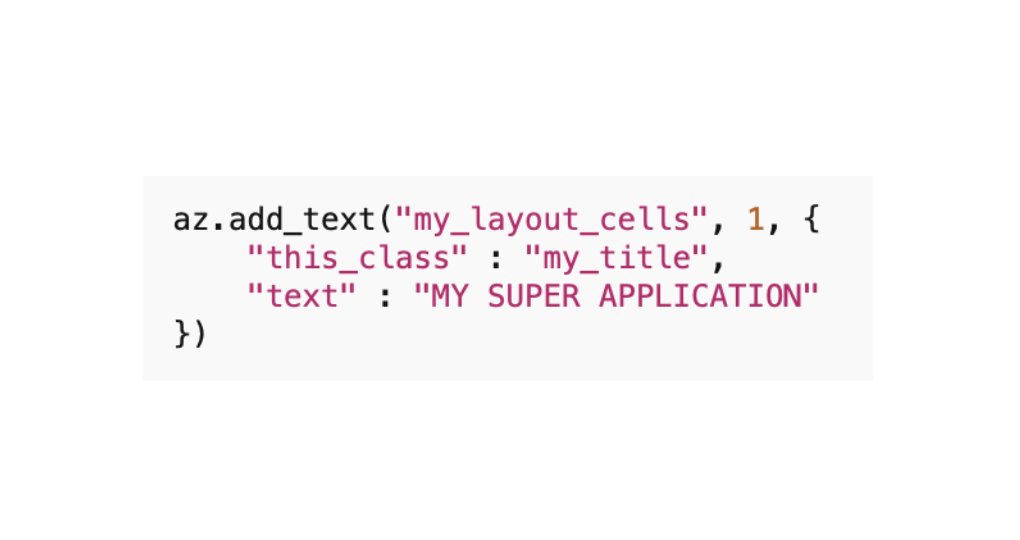
Let's go ahead and show off the Ubuntu font we loaded earlier by adding a title to our application. We target the first cell of our layout and choose some text:

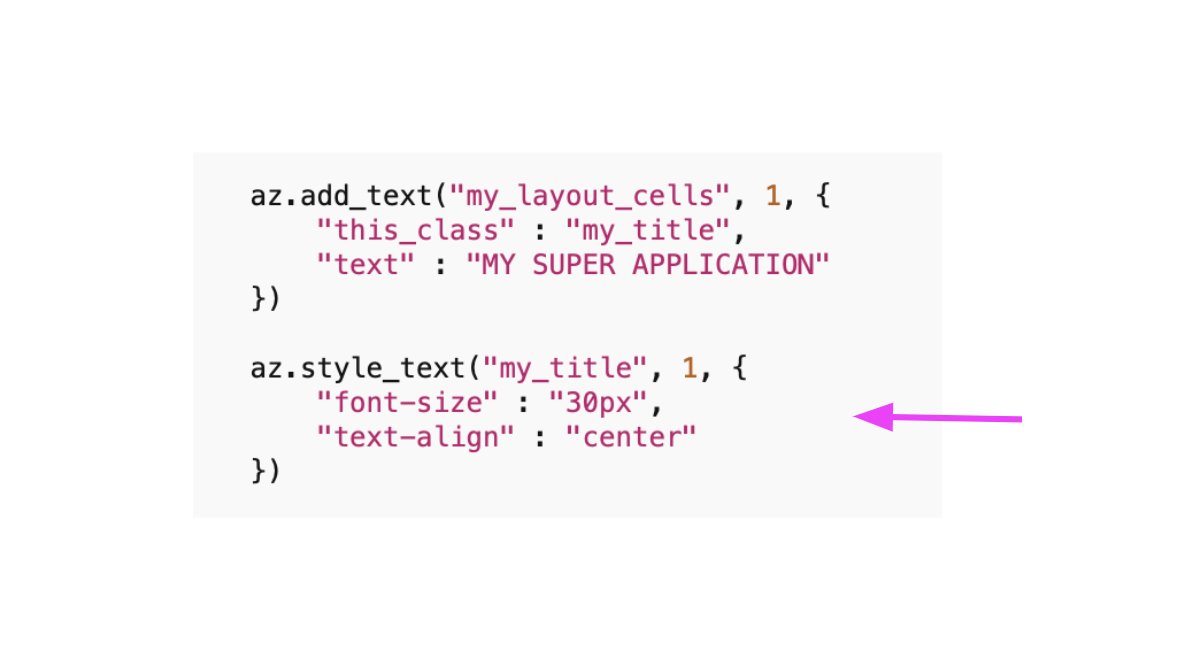
Let's increase the font size of our title, and center its alignment:
Pretty good so far. Now things get more interesting, as our next step is adding interactive elements to our application.

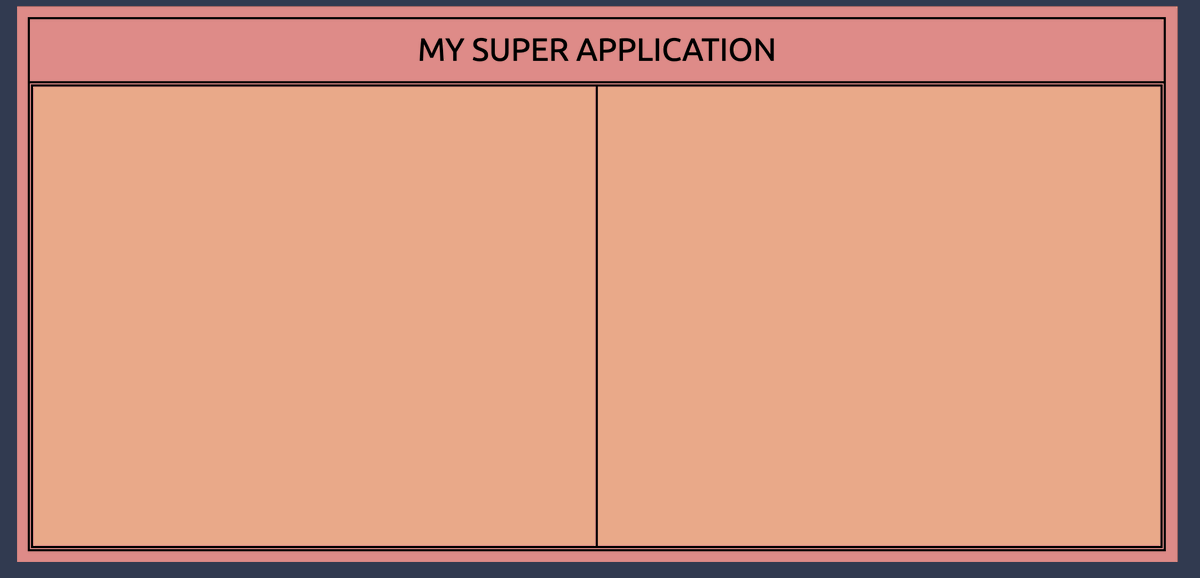
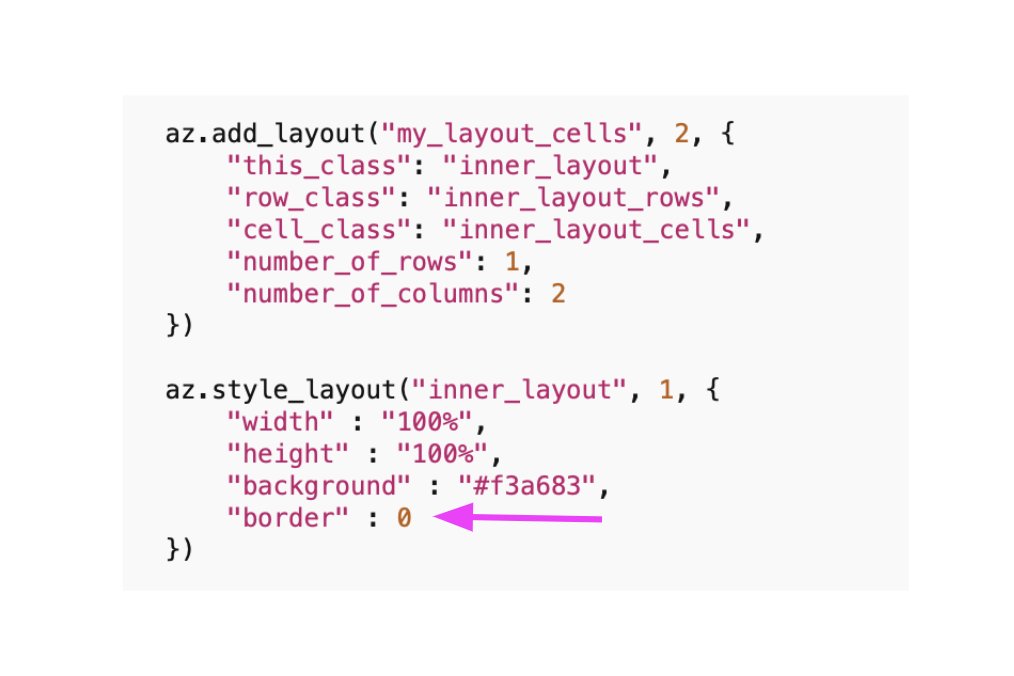
First, let's add another layout inside our 2nd cell to hold our interactive elements. Copy the same layout code we used before, pasting it at the bottom.
Target the 2nd cell of our original layout, use 1 row, 2 columns, and color the background creamy peach (or whatever):
Target the 2nd cell of our original layout, use 1 row, 2 columns, and color the background creamy peach (or whatever):

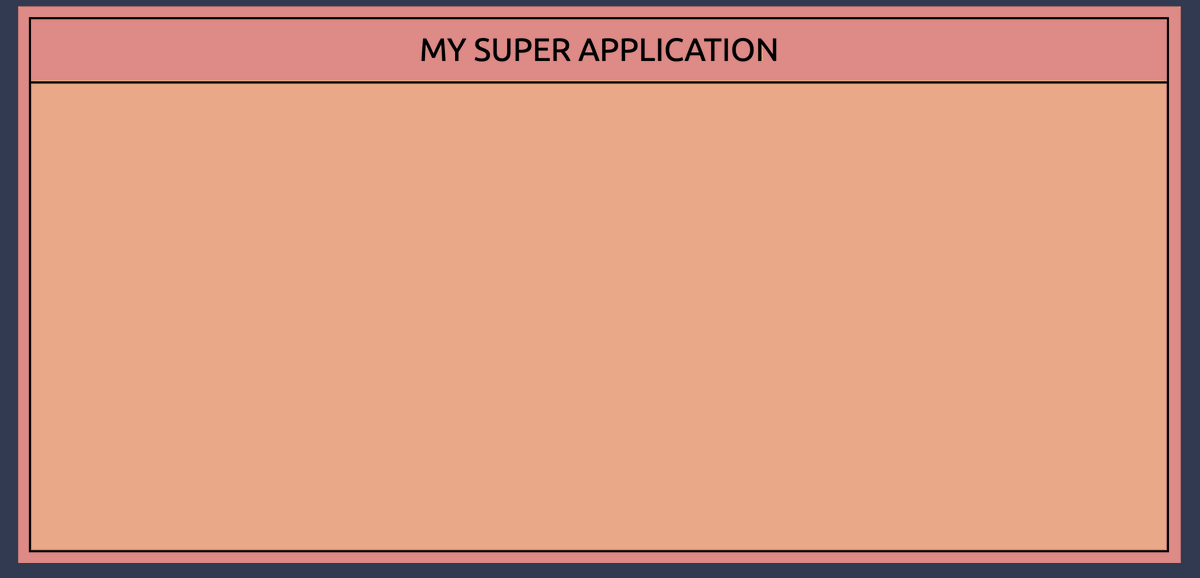
The app looks too "liney." Let's remove the bordering from our most recent layout:
That's cleaner. However I still want some kind of separation between the 2 cells of our inner layout. Let's color the 2nd cell "Squeaky" from our Russian palette:
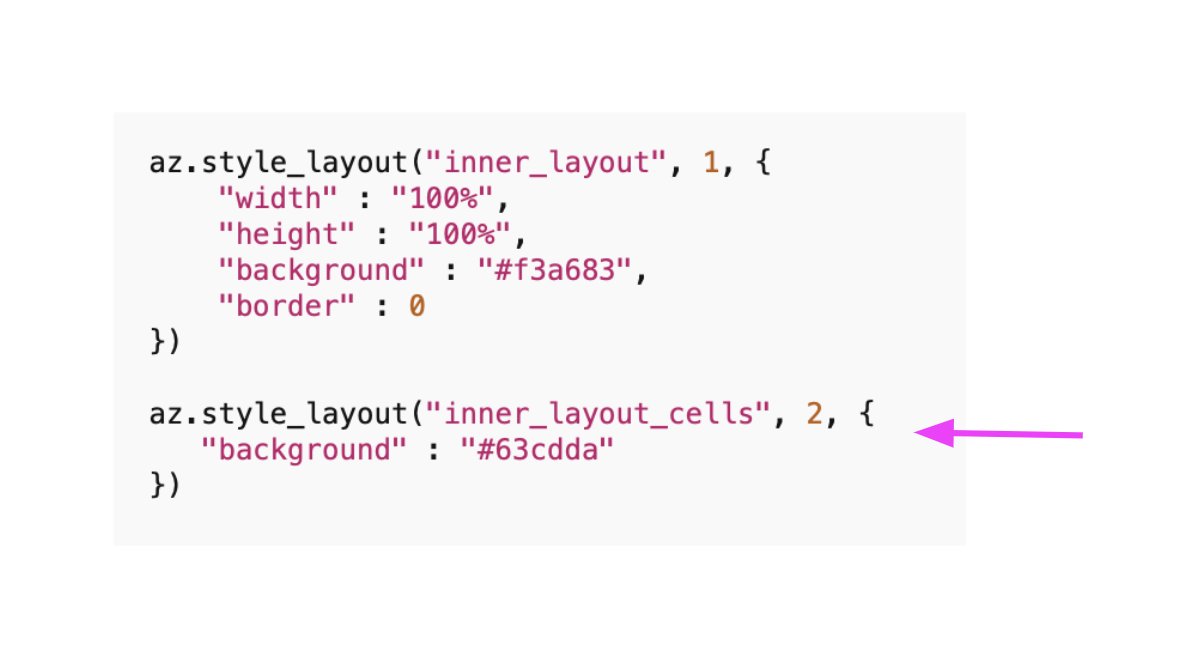
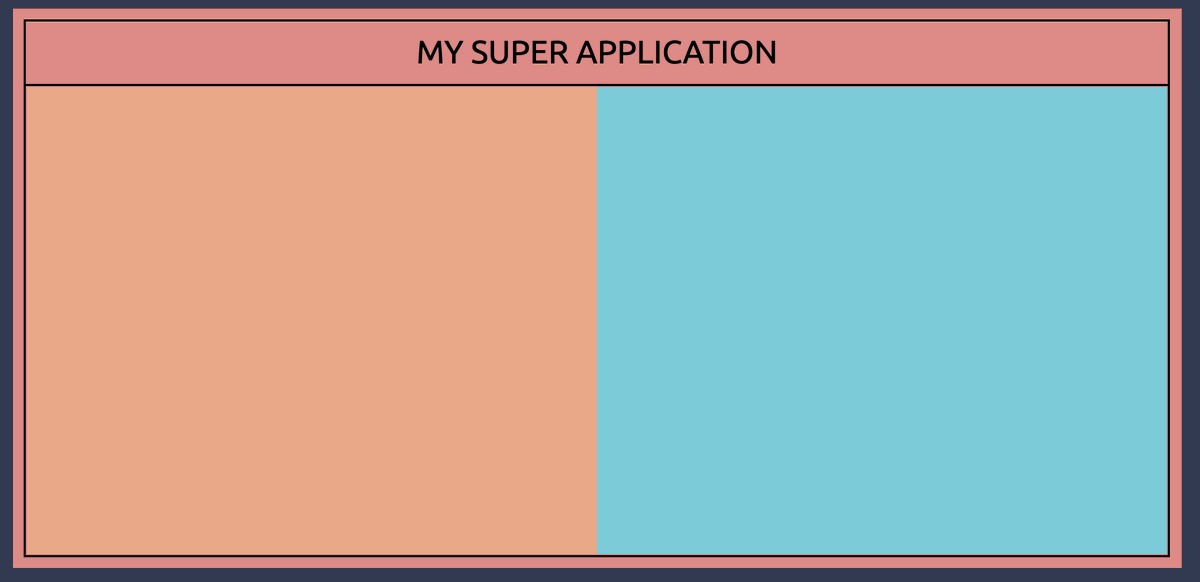
Notice our app no longer requires any bordering. Let's make it minimal and smooth by removing the outer layout's border. I'm also going to add a subtle curve to my_section by using border-radius.

Now we're ready to add our interactive elements.
We didn't start with any mockups of what we wanted to create, which is fine. But now might be a good time to think about what we want this to be.
We didn't start with any mockups of what we wanted to create, which is fine. But now might be a good time to think about what we want this to be.
Most of today's interesting applications are data-driven. What kind of interesting data could we fetch, and what kind of model might we use?
While I write this, covid-19 is on everyone's mind. Let's fetch covid-19 data and use a model to predict cases.
While I write this, covid-19 is on everyone's mind. Let's fetch covid-19 data and use a model to predict cases.
*****Usual Disclaimer*****
Don't be an idiot and use this model to make real-life decisions regarding a pandemic. This is just for demonstration purposes.
Don't be an idiot and use this model to make real-life decisions regarding a pandemic. This is just for demonstration purposes.
We want publicly-available data, ideally delivered as a "RESTful service" ("REST API").
REST APIs deliver data and functionality "over the wire" into our browser, making it easier to create interesting applications without having to write a ton of code.
REST APIs deliver data and functionality "over the wire" into our browser, making it easier to create interesting applications without having to write a ton of code.
If someone offers covid-19 data as a REST API it means we don't have to store/manage the data ourselves; we can just use it 👍
I found one here:
about-corona.net
It's free and requires no authentication. Just what we want for playing around.
I found one here:
about-corona.net
It's free and requires no authentication. Just what we want for playing around.
REST APIs have "endpoints", which are what we point to with our browser to fetch actual data.
After reviewing the documentation I found the endpoint we will use:
corona-api.com/timeline
This gives global counts for deaths, confirmed and recovered cases.
After reviewing the documentation I found the endpoint we will use:
corona-api.com/timeline
This gives global counts for deaths, confirmed and recovered cases.
Anytime you want to see what a REST API's data looks like just open your browser to the URL provided by the service:
corona-api.com/timeline
corona-api.com/timeline
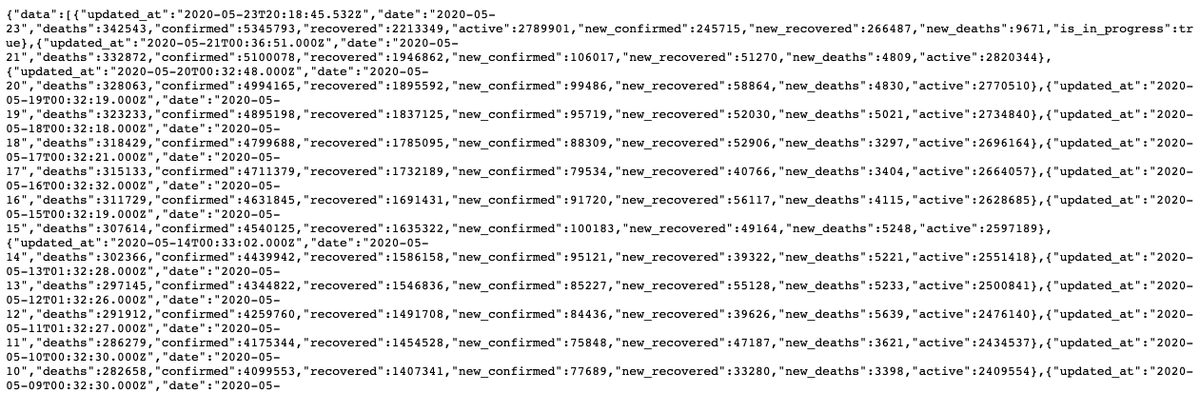
To use the data in our application we don't access it as above, rather we ingest the data using JavaScript, and parse the results into some useful form.
But first, let's get back to our mockup. Now that we've seen the data, we can think about how our app might look and act.
But first, let's get back to our mockup. Now that we've seen the data, we can think about how our app might look and act.
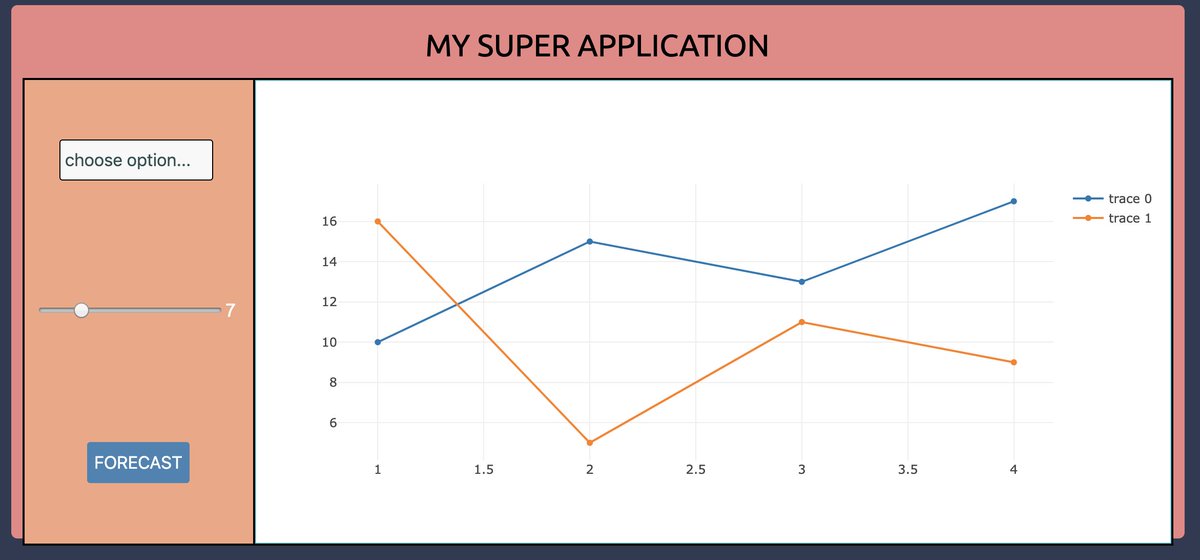
A dirty mockup is all we need to anchor our approach. Here's what I came up with, using Google Slides to create the sketch:
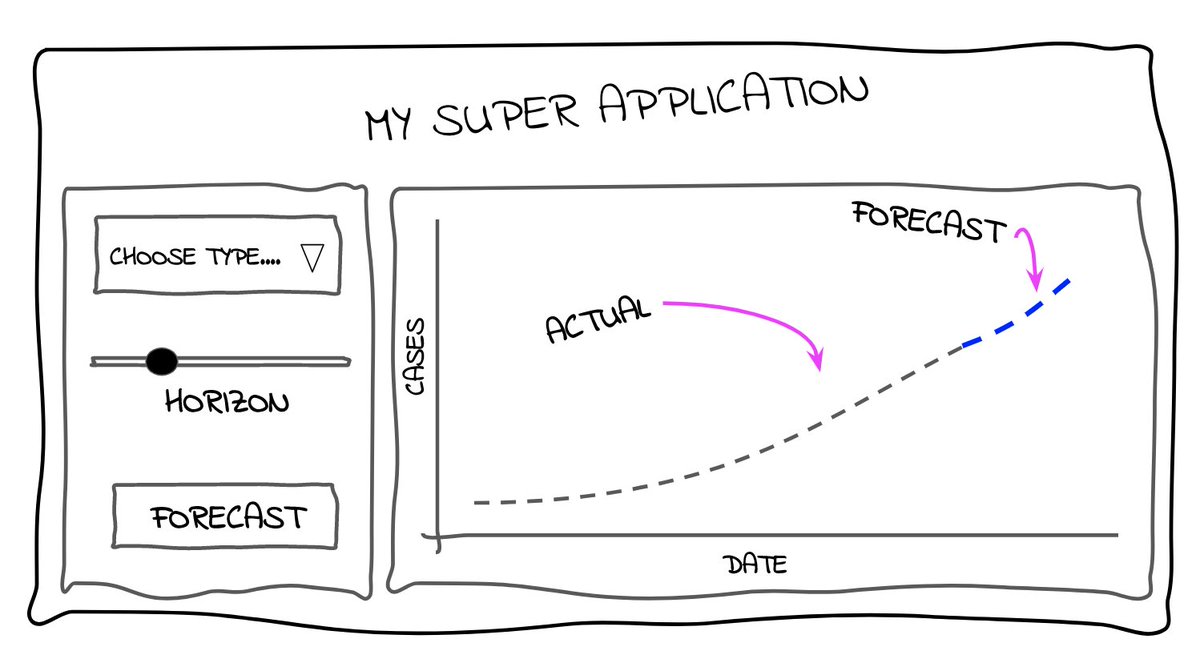
The user chooses a type (deaths, confirmed, recovered), with results visualized on the right in a graph. The user then chooses a "horizon" (future days) and clicks FORECAST to run a model in the back-end, whose results also get visualized when they are returned.
With data and mockup in hand we can start adding our interactive UI elements.
We need a dropdown, a slider, a button, and a line chart.
Let's start with the first 3.
I'll add a new layout inside the first inner layout cell to help position our elements.
We need a dropdown, a slider, a button, and a line chart.
Let's start with the first 3.
I'll add a new layout inside the first inner layout cell to help position our elements.
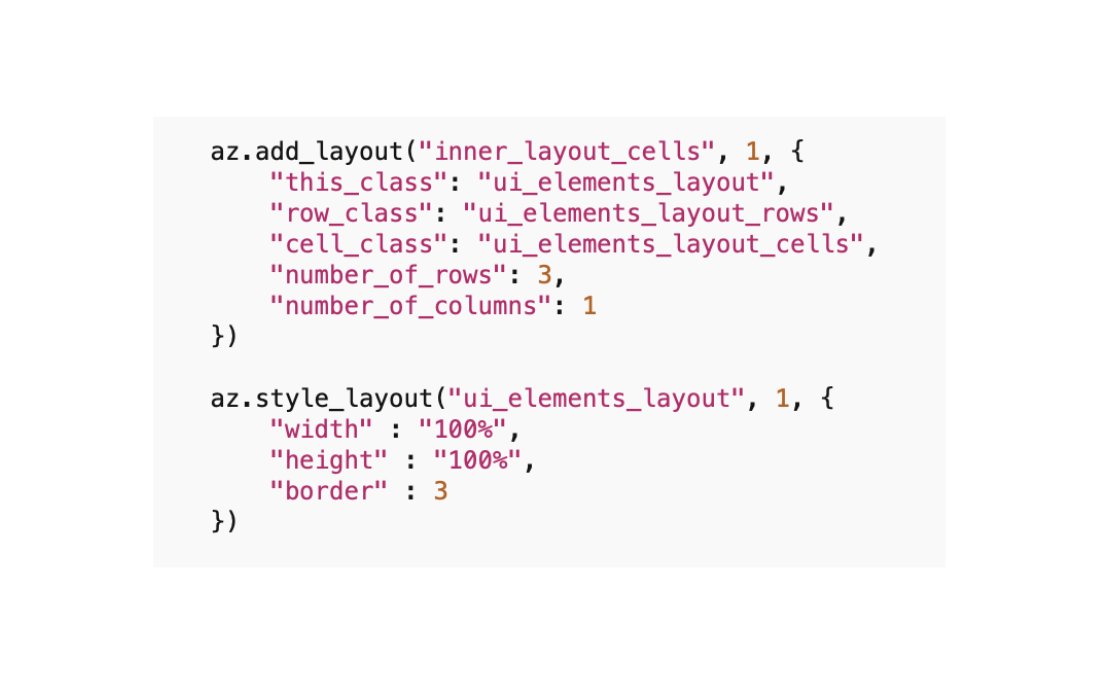
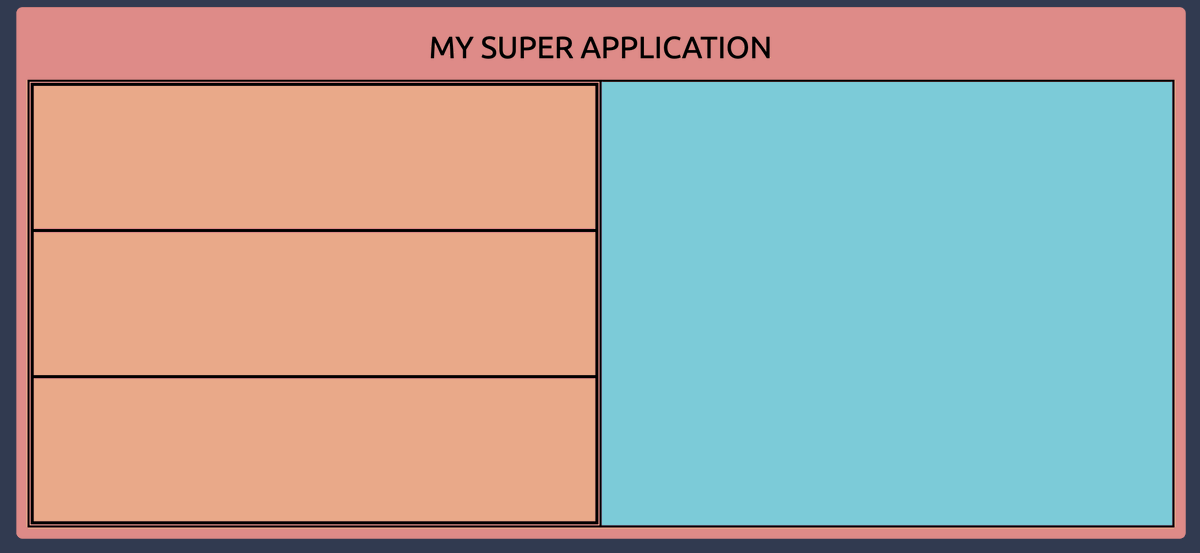
I made the border thick so I can see the new layout's cells more readily.
Now let's add our UI elements inside these new cells. From Azle's documentation we can grab the code we need.
Now let's add our UI elements inside these new cells. From Azle's documentation we can grab the code we need.
Add dropdown, slider and button code to our application:
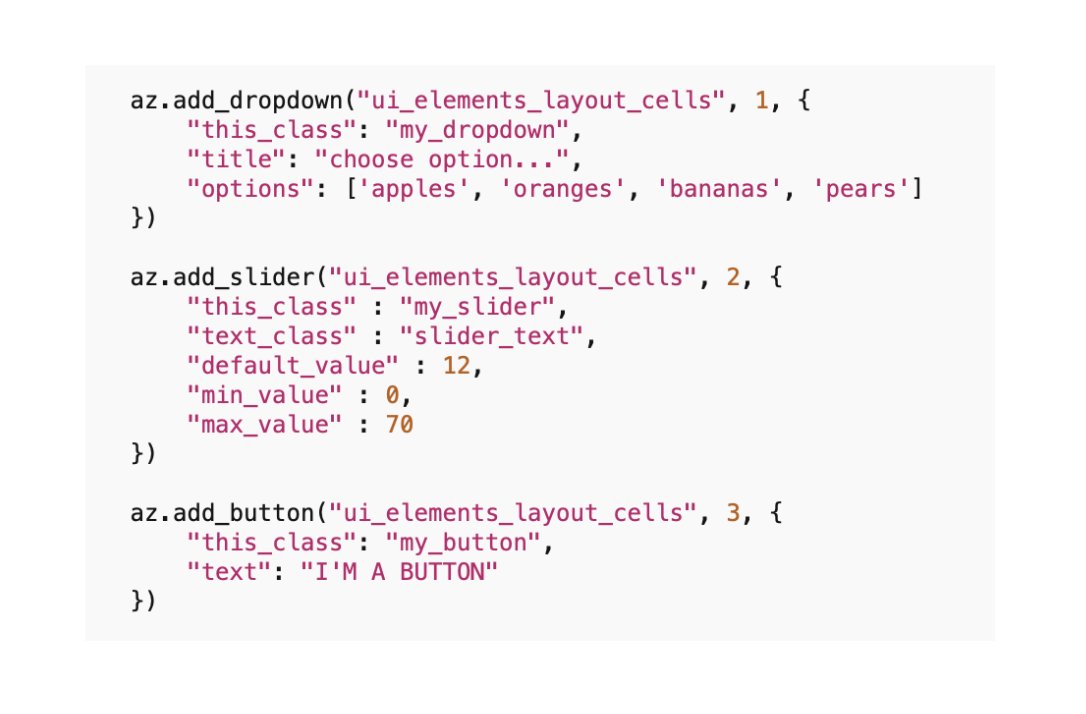
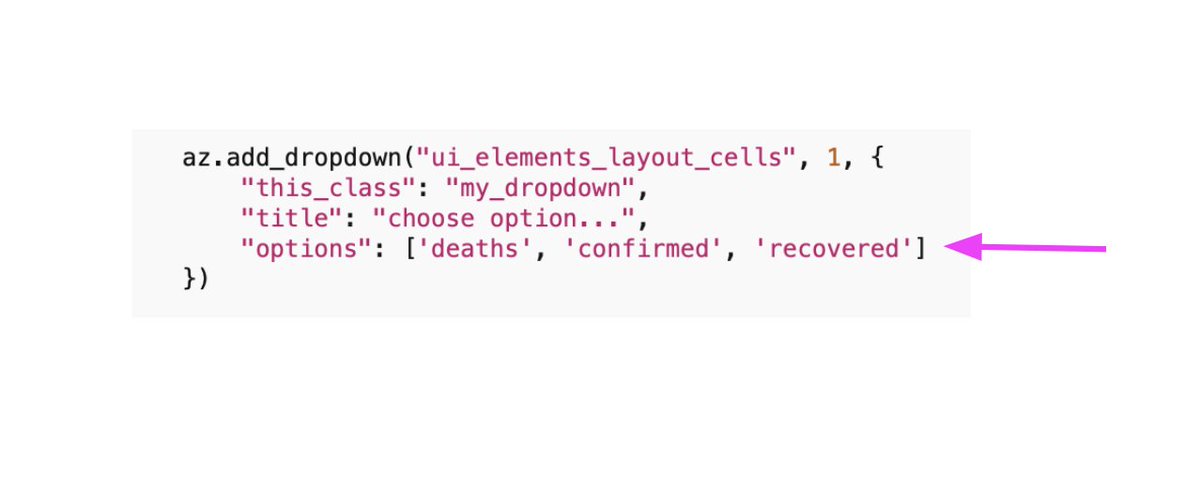
We need to tailor these elements for our app. We know the options we want for our dropdown (deaths, confirmed, recovered).
Add those now:
Add those now:
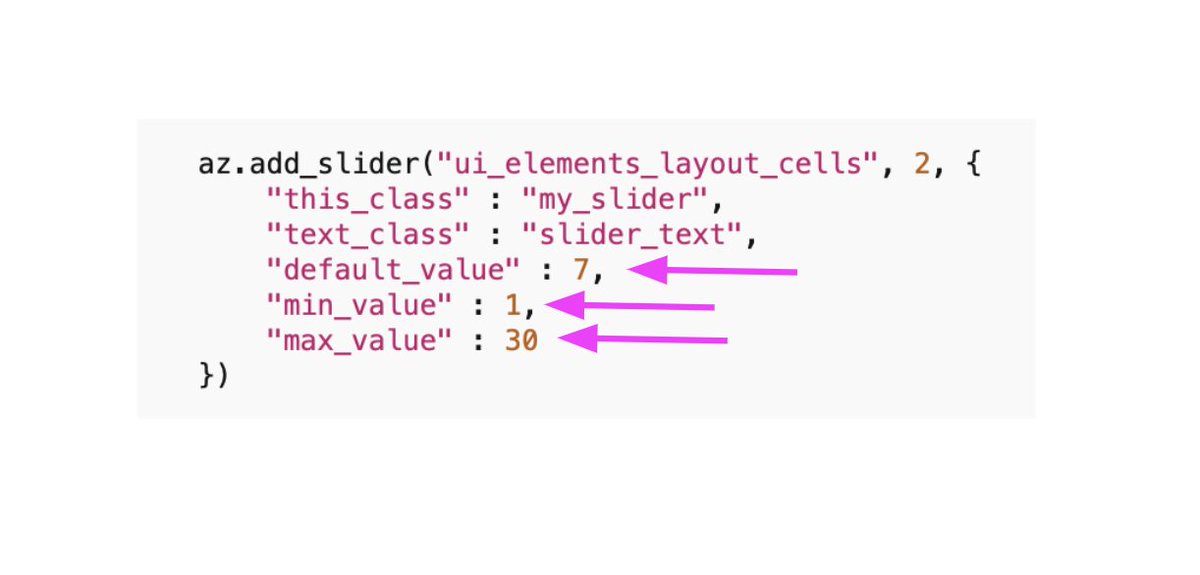
Let's allow up to 30 days for the prediction. Set the default to 1 week out, with min_value of 1 day and max_value 30 days:
And we'll change the button text to FORECAST:
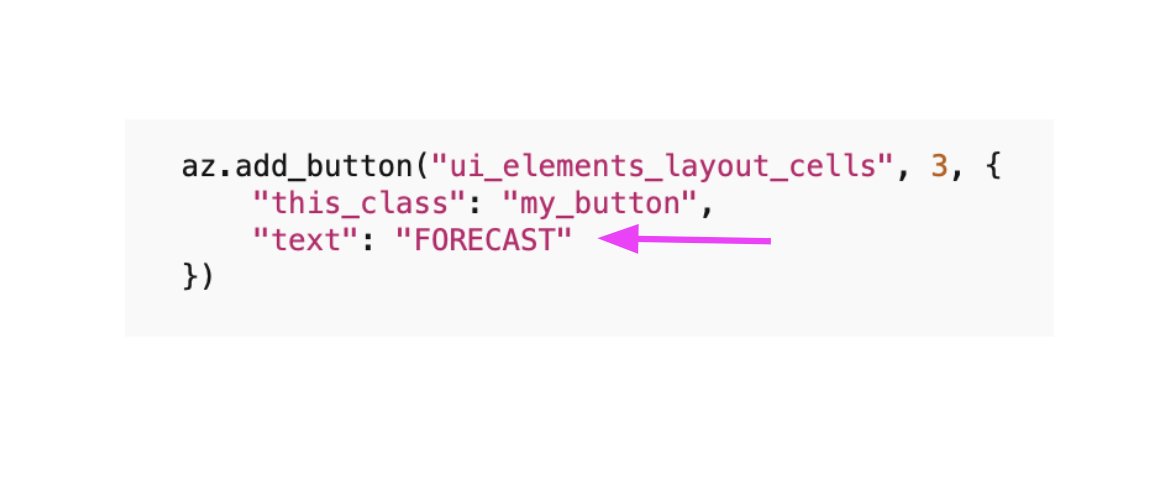
Looks good:
Let's center the elements and remove the border from our recent layout.
Change the 3 to a 0 in our layout styling and add a new function called all_style_layout. This allows us to target all elements with the same class name.
Change the 3 to a 0 in our layout styling and add a new function called all_style_layout. This allows us to target all elements with the same class name.

"halign" with "center" ensures the contents of all 3 cells align horizontally.
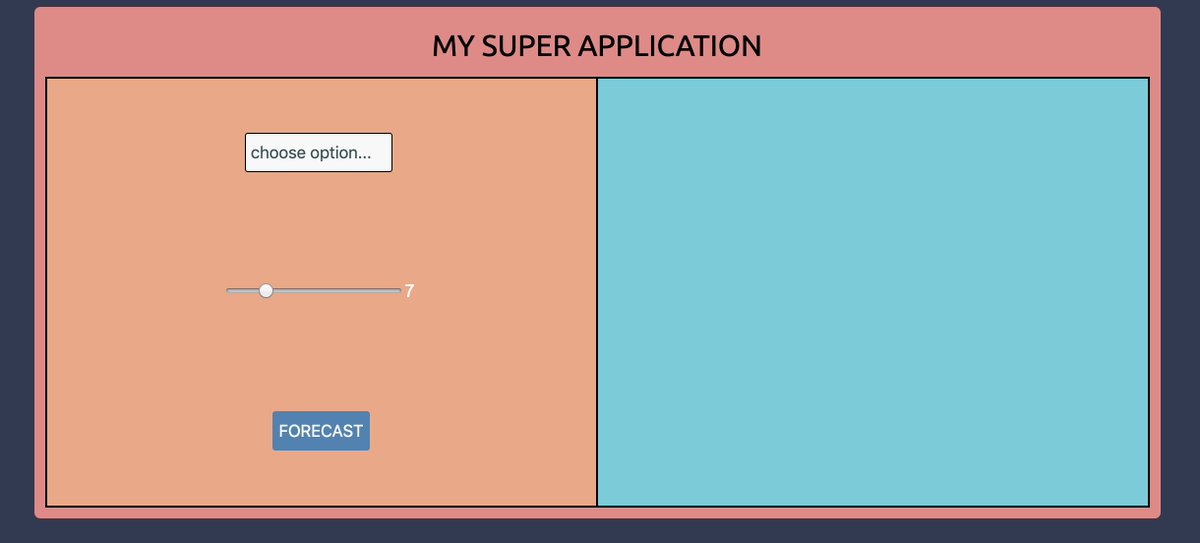
Now let's add our line chart visual. We know from our mockup we need more space in the 2nd inner cell so the visual will fit properly.
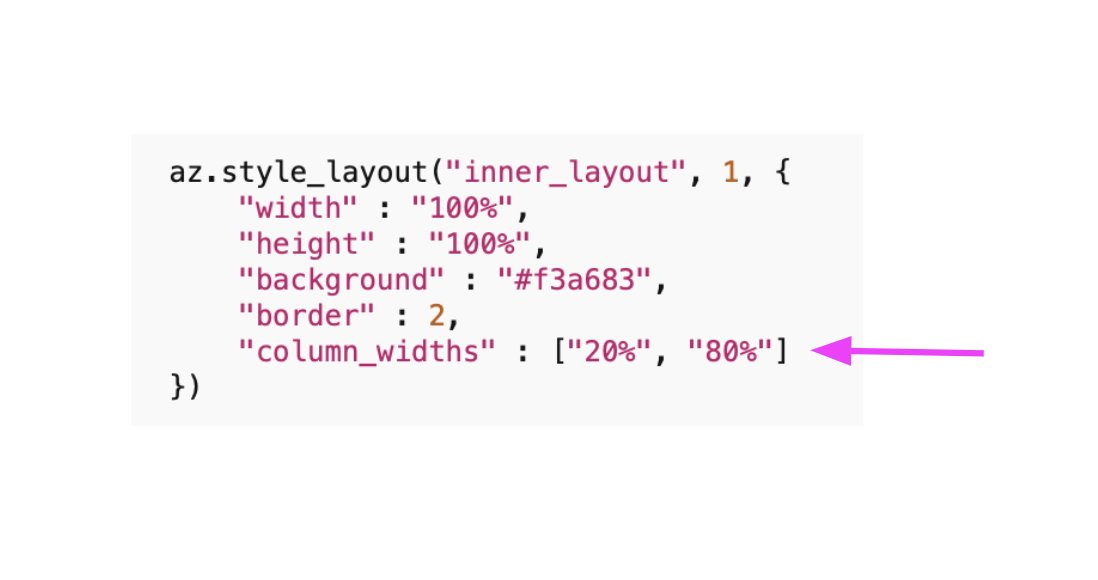
Let's change the "column_widths" of our inner layout:
Let's change the "column_widths" of our inner layout:
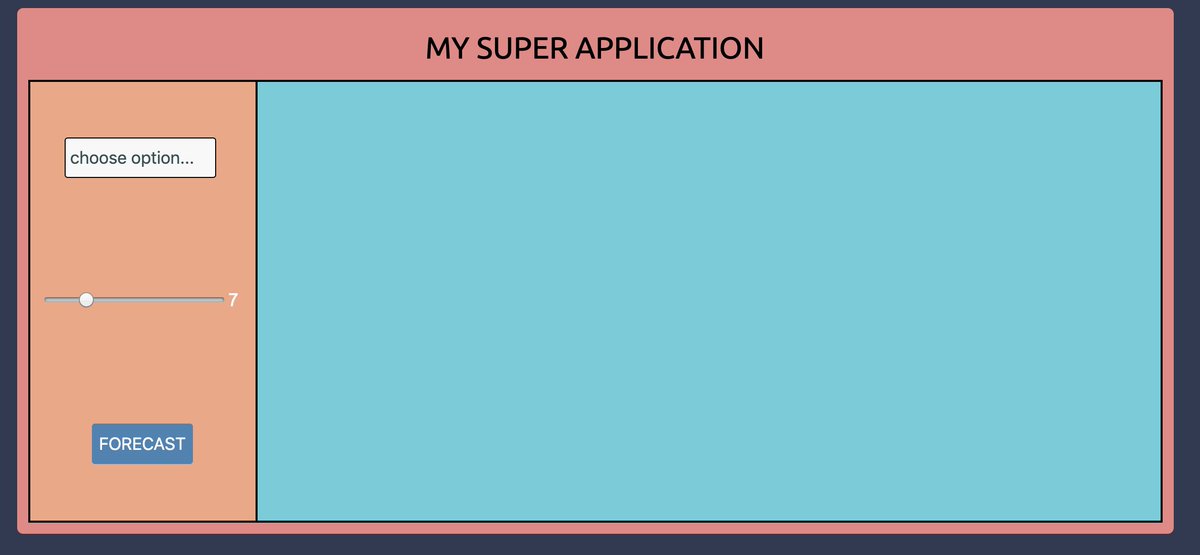
Starting to look like a real application now.
For the line chart we will use another library called Plotly.
plotly.com/javascript/
Plotly is built on top of D3.js, an industry-standard visualization library written in Javascript.
For the line chart we will use another library called Plotly.
plotly.com/javascript/
Plotly is built on top of D3.js, an industry-standard visualization library written in Javascript.
While you can learn D3.js itself, Plotly offers an abstraction layer that makes development (much) more rapid.
Click the line chart option on Plotly's website:
Click the line chart option on Plotly's website:
We will copy the line chart code into our application.
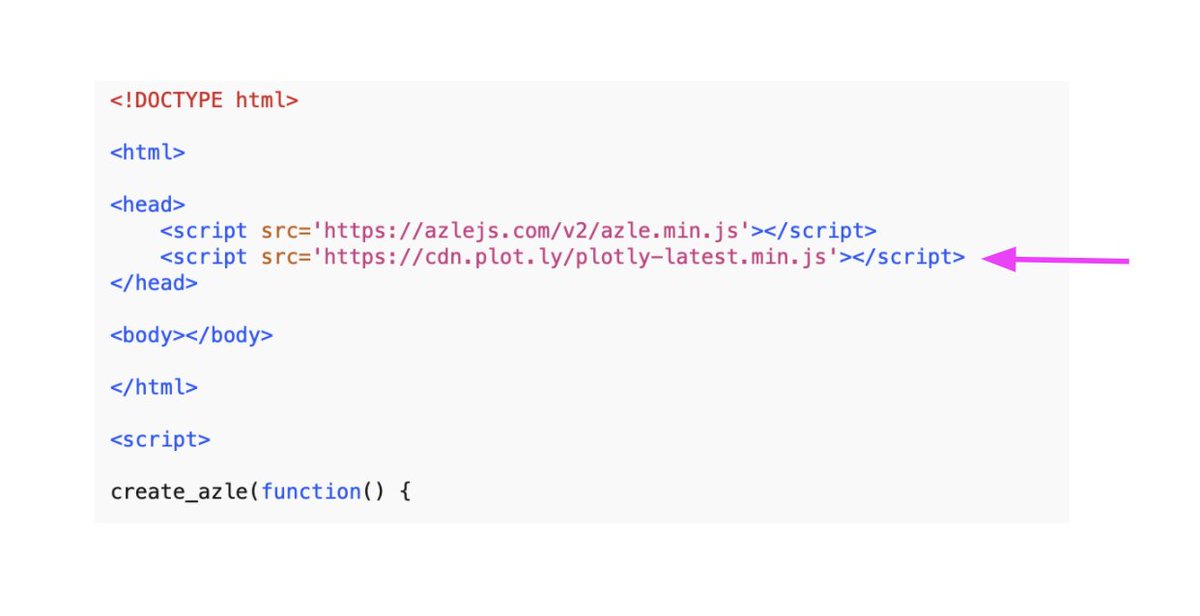
First, we need to make this library available. The simplest way to make a JS library available to an app is via CDN (content delivery network).
We just need to add the appropriate URL to the header of our index.html file:
First, we need to make this library available. The simplest way to make a JS library available to an app is via CDN (content delivery network).
We just need to add the appropriate URL to the header of our index.html file:
Now we can use all of Plotly's visuals in our application.
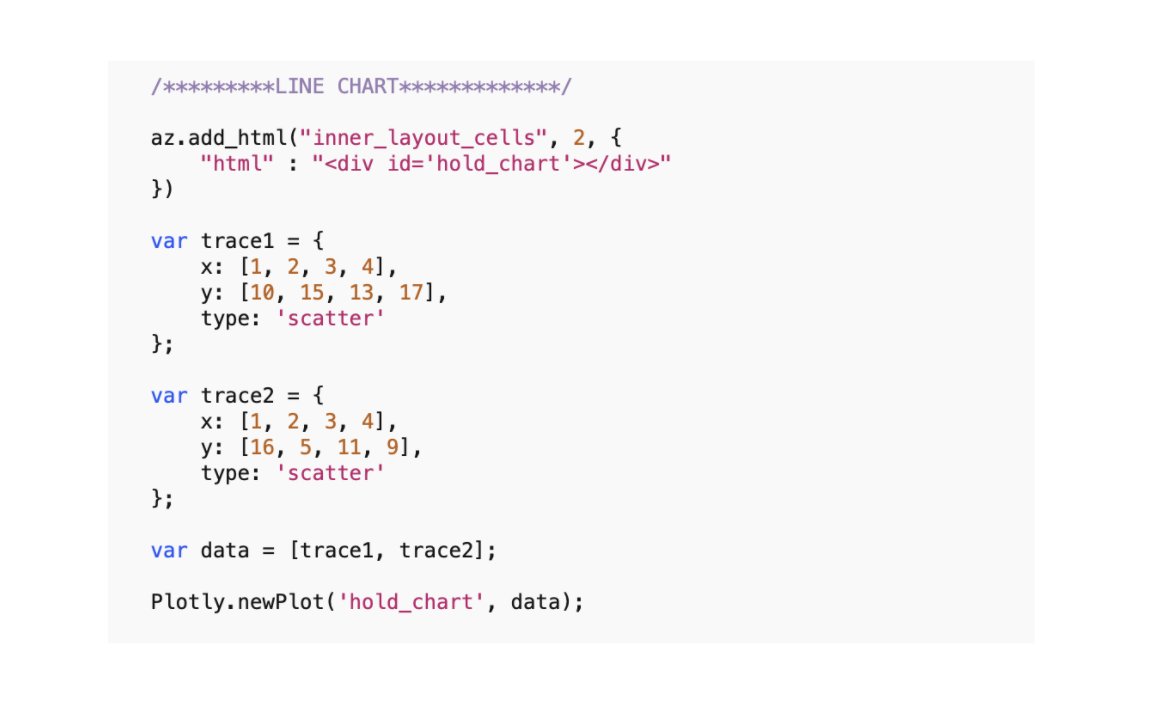
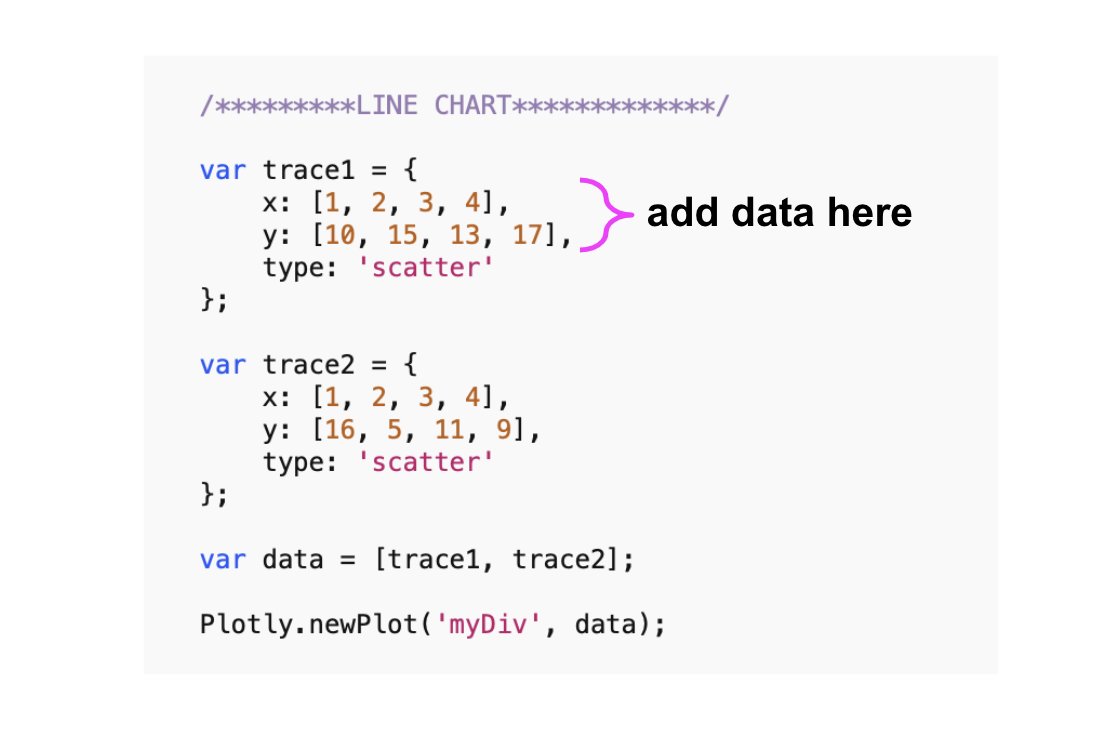
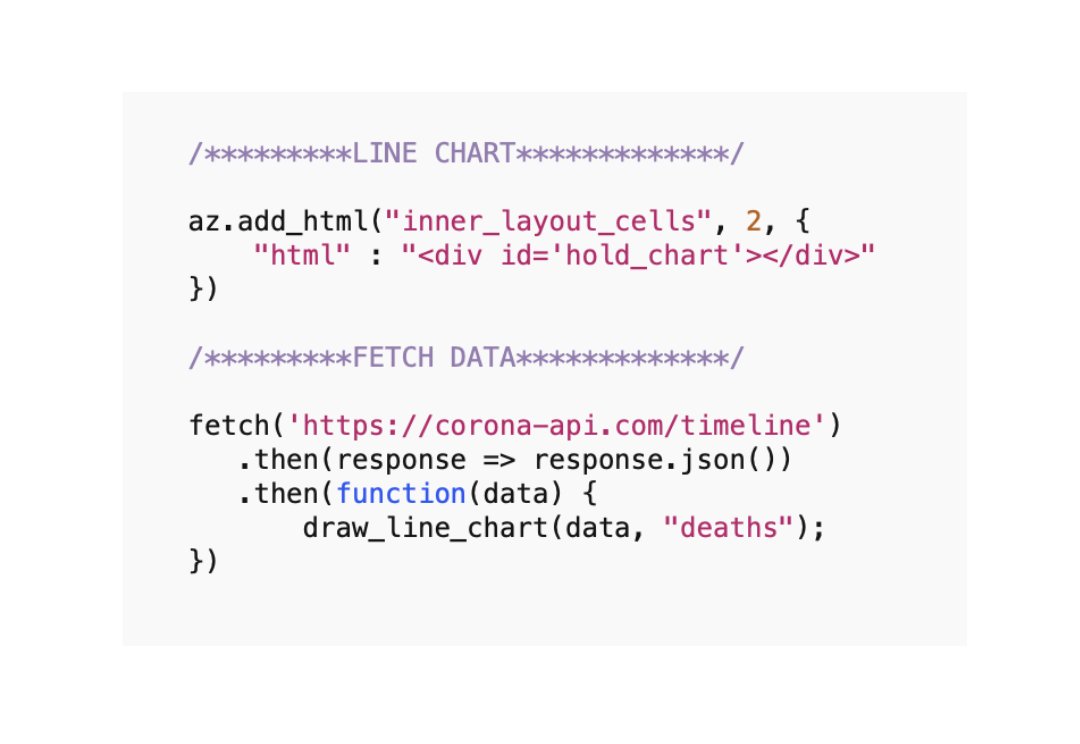
Grab the line chart code and paste it into our app:
Grab the line chart code and paste it into our app:
Notice how the last line targets "myDiv". This is an HTML element Plotly needs to attach the line chart to.
Let's create that HTML element now. We use Azle's add_html function and create ourselves a "div" element. I will give the div an id called 'hold_chart' :
Let's create that HTML element now. We use Azle's add_html function and create ourselves a "div" element. I will give the div an id called 'hold_chart' :
Notice I also changed 'myDiv' in the last line to 'hold_chart' so it targets correctly.
Refresh your browser:
Refresh your browser:
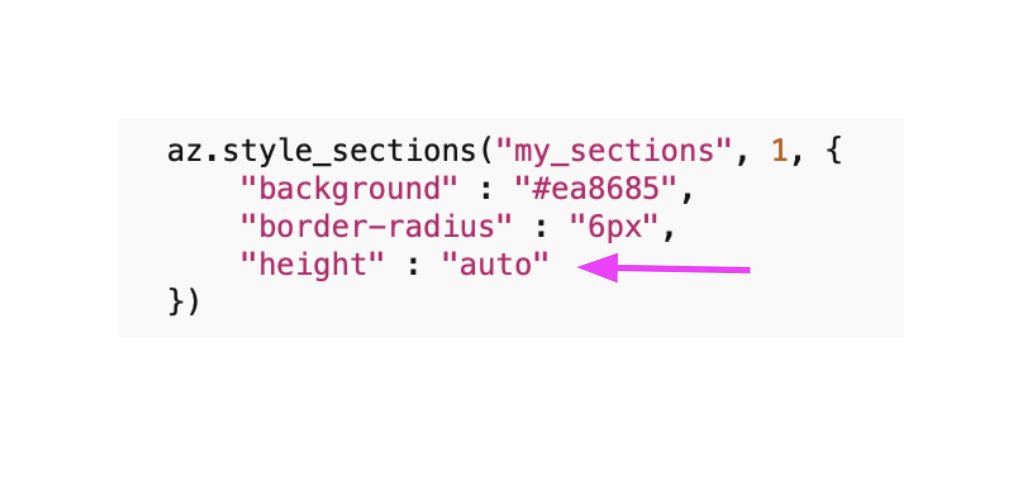
Looks great. If you look closely at the bottom you'll notice our section doesn't quite wrap the inner contents. Those with OCD will flip if they see that.
Near the top of our app's code, go to the style_sections function and add "height" : "auto"
Near the top of our app's code, go to the style_sections function and add "height" : "auto"
Plotly provides a lot of slick stuff out of the box. We get tooltips, zooming, panning, and a host of customizable options. Doing this all yourself in raw D3 isn't fun.
Now it's time to hook up events to our UI elements, and connect our fetched covid-19 data to our visuals.
I mentioned earlier that we will ingest the REST data using JavaScript, and parse the results into some useful form. Let's do that now.
An important fact about building apps that rely on fetched data is the data must be available prior to using it.
An important fact about building apps that rely on fetched data is the data must be available prior to using it.
While this sounds obvious it's easy to miss when one is just beginning to learn software development.
As an example, when our users first load our app we want to show the line chart. But that line chart depends on data being available.
As an example, when our users first load our app we want to show the line chart. But that line chart depends on data being available.
To make sure data are available to any pieces of our app that require it we use so-called "asynchronous code."
Asynchronous code WAITS until something has happened (e.g. data has been fetched) before calling a function of our choice.
Asynchronous code WAITS until something has happened (e.g. data has been fetched) before calling a function of our choice.
In our case, we want to fetch covid-19 data, WAIT until it's available in our app, THEN draw our line chart.
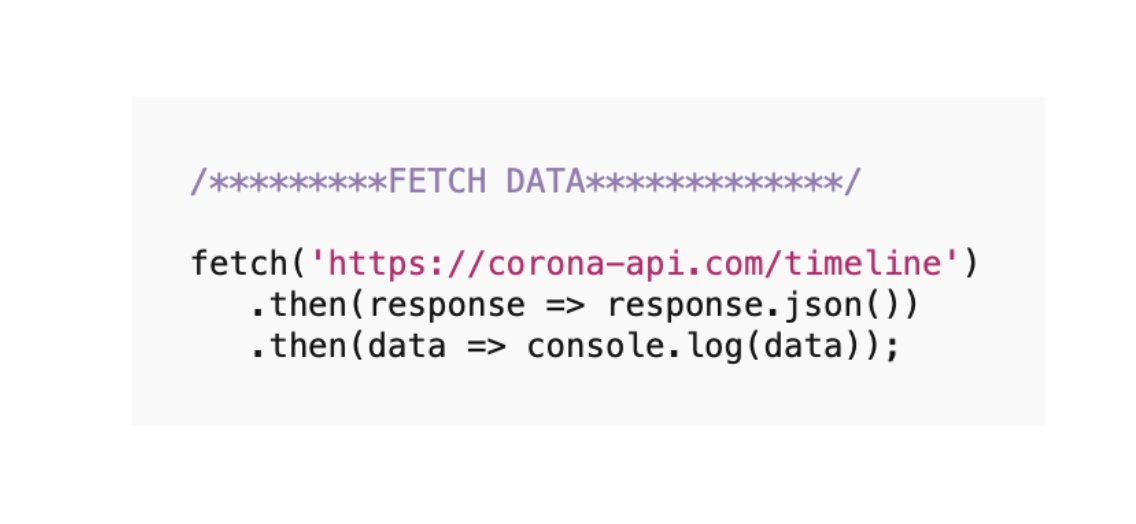
JavaScript makes all this possible via its "fetch" API. With fetch, we simply point to the URL provided by the REST service and tell it what to do once data is received.
JavaScript makes all this possible via its "fetch" API. With fetch, we simply point to the URL provided by the REST service and tell it what to do once data is received.
Let's use fetch to bring our covid-19 data into our application.
How do we use it? I found this:
mzl.la/2ysL4pm
...which shows us how:
How do we use it? I found this:
mzl.la/2ysL4pm
...which shows us how:
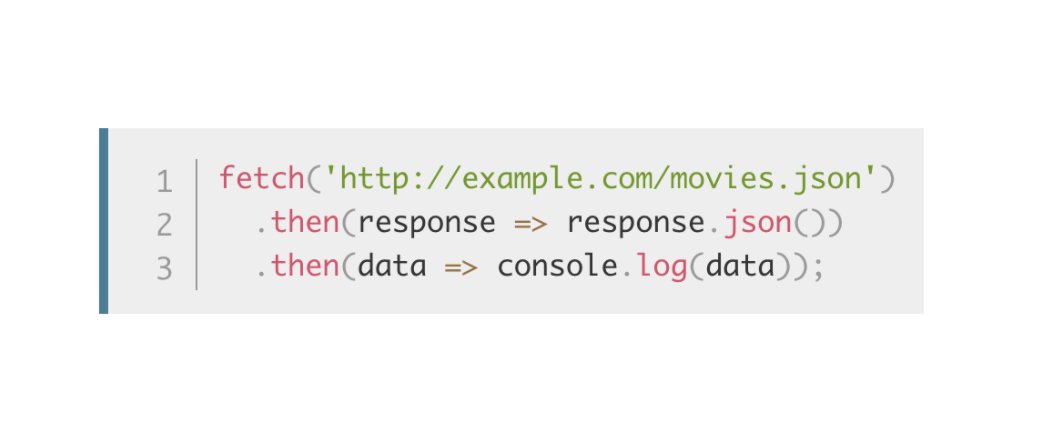
Let's paste it into our code, using the covid-19 URL we found above (right after our Plotly code):
Refresh the application. The app itself doesn't look any different. But if we open the "browser console" we can see the covid-19 data we fetched.
Open the browser console by right-clicking anywhere on the screen and clicking "inspect".
Then click console.
Open the browser console by right-clicking anywhere on the screen and clicking "inspect".
Then click console.
You will see an "Object" sitting in the console. This is the covid-19 data we fetched (notice the fetch API we pasted above says console.log(data)).
Click repeatedly into this object to view its structure:
Click repeatedly into this object to view its structure:
This looks a lot better than what appeared in the browser when we first pointed to the covid-19 URL.
Now we can parse this data object, using its contents to populate our line chart.
To do this we'll need to make a slight change to how our line chart is being drawn.
Now we can parse this data object, using its contents to populate our line chart.
To do this we'll need to make a slight change to how our line chart is being drawn.
Inspecting the line chart code we added earlier we can see it uses "traces" to convert raw data into lines.
We need to get the data from our fetch results into these x and y properties of the trace object:
We need to get the data from our fetch results into these x and y properties of the trace object:
Let's write some JavaScript to parse the results of our fetch.
We need to:
1. understand the source structure;
2. understand the destination structure.
We can understand the source structure by inspecting the data in the browser console as we did previously.
We need to:
1. understand the source structure;
2. understand the destination structure.
We can understand the source structure by inspecting the data in the browser console as we did previously.
The destination structure is the trace object required by Plotly.
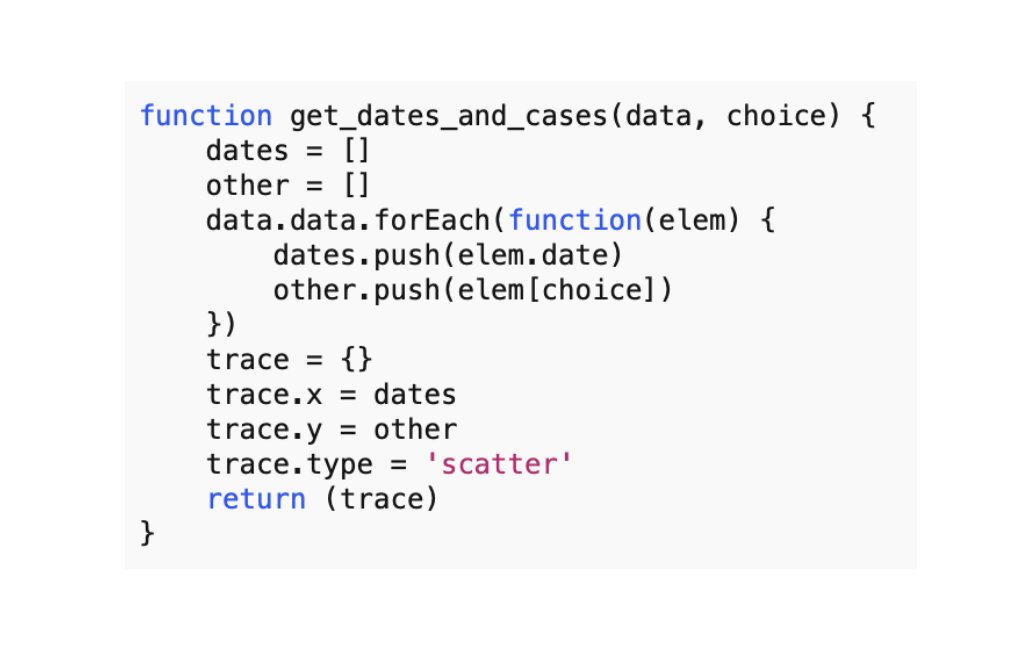
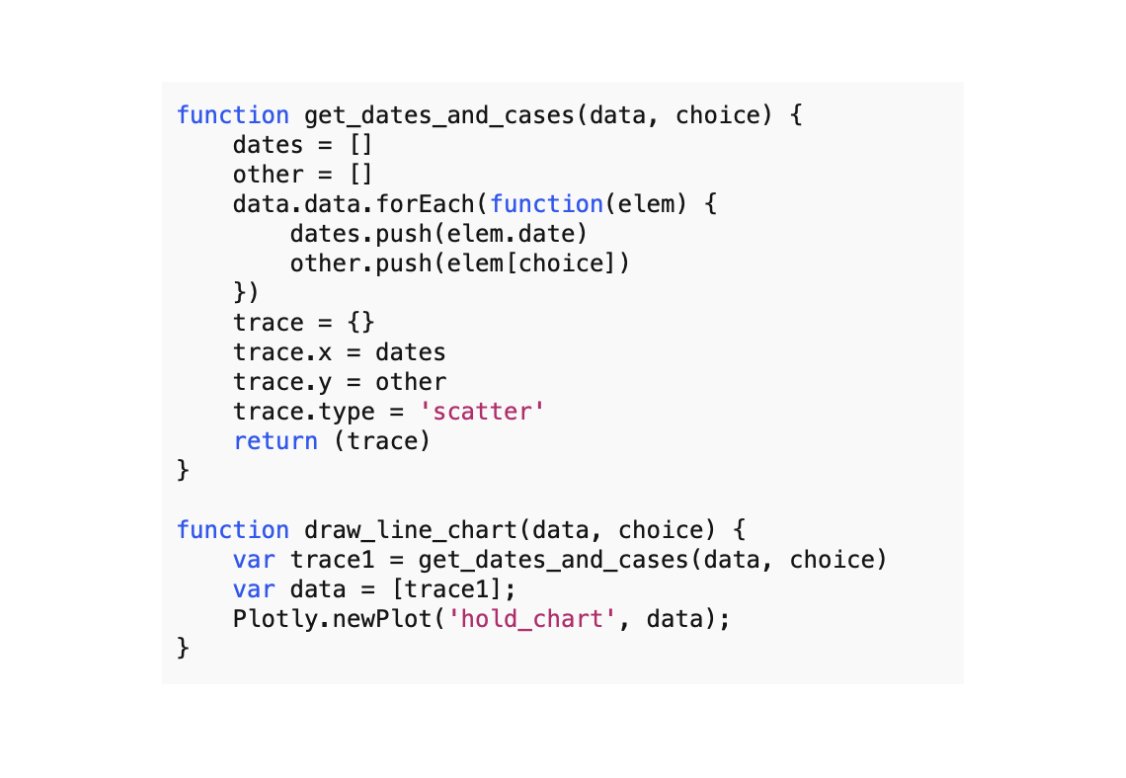
I wrote the following function to take the raw data retrieved from fetch and convert it into the trace structure needed for Plotly:
I wrote the following function to take the raw data retrieved from fetch and convert it into the trace structure needed for Plotly:
Functions are how we group code in software. They have a name, accept arguments, and return some result. Functions help keep code modular and maintainable.
I won't go into detail about how I arrived at this function; you can explore it yourself.
I won't go into detail about how I arrived at this function; you can explore it yourself.
What's important here is to understand this is not THE way to parse data. It's A way. You must experiment with JavaScript and toy around until you find something that works.
Search online for how to parse JavaScript objects, loop through them, and return new structures.
Search online for how to parse JavaScript objects, loop through them, and return new structures.
My get_dates_and_cases function accepts the fetched data, a choice (e.g. deaths), loops through its contents, extracts the pieces I need for plotting, and returns the object for Plotly.
I will write another function to draw the line chart with our prepared data.
I will write another function to draw the line chart with our prepared data.
We can remove the original Plotly code we added and use this function instead. It uses our first function to prepare the trace data, then plots the line chart as usual.
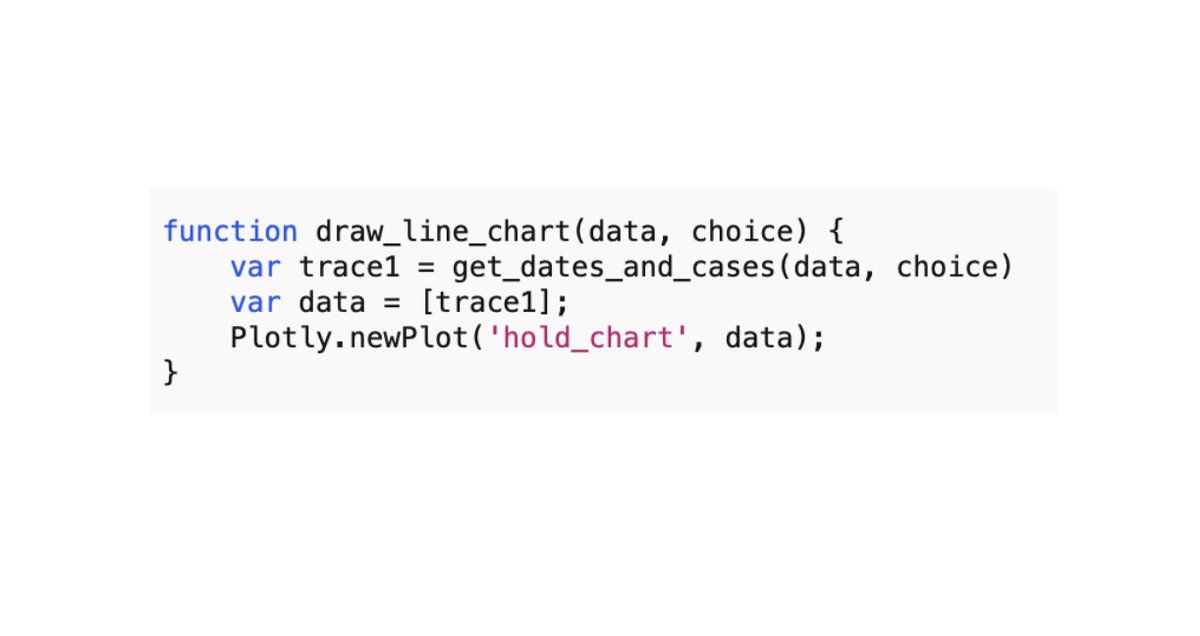
Be sure to keep the "hold_chart" div we added so the plot has somewhere to live.
Our line chart and fetch code now look like this:
Our line chart and fetch code now look like this:
...and our 2 special functions like this:
Note: place the above 2 functions *outside* the create_azle closing parentheses.
Refresh your browser and look at the application:
Refresh your browser and look at the application:
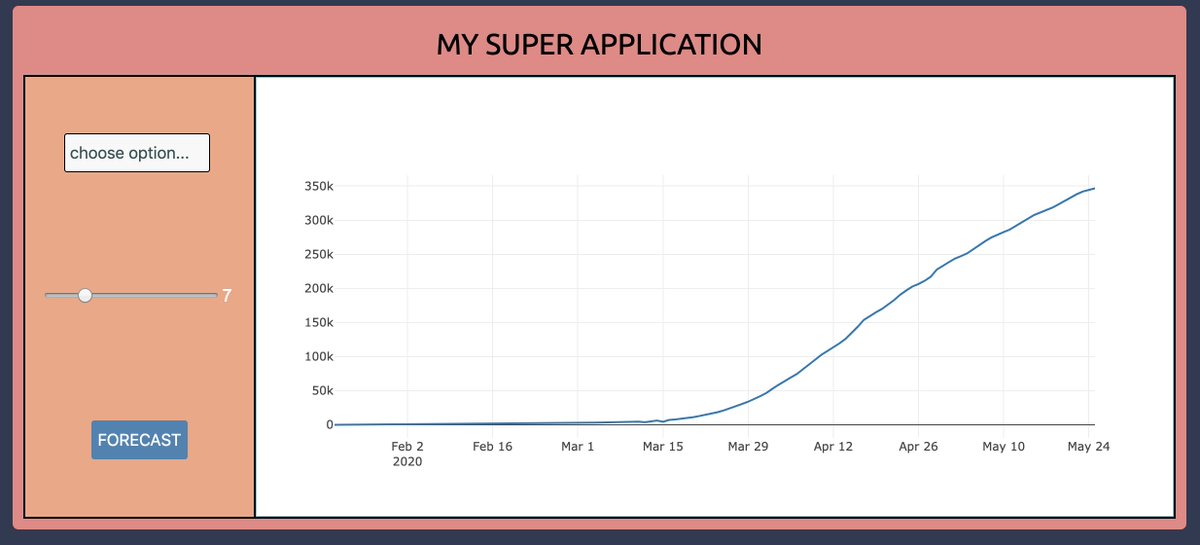
Our covid data is now showing in the line chart. Importantly, the line chart will only be drawn when the data have been fully fetched from the REST API.
To recap, we used asynchronous code in JavaScript to fetch data from an API, THEN created a visual once the data were ready.
To recap, we used asynchronous code in JavaScript to fetch data from an API, THEN created a visual once the data were ready.
We also wrote 2 function to prepare the raw data and plot the results.
We are getting close:
We are getting close:
...although we haven't stored any data yet. Our next step is to allow the user to select a choice (deaths, confirmed, recovered) to redraw the line chart accordingly.
Let's store the returned data so we can use it as needed, without having to refetch the data each time.
Let's store the returned data so we can use it as needed, without having to refetch the data each time.
I will keep the returned data in a JavaScript object. I will just use Azle's namespace like this:

Add the line as above, then refresh your browser and open the browser console as before.
Type az.hold_value.fetched_data into the console and hit enter.
We can access our covid-19 data anytime by simply working with this object.
Type az.hold_value.fetched_data into the console and hit enter.
We can access our covid-19 data anytime by simply working with this object.
This means our interactive elements can immediately work with the data and redraw our line chart, without delay.
To get our UI elements to do something we need to add "event listeners." These fire when a user interacts with our elements.
Let's hook up our events now.
To get our UI elements to do something we need to add "event listeners." These fire when a user interacts with our elements.
Let's hook up our events now.
Azle has all kinds of events. We only need "click", "change", and "as_change."
First, we want to redraw the line chart when the user makes a choice from the dropdown. Let's use Azle's "change" event to make this happen.
First, we want to redraw the line chart when the user makes a choice from the dropdown. Let's use Azle's "change" event to make this happen.
To add an event to our element we use Azle's add_event function, targeting the element of choice, just as we did with styling:

Anything inside the "function" property gets called when the user interacts with the element. I added an alert to test it out:
Now we just need to redraw the line chart instead of calling alert.
Our draw_line_chart function we wrote earlier is ready to go. It already takes the data and choice as arguments and redraws the plot accordingly.
So all we need to do is call draw_line_chart like this:
Our draw_line_chart function we wrote earlier is ready to go. It already takes the data and choice as arguments and redraws the plot accordingly.
So all we need to do is call draw_line_chart like this:

Notice we are using the data stored inside az.hold_value.fetched_data. We are also using a new Azle function called "grab_value"; this allows us to grab whatever value the user chose on an element.
Let's see if it works:
Let's see if it works:
Beautiful.
Adding events to our other elements works the same way. But those elements relate to calling some back-end model to make predictions using our covid-19 data.
So before adding the other events let's start working on the back-end model.
Adding events to our other elements works the same way. But those elements relate to calling some back-end model to make predictions using our covid-19 data.
So before adding the other events let's start working on the back-end model.
For the "back-end" we need a server that supports the heavy lifting required to compute our predictions.
We could use a cloud provider such as Digital Ocean or Amazon, but since we're just prototyping ideas we'll use our own local computer.
We could use a cloud provider such as Digital Ocean or Amazon, but since we're just prototyping ideas we'll use our own local computer.
Getting a front-end communicating with a back-end requires a web service. A web service will allow us to send requests to the server and receive something in return.
This is what we need, since we want to give a back-end model data from our front-end and return a prediction.
This is what we need, since we want to give a back-end model data from our front-end and return a prediction.
We will use a lightweight web framework called Flask to build our web service in Python. Let's do that now.
At the beginning we created a my_app folder, currently holding our index.html file. Let's add another file to this folder called predict.py :
At the beginning we created a my_app folder, currently holding our index.html file. Let's add another file to this folder called predict.py :
Now we will add some basic Flask code to our currently blank predict.py file. Flask's documentation has a Quickstart guide where they show us the minimal code needed to set things up: bit.ly/3c9pfct
We will need a few more pieces, like extra libraries, to get our web service suitable for our purpose. Here is what our predict.py file will look like:
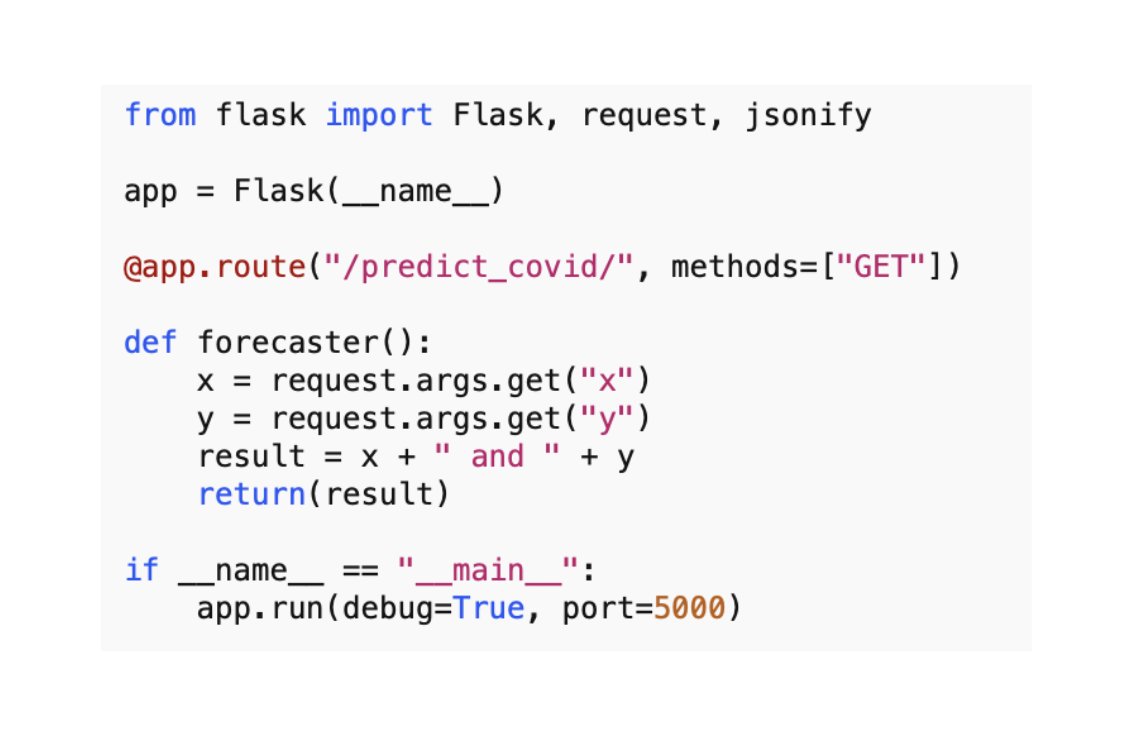
Whereas in JavaScript we used "CDNs" to add extra libraries to our application, in Python we use import statements.
Above we are importing Flask, as well as the "request" and "jsonify" libraries, which will enable us to receive and send data from-and-to our front-end.
Above we are importing Flask, as well as the "request" and "jsonify" libraries, which will enable us to receive and send data from-and-to our front-end.
We also set a "route" which is an "endpoint" for our service. Recall our discussion on endpoints when we looked at fetching covid-19 data from a REST API. If you're thinking we are making our own REST API right now then you are correct :)
Much of today's back-end machinery in enterprise software is made available as services, consumed as REST APIs. This makes it easier to patch together various functionality and maintain and scale the application.
Beneath the "route" in our predict.py file we create a function. Python functions look different than Javascript functions, but the idea is the same; a modular piece of code that can accept arguments and return a value.
I called our function forecaster.
I called our function forecaster.
Finally, we specify the "port" at the end of the file. A port is a programmatic docking point that grants access from the outside world to our local system.
I chose port 5000. You can choose a different number if you want (if it's already being used your computer will tell you)
I chose port 5000. You can choose a different number if you want (if it's already being used your computer will tell you)
Let's fire up our web service to see if it works. If it all goes well we'll add our prediction model and start serving real forecasts for our application to consume and visualize.
So far we've just been using a browser and notepad to create our application. But now we need to speak directly with our operating system, and for that we must use terminal (command prompt on PC).
I am using a Mac, so everything you see here will be in macOS. But the same general steps apply to PC.
Open terminal. Quickest way in Mac is to use Spotlight Search by typing "command + spacebar" and typing in "terminal":
Open terminal. Quickest way in Mac is to use Spotlight Search by typing "command + spacebar" and typing in "terminal":
With terminal open, change into our my_app directory by running the following:
cd Desktop/my_app/
...and hit enter.
Now type:
ls
... and hit enter again.
cd Desktop/my_app/
...and hit enter.
Now type:
ls
... and hit enter again.
You should see both the index.html and predict.py files.
Hard to believe our entire application is only 2 files. Thanks to the level of abstraction available in today's tools we only require minimal code to create a full blown app. 🙂
Hard to believe our entire application is only 2 files. Thanks to the level of abstraction available in today's tools we only require minimal code to create a full blown app. 🙂
You are now running a web service, exposing your Python code to any application capable of communicating with it.
This is pretty cool, considering so many high-powered libraries are available today in Python. Just think what you could create! 🙃
This is pretty cool, considering so many high-powered libraries are available today in Python. Just think what you could create! 🙃
Our back-end is being served on "localhost", port 5000, with an endpoint called "predict_covid", accepting parameters called "x" and "y".
To pass all this information "over the wire" we can construct the following URL:
http://localhost:5000/predict_covid/?x=100&y=400
To pass all this information "over the wire" we can construct the following URL:
http://localhost:5000/predict_covid/?x=100&y=400
This is the standard way to communicate with a REST API when using URLs in the browser. The ? mark precedes the first parameter name, and the & precedes the second.
Open a new tab in your browser, add the above URL to the top, and hit enter.
You should see the following:
Open a new tab in your browser, add the above URL to the top, and hit enter.
You should see the following:

Our web service simply returns the values we passed for "x" and "y". Not too exciting, but it does prove our web service works.
Let's hook it all up, end-to-end, so that our front-end application written in JavaScript (Azle) is passing data to, and receiving data from, our web service (rather than the browser).
If we succeed, the only thing left to do will be building a good forecasting model in Python.
If we succeed, the only thing left to do will be building a good forecasting model in Python.
We need to pass the following data to our back-end:
- dropdown choice
- slider value
- dates and # of cases
- dropdown choice
- slider value
- dates and # of cases
Note: We could fetch the covid data in the back-end rather than passing it over-the-wire, but then we would be fetching data twice.
Since we are only forecasting a few dates and values it makes more sense to use the data already fetched from the front-end.
Since we are only forecasting a few dates and values it makes more sense to use the data already fetched from the front-end.
We already know how to "grab" the values from UI elements, using Azle's grab_value function. We also have our fetched data structured nicely in our az.hold_value.fetched_data object.
To send this to our web service we could use JavaScript's fetch API again. Instead, let's use Azle's call_api function, inside our button's event listener:
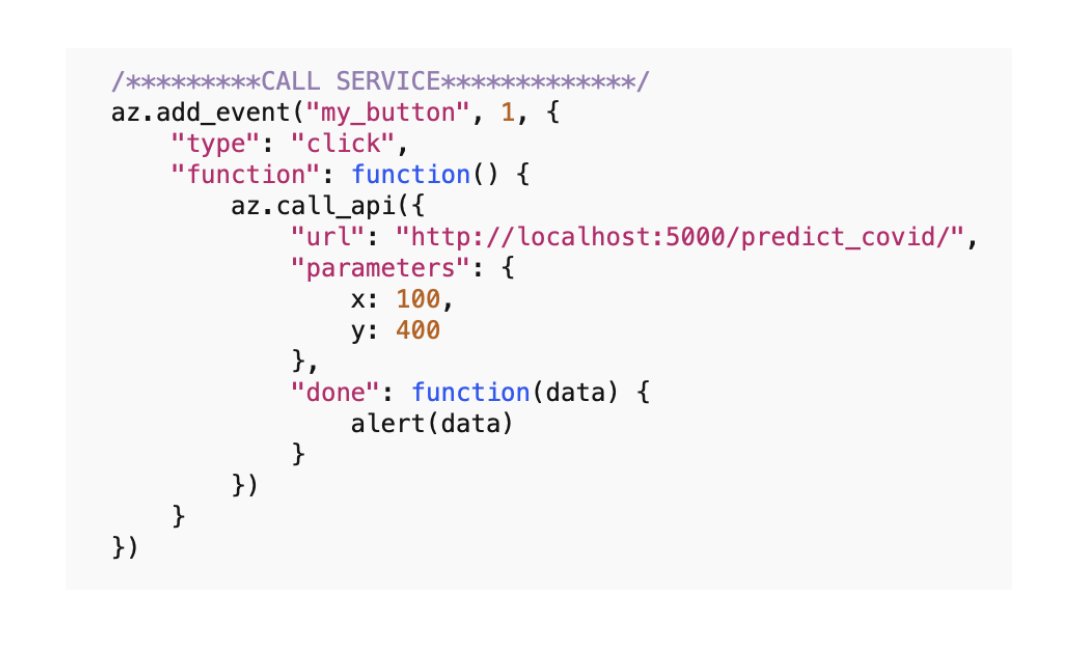

We added an event listener to our button, just like we did to our dropdown earlier.
We also added Azle's call_api inside the event's function property, specifying the URL to our Flask service, the "x" and "y" parameters, and an alert when data are returned.
We also added Azle's call_api inside the event's function property, specifying the URL to our Flask service, the "x" and "y" parameters, and an alert when data are returned.
Refresh your browser and click on the FORECAST button:
Our application is officially interacting with our back-end service, passing data to, and receiving a response from, our Python code.
Let's replace the "x" and "y" parameters with the actual data we need to send, and also add the forecast horizon from the slider value.
Let's replace the "x" and "y" parameters with the actual data we need to send, and also add the forecast horizon from the slider value.
Here I am grabbing the slider value, and the "x" and "y" data from our existing get_dates_and_cases function.

We now have our events hooked-up:

Finally, let's build a forecasting model to make predictions based on the user's choice of type (deaths, confirmed, recovered) and horizon.
After some searching around I found a library called Prophet, which was open-sourced by Facebook.
facebook.github.io/prophet/
After some searching around I found a library called Prophet, which was open-sourced by Facebook.
facebook.github.io/prophet/
Prophet is a forecasting library for time series, and has a Quickstart guide for Python that should get us up and running:
bit.ly/3d9ak36
bit.ly/3d9ak36
Our final predict.py file receives data from the front-end (which we already know how to do), prepares the data as needed by the Prophet library (as specified in their docs), trains a forecast model, makes a prediction, and returns the results.
All this in about 10 lines of code. Not bad! (There's that abstraction working for us again).
You can look over the final predict.py file in the codebase on GitHub, which I link at the end of this thread.
You can look over the final predict.py file in the codebase on GitHub, which I link at the end of this thread.
In our index.html file I added 2 new functions for prepping data for the 2nd trace (to show the forecast). You'll see it's very similar to the ones we wrote for trace 1.
I also added the new "draw_forecast" function to the "done" property of our call_api function.
I also added the new "draw_forecast" function to the "done" property of our call_api function.
Have a look over the final index.html to see the changes. You should recognize the final changes as familiar code. If anything looks unfamiliar search online to learn why it might have been added.
And that's it!
Let's refresh our browser one last time to see the full application in action.
Let's refresh our browser one last time to see the full application in action.
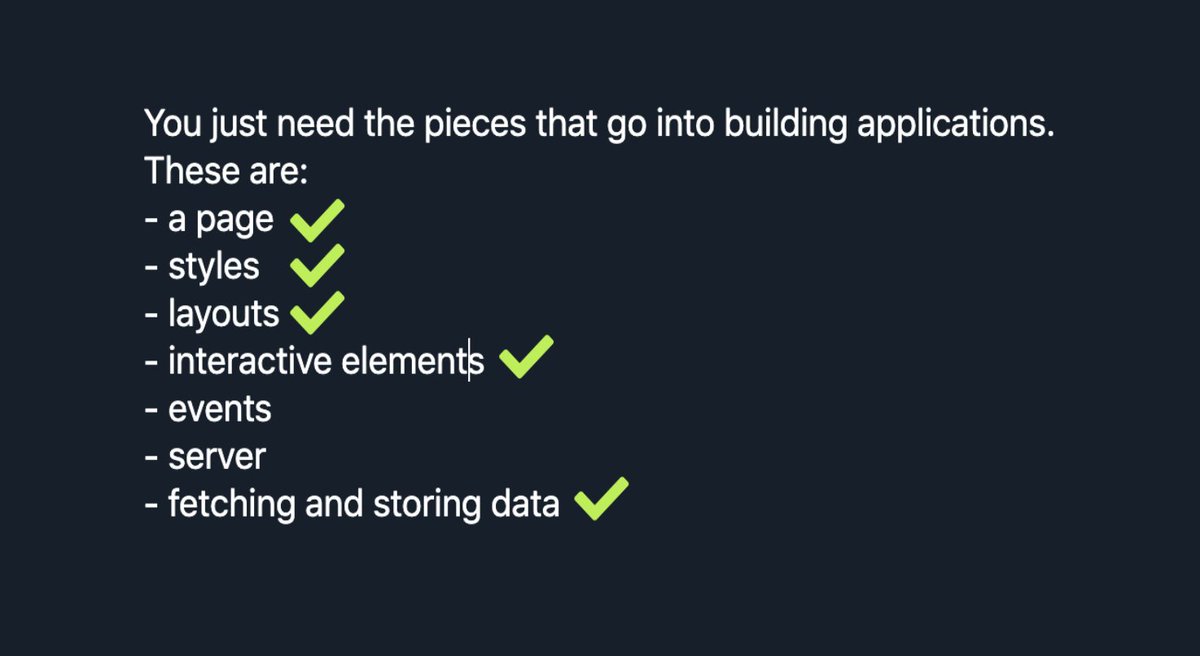
We achieved everything on our original list:

These are the major parts that go into building any application. With these skills you can grow and improve into the world of software development, or just use it as a hobby to build stuff.
Before sending the code off to GitHub I want to make some final style changes.
Before sending the code off to GitHub I want to make some final style changes.
I want to add a spinner when the user clicks FORECAST so they know to wait for the result.
I also want the Plotly chart to be transparent so we can see that nice blue background we had.
Finally, I'm going to change the title of our app now that it's something real.
I also want the Plotly chart to be transparent so we can see that nice blue background we had.
Finally, I'm going to change the title of our app now that it's something real.
You can find the final code here:
github.com/sean-mcclure/G…
github.com/sean-mcclure/G…

