My Authors
Read all threads
1/ More graphs and data on the real-time impact of COVID-19 on the economy: planes, trains and automobiles edition.
2/ US Railroad Traffic has bottomed out and recovered slightly in the last 4 weeks, per aar.org:
3/ However, a closer look shows divergence. Intermodal traffic (ie containers) is recovering...
4/ ... but railcar traffic (ie boxcars, tankers, hoppers -- used to transport grains, coal, chemicals, petroleum, autos etc) remains depressed.
5/ Global air freight shows a similar overall pattern: bottoming out in April, followed by stable volumes for the last 4 weeks, per CLIVE:
6/ Interesting, while air freight volumes have dropped, carrier revenues have actually increased. This is because the price per kg transported has gone up by a lot, per WorldACD:
7/ Why so? Because with commercial air travel almost non-existent, carriers have grounded planes. Fewer commercial flights means less available freight capacity. Freight load factors are in fact higher than last year:
8/ Now let's look at container shipping. The same high-level pattern applies: after bottoming in March, US west coast volumes have recovered in April, per BIMCO:
9/ Shipping firms have reacted to the decline in demand by aggressively "blanking" sailings. Idle container ships are at an all-time record:
10/ Thanks to this aggressive action, shipping rates are largely unchanged to/from the US:
11/ Meanwhile, Europe-China container rates tell an interesting story: normally heavily imbalanced, COVID-19 has equalized two-way freight volume and hence prices:
12/ Trucking has been hit less than other modes. March spot rates for reefers (refrigerated trucks) were actually higher than last year, per DAT. They subsequently declined and recovered, and are now close to 2019 levels:
13/ A longer term view places reefer spot rates firmly in the middle of their 2017-2020 range:
14/ However, as with container shipping, this is driven in large part by a contraction of supply. Reefer load-to-truck ratios have been at multi-year lows for a while:
15/ So while freight rates are stable and load-to-truck ratios are high, actual trucking volume is down. Traffic data from INRIX confirms this:
16/ Moving from commercial logistics to personal, the same INRIX data shows that passenger traffic dropped a lot more than truck traffic, but is recovering faster:
17/ The count of air travellers passing through TSA checkpoints has also, finally, started recovering, though it remains very low compared to last year:
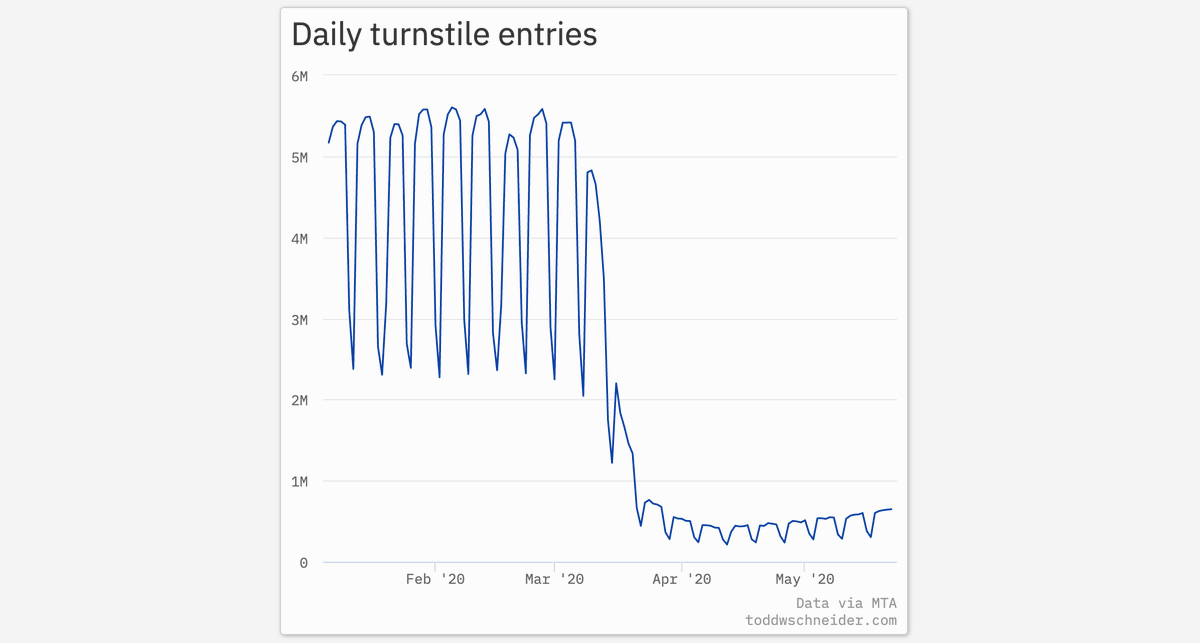
18/ Subway usage in NYC is also ticking up, albeit very slowly. Data from the MTA wrangled by @todd_schneider shows ridership at 10-15% normal (pre-covid) levels:
19/ How about foot traffic? SafeGraph estimates that foot traffic to businesses of all types has increased from a low of about -55% (versus normalcy) in mid April to about -30% currently.
20/ The degree of recovery varies. Using footfall-by-category data from SafeGraph, we see that airports and cineplexes are at 20% of normal. But shopping malls and bars are back above 40%. Coffeeshops, sit-down restaurants and hotels are above 60%.
21/ Supermarkets and general retailers saw footfall decline in April after a pantry-stocking spike in March, but they're now back at 90% of normal. They've been joined at that level by counter-service (fast-food) restaurants.
22/ Similar patterns are visible if you look at footfall by brand, again from SafeGraph. Home Depot is doing especially well; people sheltering in place have both the time and the motivation to improve / renovate their homes.
23/ This is consistent with Homebase data suggesting that Home & Repair is the category of small business that has seen the smallest downturn / largest recovery in hours worked.
24/ Costco footfall is surprisingly low but note that basket size is not necessarily constant over time; it seems plausible that customers are making fewer trips but buying more on each trip.
25/ A stylized summary of all the above charts is this: the economy bottomed out in early April, and has been recovering since; however we are still running well below normal levels.
26/ There were early signals of the bottoming in auto sales data over a month ago:
27/ With confirmation coming in early May:
28/ My best guess is that the bottoming was at around 50% of full economic capacity, and we're currently somewhere around 80%. Wide error bars around these estimates, obviously.
29/ Neither the downturn nor the recovery have been evenly distributed, and this has led to second-order effects, in everything from freight yields to index performance to business hiring.
30/ For me the interesting data questions going forward are:
31/ First, will we recover more or less smoothly all the way back to "normalcy", or will we plateau at some level before then? If so, at what level and when?
32/ Second, how many businesses have the ability to survive at say 90% of their normal income for a prolonged period? How many individuals likewise? (Balance sheets, cashflow, margins, fixed costs and so on)
33/ Third, we know some sectors are hurting badly. Will there be spillover from these sectors to others that have hitherto been immune or indeed outperforming?
34/ So I'm keeping an eye out for data that can be an early warning of obstacles. But equally, I'm watching for data to confirm that the recovery remains on track: if there's a line of sight to normalcy, then stocks are a bargain here even after the bounce from the March lows.
35/ Thanks for reading, and please remember, there's more to society than the economy.
Missing some Tweet in this thread? You can try to force a refresh.

Enjoying this thread?

Keep Current with Abraham Thomas

Profile picture

Stay in touch and get notified when new unrolls are available from this author!

Read all threads

This Thread may be Removed Anytime!

Twitter may remove this content at anytime, convert it as a PDF, save and print for later use!

Try unrolling a thread yourself!

how to unroll video

1) Follow Thread Reader App on Twitter so you can easily mention us!

2) Go to a Twitter thread (series of Tweets by the same owner) and mention us with a keyword "unroll" @threadreaderapp unroll

You can practice here first or read more on our help page!

Follow Us on Twitter!

Did Thread Reader help you today?

Support us! We are indie developers!


This site is made by just two indie developers on a laptop doing marketing, support and development! Read more about the story.

Become a Premium Member ($3.00/month or $30.00/year) and get exclusive features!

Become Premium

Too expensive? Make a small donation by buying us coffee ($5) or help with server cost ($10)

Donate via Paypal Become our Patreon

Thank you for your support!