
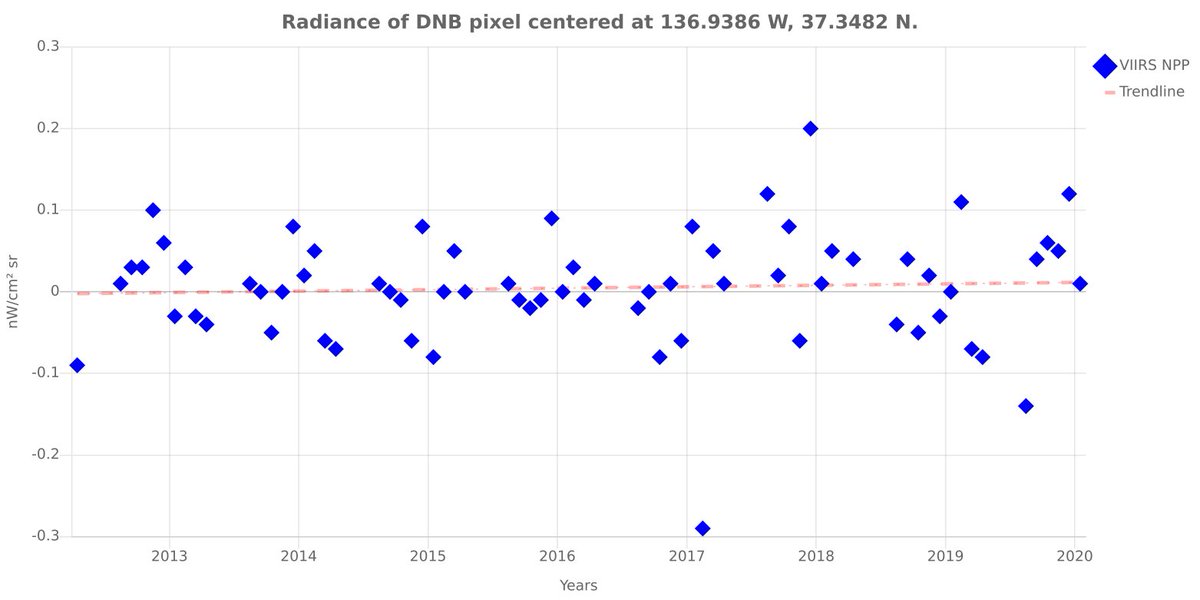
Jacqueline Coesfeld has developed a method to correct monthly Day/Night Band data from @eogatpayne to center areas with no light at zero. Link to the paper: mdpi.com/1424-8220/20/1…
Image shows the result for a random location in the Pacific Ocean. Thread 👇🏿
Image shows the result for a random location in the Pacific Ocean. Thread 👇🏿

There's a problem with viewing the Earth at night from space: the surface of the Earth is never actually "dark". Space based sensors view the Earth's through a glowing atmosphere. (Image iss061e110462.jpg)

On top of that, starlight is actually pretty bright.

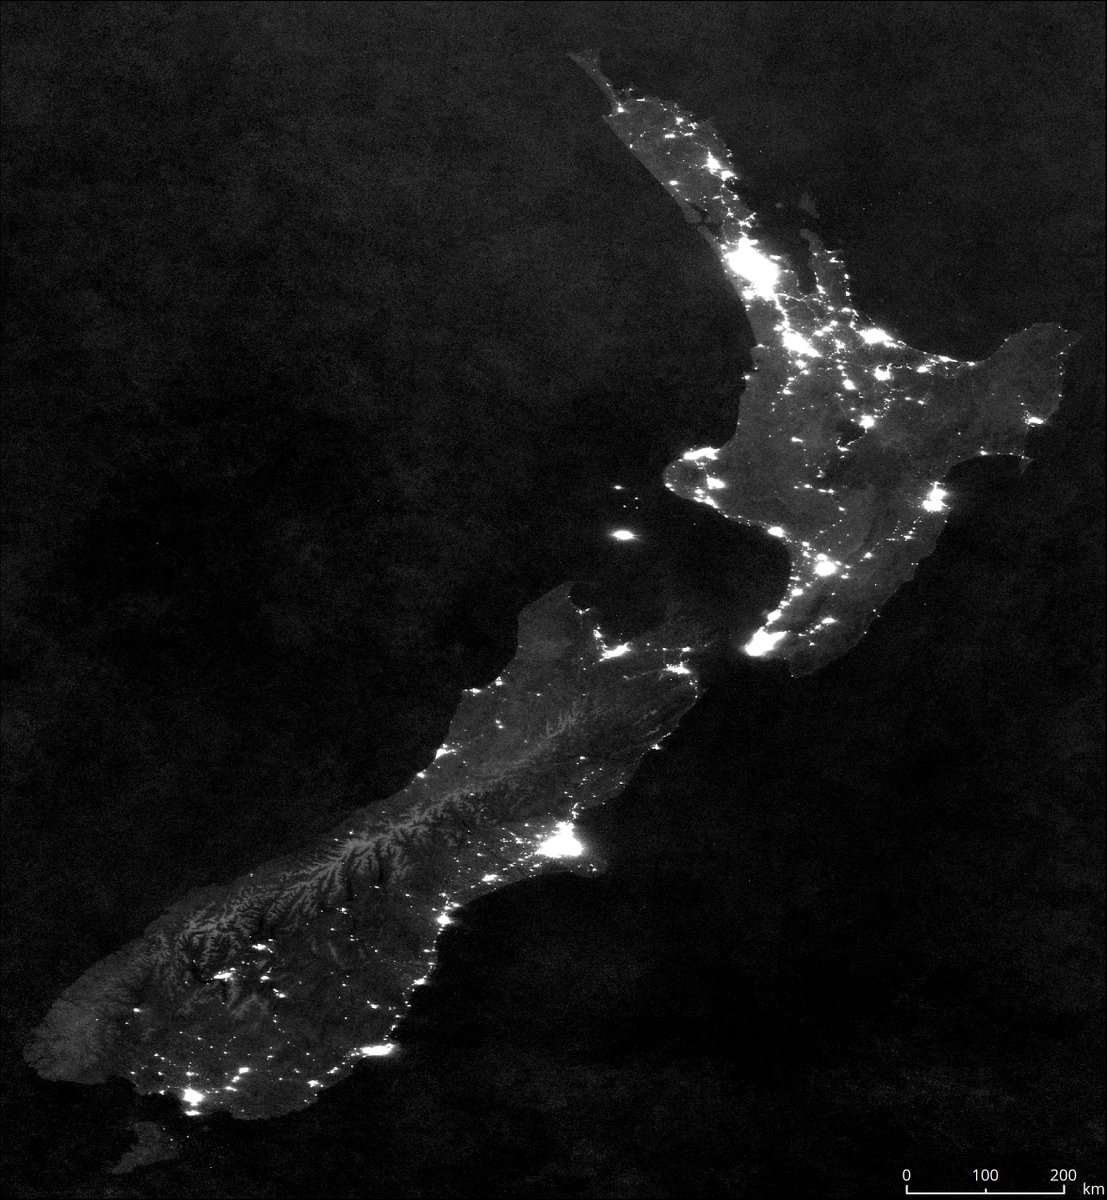
If your instrument is sensitive enough, you can see the difference in albedo (reflectivity) between land and sea using just reflected airglow and starlight.
(image by paper co-author @Helsche, more details here: lossofthenight.blogspot.com/2019/09/new-ze…)
(image by paper co-author @Helsche, more details here: lossofthenight.blogspot.com/2019/09/new-ze…)
So what's NOAA (or NASA) to do when they make an instrument to observe city lights? If it's sensitive enough, the instrument should never read "zero", because the satellite always observes some real (natural) light.
When they started using the DNB instrument, scientists from NOAA and NASA were surprised that they saw light when they looked at the Pacific Ocean in the middle of the night. They realized that it was due to airglow reflected from clouds. pnas.org/content/109/39…
The original calibration of DNB sort of accounted for this. Areas with no light were close to zero (which means that sometimes the sensor reported negative values). The average in unlit areas was positive, however, which means that they weren't taking out airglow completely.
In 2017, NASA changed the way they did their pre-processing, to hopefully have "zero DNB value" mean there was really no light there: ieeexplore.ieee.org/document/81280…
But that's not particularly helpful for people studying artificial light, because it means there is a jump in 2017.
But that's not particularly helpful for people studying artificial light, because it means there is a jump in 2017.
In 2018 and 2019, I looked at artisanal mining sites in the Democratic Republic of the Congo, to see whether light was present. (@KlementTockner suggested to me that perhaps this might be a way to detect illegal mining years ago).
As it turned out, we didn't see lights on late at night at mining sites the Congo. But I (accidentally) found out that there are large scale correlations in the "zero" value for the @eogatpayne DNB monthly composites. mdpi.com/2571-8800/2/2/…

This suggested to me that it should be possible to increase the sensitivity of DNB to very faint artificial light by reducing these variations. I asked my work study student Jacqueline Coesfeld to look into it.
Originally we had hoped that we might just need a single value for the whole world (that's what the Congo data suggested). But it turns out that the correlation does not hold up quite as well across the whole world.
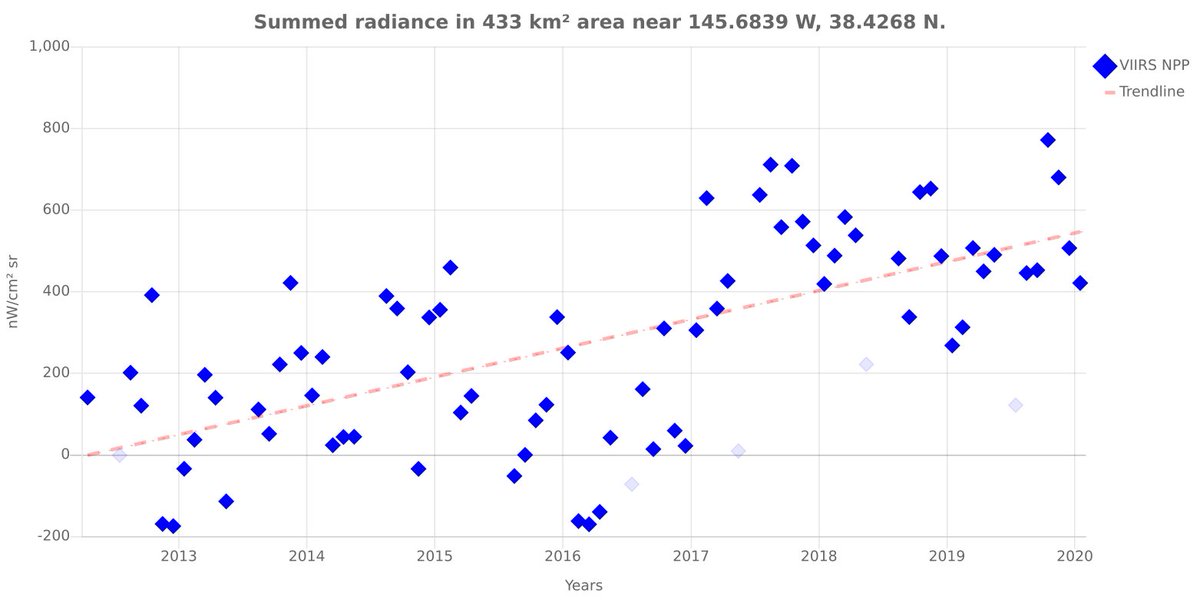
(Image from the new paper: mdpi.com/1424-8220/20/1…)
(Image from the new paper: mdpi.com/1424-8220/20/1…)

So our idea was to develop a correction that varies across the face of the Earth. Jacqueline created a grid of 2,016 points on the Earth, and at each point looked for a location (relatively) nearby that was far from human residences and light.

If you take all of the @eogatpayne data values at each of these grid points and draw them, you basically have a low-resolution image of local airglow for the month.

You can then interpolate between the points to get a corrected value for any region on Earth. Here are some of the places we looked at in the paper.
(Panel f shows that the correction doesn't matter when you have a bright artificial light source.)
(Panel f shows that the correction doesn't matter when you have a bright artificial light source.)

This doesn't matter if you look at a single city. But if you want to look at the lights of a whole country (like I did for the 2012-2016 data here advances.sciencemag.org/content/3/11/e…), then the "dark" spaces in between the city become really important.
A lot of people have written to me in the last two years asking "what's up with North Korea? Why is it getting brighter so rapidly?".
The answer is: it's not...
The answer is: it's not...

Anyway, that's it for me, now it's YOUR turn! Jurij Stare has already implemented (a modified version of) Jacqueline's code on the Radiance #LightTrends website: lighttrends.lightpollutionmap.info
On the "satellite" button at left, choose "VIIRS DNB (zero point correction)"
On the "satellite" button at left, choose "VIIRS DNB (zero point correction)"
(If you've used #LightTrends before, you might need to refresh your browser to get the latest version)
All of Jacqueline's code and data is available from @GFZ_Potsdam Data Services: doi.org/10.5880/GFZ.1.…
This includes code to (rapidly) get data for individual points. We are currently working on a revised version of our paper about global change in night lights using this.
This includes code to (rapidly) get data for individual points. We are currently working on a revised version of our paper about global change in night lights using this.
(Please be kind and don't scoop us...)
As a final note, I want to thank one of the anonymous reviewers for discovering an error in our initial version of the code related to the spacing of points on Earth's surface. It didn't have any impact on the results, but I am glad we have it corrected in the published version.

