
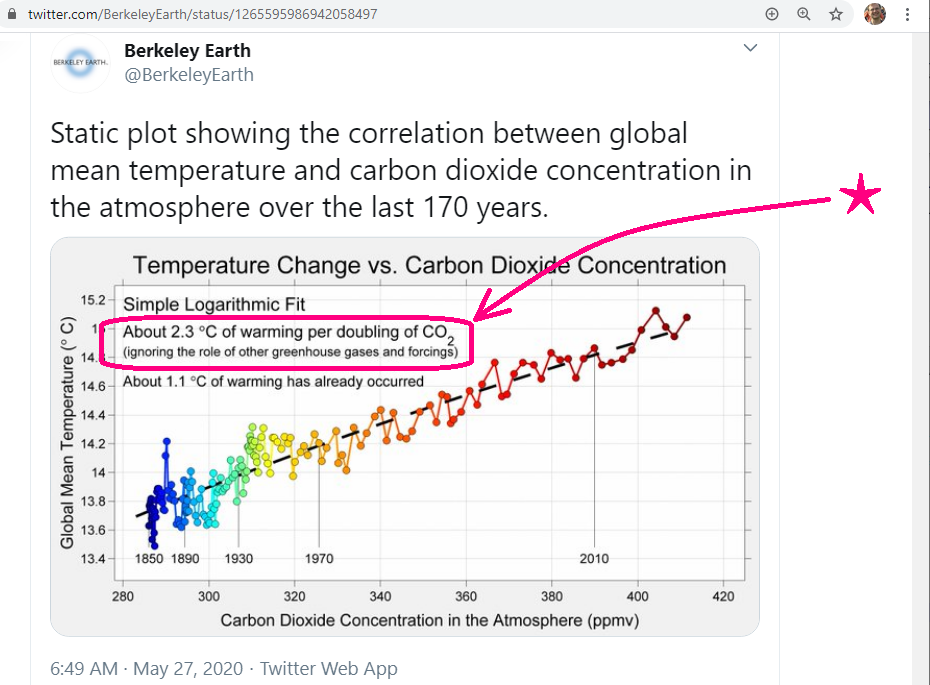
@BerkeleyEarth [1/11] BEST's figures imply MUCH LOWER climate sensitivity than IPCC claims.
You show, "About 2.3°C of warming per doubling of CO2 (ignoring the role of other greenhouse gases and forcings)."
But to deduce climate sensitivity (to CO2), you CANNOT ignore other GHGs.
[cont'd]
You show, "About 2.3°C of warming per doubling of CO2 (ignoring the role of other greenhouse gases and forcings)."
But to deduce climate sensitivity (to CO2), you CANNOT ignore other GHGs.
[cont'd]
@BerkeleyEarth [2/11] Even if we assume that none of the warming is natural, if 30% of the warming is due to increases in minor GHGs like O3, CH4, N2O & CFCs, then "climate sensitivity" from a doubling of CO2, according to BEST's figures, is only 0.7 × 2.3 = 1.6°C.
[cont'd]
[cont'd]
@BerkeleyEarth [3/11] That's a "practical estimate" of climate sensitivity, from surface station measurements. However, if the best satellite data were used, instead of BEST's surface temperatures, sensitivity would be almost 30% lower:
woodfortrees.org/plot/best/from…
sealevel.info/BEST_vs_UAH_20…
[cont'd]
woodfortrees.org/plot/best/from…
sealevel.info/BEST_vs_UAH_20…
[cont'd]

@BerkeleyEarth [4/11] That makes climate sensitivity to a doubling of CO2 only 1.23°C.
Since that's based on real-world forcing (instead of the faster rise used for the TCR definition), the 1.6°C or 1.23°C per doubling is "between TCR & ECS" (probably about an average of TCR & ECS).
[cont'd]
Since that's based on real-world forcing (instead of the faster rise used for the TCR definition), the 1.6°C or 1.23°C per doubling is "between TCR & ECS" (probably about an average of TCR & ECS).
[cont'd]
@BerkeleyEarth [5/11] ECS is usually estimated at 1.25× to 1.6× TCR. So:
If 1.6°C is avg of TCR & ECS, it means TCR is 1.23 to 1.42°C, and ECS is 1.77 to 1.97°C.
If 1.23°C is avg of TCR & ECS, it means TCR is 0.95 to 1.09°C, and ECS is 1.37 to 1.51°C.
See: sealevel.info/BEST_vs_UAH_20…
[cont'd]
If 1.6°C is avg of TCR & ECS, it means TCR is 1.23 to 1.42°C, and ECS is 1.77 to 1.97°C.
If 1.23°C is avg of TCR & ECS, it means TCR is 0.95 to 1.09°C, and ECS is 1.37 to 1.51°C.
See: sealevel.info/BEST_vs_UAH_20…
[cont'd]
@BerkeleyEarth [6/11] That gives an overall TCR range of 0.95 to 1.42°C, and an overall ECS range of 1.37 to 1.97°C.
Those sensitivities are obviously FAR BELOW the assumptions baked into most CMIP6 models and IPCC reports, which means their warming projections are much too large.
[cont'd]
Those sensitivities are obviously FAR BELOW the assumptions baked into most CMIP6 models and IPCC reports, which means their warming projections are much too large.
[cont'd]
@BerkeleyEarth [7/11] You say, "About 1.1°C of warming has already occurred," and "if carbon dioxide concentrations keep rising at historical rates, global warming could more than triple this century."
That's wrong, for two reasons.
[cont'd]
That's wrong, for two reasons.
[cont'd]
@BerkeleyEarth [8/11] 1. It assumes WILDLY accelerated warming, from an approx linear continuation of forcing, for which there's no basis. Even BEST's 0.192°C/decade yields only 1.536°C of add'l warming by 2100. UAH6's 0.134°C/decade yields only 1.072°C by 2100.
sealevel.info/co2.html?co2sc…
[cont'd]
sealevel.info/co2.html?co2sc…
[cont'd]


@BerkeleyEarth [9/11] 2. It assumes an implausible continuation of exponentially increasing CO2 level growth (necessary for continuation of the linear trend in forcing). But resource constraints ensure the forcing trend will fall below linear long before 2100.
researchgate.net/publication/30…
[cont'd]
researchgate.net/publication/30…
[cont'd]
@BerkeleyEarth [10/11] Also, negative feedbacks (mainly terrestrial "greening," and oceans) are removing CO2 from the air at an accelerating rate.
sealevel.info/feedbacks#gree…
So (unfortunately!) it's unlikely that mankind's use of fossil fuels can ever drive CO2 level above 700 ppmv.
[cont'd]
sealevel.info/feedbacks#gree…
So (unfortunately!) it's unlikely that mankind's use of fossil fuels can ever drive CO2 level above 700 ppmv.
[cont'd]
@BerkeleyEarth [11/11] Since CO2 forcing trend log(level) is almost certain to fall below linear later this century, rate of temperature increase, which is already too slow to reach the temperatures you project, should slow BELOW even the current slow 0.134°C to 0.192°C/decade linear trend.
###
###
@BerkeleyEarth @BerkeleyEarth, do you not have have any comment on the fact that your data implies a much lower climate sensitivity to rising CO2 levels than the IPCC claims?
@BerkeleyEarth @BerkeleyEarth, are you there?
@RichardAMuller @stevenmosher @RARohde @hausfath @JudithSissener @BerkeleyPhysics
@RichardAMuller @stevenmosher @RARohde @hausfath @JudithSissener @BerkeleyPhysics
@BerkeleyEarth @RichardAMuller @stevenmosher @RARohde @hausfath @JudithSissener @BerkeleyPhysics @BerkeleyEarth, will you please reply?
The temperature measurements imply TCR between 0.95 & 1.42°C, and ECS between 1.37 & 1.97°C. Will you at least acknowledge that your measurements imply climate sensitivity well below IPCC estimates?
sealevel.info/twitter_Berkel…
The temperature measurements imply TCR between 0.95 & 1.42°C, and ECS between 1.37 & 1.97°C. Will you at least acknowledge that your measurements imply climate sensitivity well below IPCC estimates?
sealevel.info/twitter_Berkel…

@BerkeleyEarth @RichardAMuller @stevenmosher @RARohde @hausfath @JudithSissener @BerkeleyPhysics @BerkeleyEarth team: @RichardAMuller, @stevenmosher, @RARohde, @hausfath, @JudithSissener —
Will you please acknowledge that your data shows ECS climate sensitivity to a doubling of CO2 is <2°C, and TCR is <1.5°C?
@BerkeleyPhysics, how about a response?
sealevel.info/learnmore.html
Will you please acknowledge that your data shows ECS climate sensitivity to a doubling of CO2 is <2°C, and TCR is <1.5°C?
@BerkeleyPhysics, how about a response?
sealevel.info/learnmore.html

@BerkeleyEarth @RichardAMuller @stevenmosher @RARohde @hausfath @JudithSissener @BerkeleyPhysics This tweetstorm is also manually unrolled here:
wattsupwiththat.com/2021/02/24/cro…
@BerkeleyEarth team: @RichardAMuller, @stevenmosher, @RARohde, @hausfath, @JudithSissener — please acknowledge that your own data show ECS climate sensitivity to a doubling of CO2 is <2°C, and TCR is <1.5°C.
wattsupwiththat.com/2021/02/24/cro…
@BerkeleyEarth team: @RichardAMuller, @stevenmosher, @RARohde, @hausfath, @JudithSissener — please acknowledge that your own data show ECS climate sensitivity to a doubling of CO2 is <2°C, and TCR is <1.5°C.

• • •
Missing some Tweet in this thread? You can try to
force a refresh


