My Authors
Read all threads
As promised last week .

Here I am starting tread on data driven trading . That means we will trade Based on past data .

I captured Nifty's 13 Years of the data for this study .

We will assume whatever has happened in past will also happen in future .

here we go -
Starting with Nifty Monthly data -

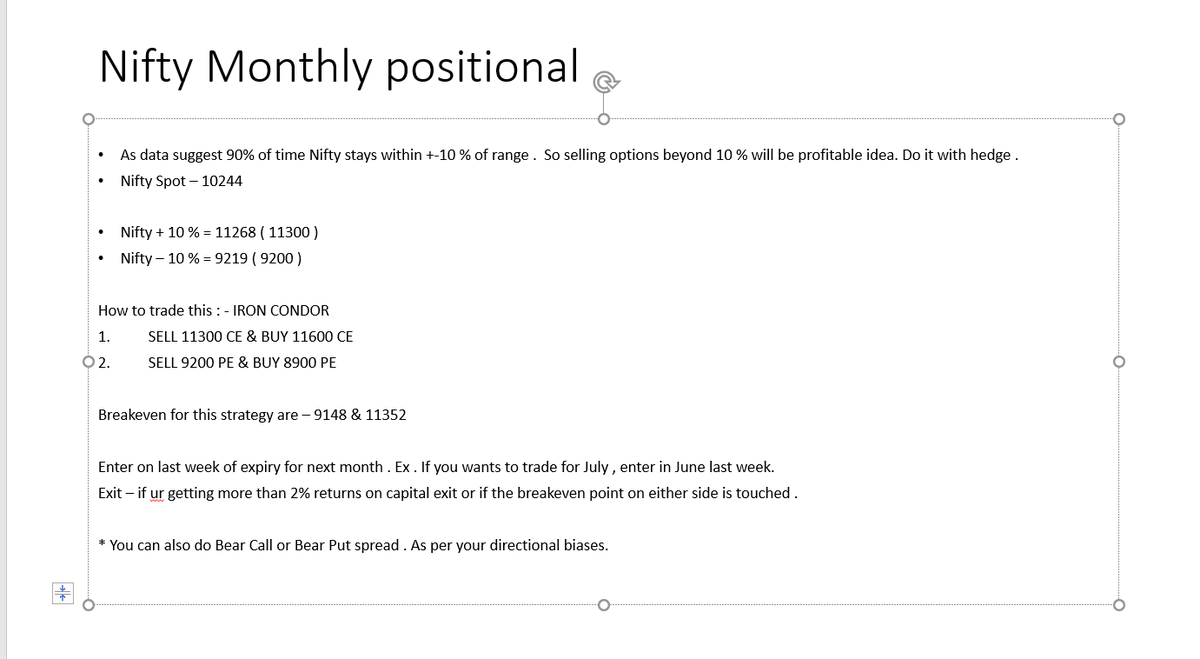
see below pic - Data collected for past 153 months . focus on light blue area . As per data 90% of the time Nifty closed within +-10% range from spot . Also 90% of the time it has not crossed 10% from spot . Image
That Means if we sell options beyond 10% with hedge we can easily earn some profit every month .

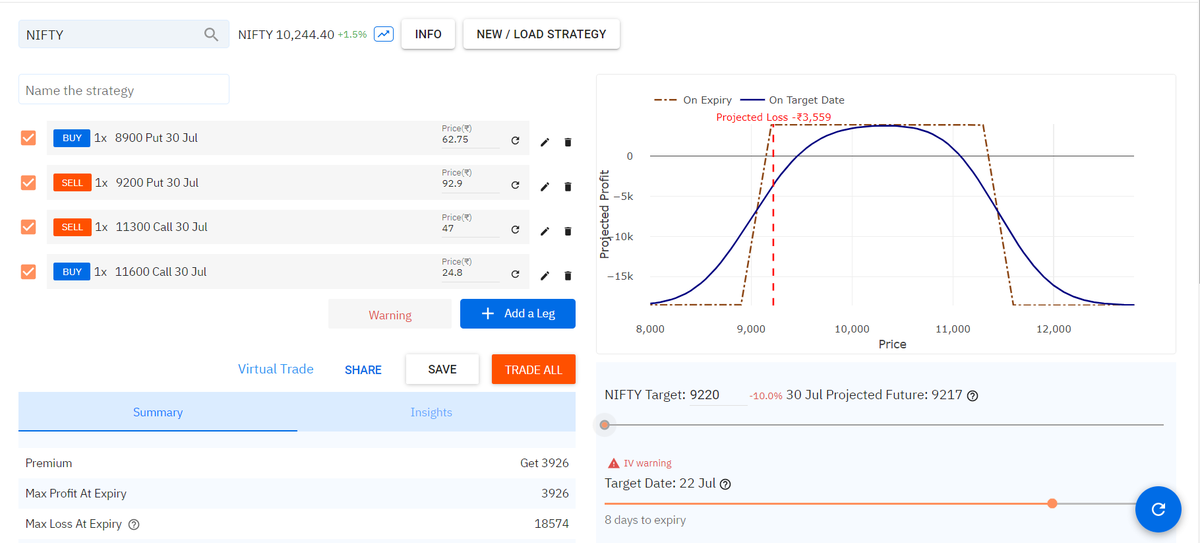
See below pic - for strategy Image
See in this strategy , we shorted options beyond 10% . That means we will be accurate 90% of the time as per past data .
also we initiated risk defined strategy , means our loss is also limited if strategy went wrong . ImageImage
Now when to enter and when to exit : -

Enter on last week of expiry for next month . Ex . If you wants to trade for July , enter in June last week.
Exit – if ur getting more than 2% returns on capital exit or exit/adjust if the break even point on either side is touched .
For monthly strategy this thread ends here .

Next is weekly data : -
See below Pic . 663 Weeks data analysed. As per data 95% of the time Nifty trades withing 5 % range on weekly time frame . That means if we sell nifty weekly options beyond 5% range with hedge we can earn some profit every week . Image
General observations : -
1. Weekly options are very volatile as compared to monthly .
2. If ur getting 1% return on your strategy just exit and relax
3. If ur getting Max 1-2 % loss on your strategy , just exit and relax .
4. If ur breakeven is more than 5% on both side . you entered on Friday at 15:00 Hrs & Monday opening is flat then you will get 1% returns on Monday itself . So exit and book profit , wait for next Friday.

Risk :- BIG GAP UP OR GAP DOWN .
Good strategies : -
Iron condor
Ratio spreads on both call and put side .
Bear Call and Bull Put spread based on view .

Always create risk defined strategies .
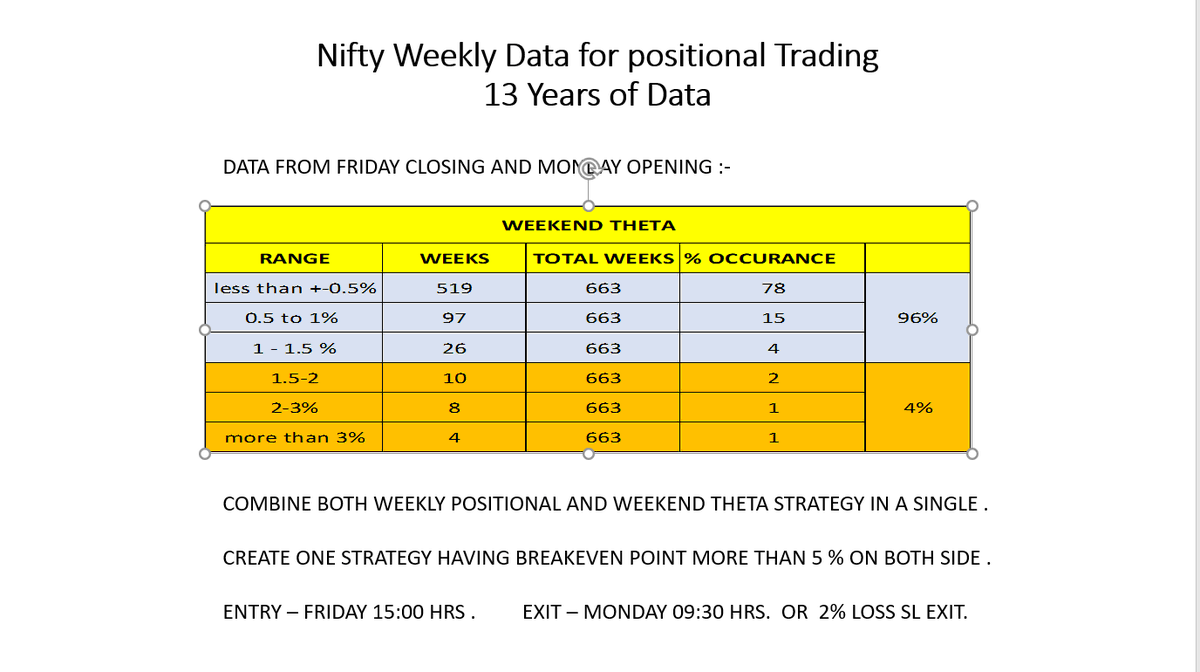
Those who wants to capture weekend Theta following data is for you : -

As per data 90 % of the time Nifty opened flat may be up 0.5% - 1% range from fridays closing . Image
COMBINE BOTH WEEKLY POSITIONAL AND WEEKEND THETA STRATEGY IN A SINGLE STRATEGY.

CREATE ONE STRATEGY HAVING BREAKEVEN POINT MORE THAN 5 % ON BOTH SIDE .

ENTRY – FRIDAY 15:00 HRS . EXIT – MONDAY 09:30 HRS. OR 2% LOSS SL EXIT.

RISK - BIG GAP-UP / GAP DOWN
Before deploying any strategy please check break-even point are more than 5% away from spot . Exit ur getting profit up to 1% or if ur breakeven point is touched .

This thread ends here . Please feel free to ask for any doubts . Retweet it if you liked .
Missing some Tweet in this thread? You can try to force a refresh.

Keep Current with JK🇮🇳

Profile picture

Stay in touch and get notified when new unrolls are available from this author!

Read all threads

This Thread may be Removed Anytime!

Twitter may remove this content at anytime, convert it as a PDF, save and print for later use!

Try unrolling a thread yourself!

how to unroll video

1) Follow Thread Reader App on Twitter so you can easily mention us!

2) Go to a Twitter thread (series of Tweets by the same owner) and mention us with a keyword "unroll" @threadreaderapp unroll

You can practice here first or read more on our help page!

Follow Us on Twitter!

Did Thread Reader help you today?

Support us! We are indie developers!


This site is made by just two indie developers on a laptop doing marketing, support and development! Read more about the story.

Become a Premium Member ($3.00/month or $30.00/year) and get exclusive features!

Become Premium

Too expensive? Make a small donation by buying us coffee ($5) or help with server cost ($10)

Donate via Paypal Become our Patreon

Thank you for your support!