
Labour market statistics: a thread pulling together the various data sources.👇
The overall picture has been a worsening labour market, but the rate of weakening slowed into June. For example, HMRC tax data showed the fall in people on the payroll moderated. (1/n) 
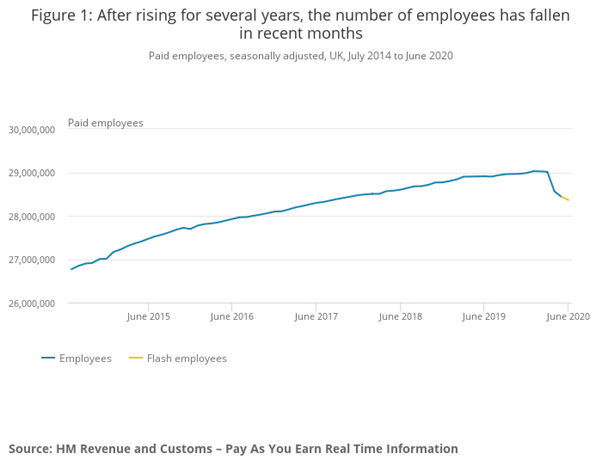
(Of course all of this does not reflect recently reported job losses, which might show up in future labour market statistics.) (2/n)
Our regular labour market statistics (based on the Labour Force Survey) have also showed a weakening position, but not as dramatic as the administrative data from DWP and HMRC. Why is this? (3/n)
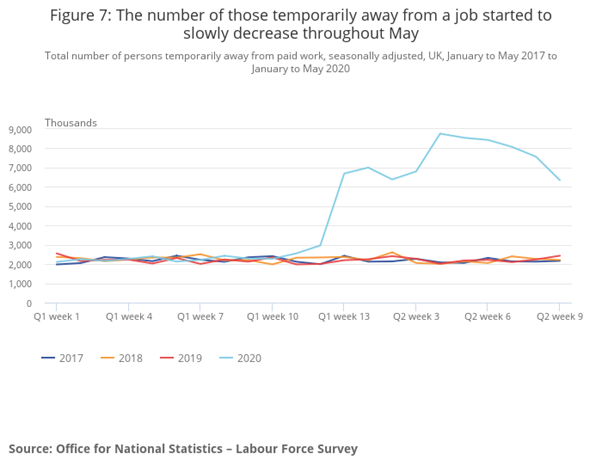
An important reason appears to be the roughly half a million people we have identified who say they have a job, but are away from it and not being paid. See here for more information. (4/n)
blog.ons.gov.uk/2020/07/16/a-c…
blog.ons.gov.uk/2020/07/16/a-c…
As these people tell us they have a job, they show up as employed in our statistics. But they are unlikely to show up on the HMRC payroll statistics. They may also be counted in the claimant count as not being in paid work. (5/n)
Once we factor in those people, the various data sources look much more coherent. (6/n)
Looking across the wider range of labour market data a few themes stand out. (7/n)
Firstly, while some people have sadly lost their jobs, the biggest response of employers remains cutting hours rather than employment. Lower hours includes putting people onto furlough - though there is some evidence of some people returning to work. (8/n)
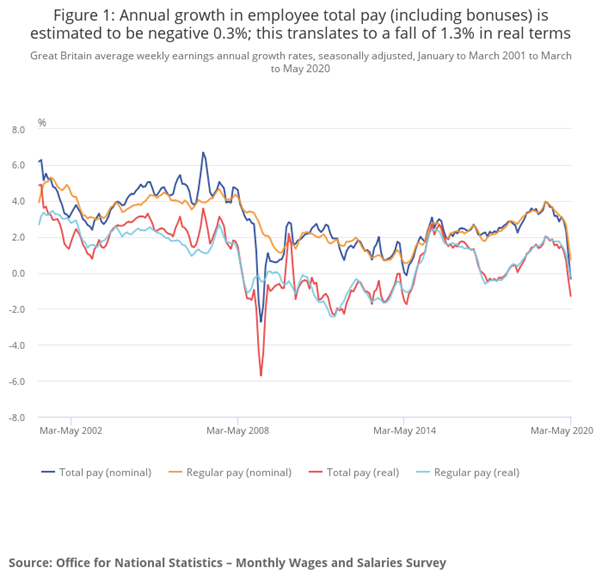
In turn, as furloughed workers are often on partial pay, we are seeing wages fall in real terms. As people return to normal hours, we might see this effect unwind. (9/n)
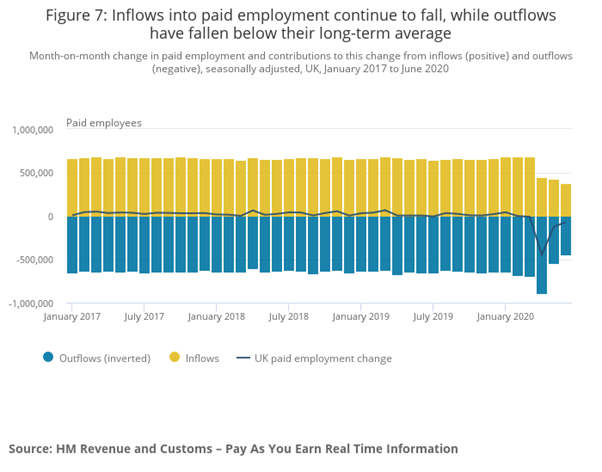
Secondly, the most important reason (at the moment) for falling employment seems to be lower numbers of people starting work. We are not seeing a big rise in people leaving jobs (again, at the moment). (10/n)
The chart below shows inflows and outflows onto payrolls – after a rise, in outflows in April, you can see both inflows and outflows have fallen in May and June below their pre-pandemic levels. (11/n)
Thirdly, while employment is falling, it appears many people who are now not working are no longer looking for a job. This means we do not count them as unemployed, but among the rather inelegantly termed ‘economically inactive’. (12/n)
If this trend continues it could be a source of concern: if people are not actively looking for work, they are not likely to find a job. So understanding the movements between unemployment and inactivity is really important. (13/n)
All in all, there is still a lot of flux in the labour market and considerable uncertainty over prospects for the coming months. In particular, what happens to the millions of people who are furloughed. (14/n)


