1/
Get a cup of coffee.
(Or, as the wise @JohnLegere says, get many cups of coffee!)
In this thread, I'll show you how to do CAGR calculations.
For those unfamiliar, CAGR = Compounded Annual Growth Rate. It's also called IRR (Internal Rate of Return).
Get a cup of coffee.
(Or, as the wise @JohnLegere says, get many cups of coffee!)
In this thread, I'll show you how to do CAGR calculations.
For those unfamiliar, CAGR = Compounded Annual Growth Rate. It's also called IRR (Internal Rate of Return).
https://twitter.com/JohnLegere/status/1283210193694842886?s=20
2/
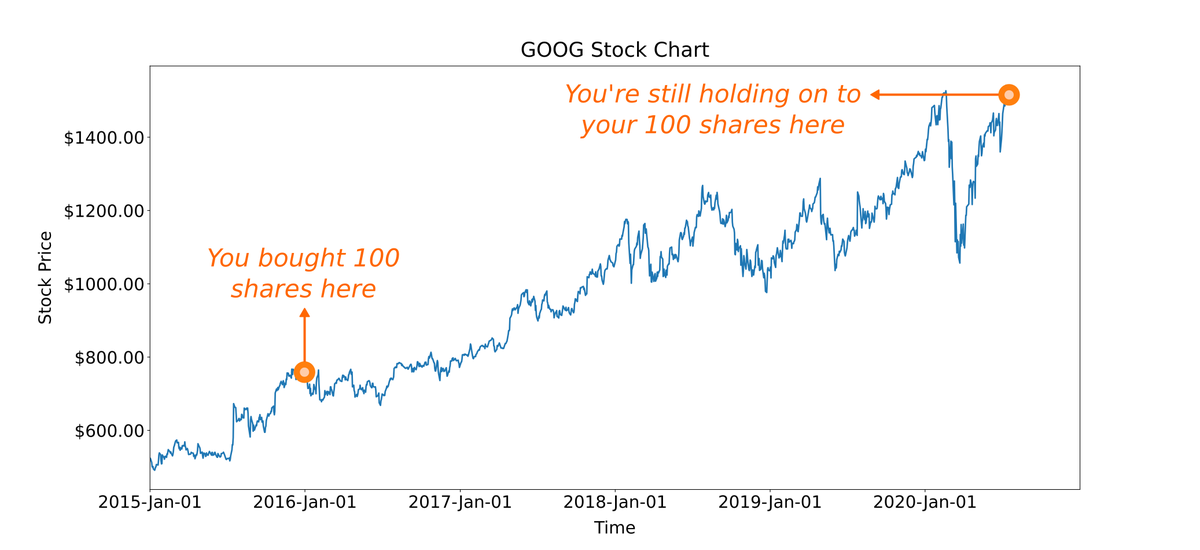
Imagine that you bought 100 shares of Google ($GOOG) on Dec 31, 2015 (about 4.5 years ago).
At that time, $GOOG was trading at $758.88 per share. Today, it's at $1,515.55.
Assuming you're still holding on to your 100 shares, what's your rate of return on this investment?
Imagine that you bought 100 shares of Google ($GOOG) on Dec 31, 2015 (about 4.5 years ago).
At that time, $GOOG was trading at $758.88 per share. Today, it's at $1,515.55.
Assuming you're still holding on to your 100 shares, what's your rate of return on this investment?
3/
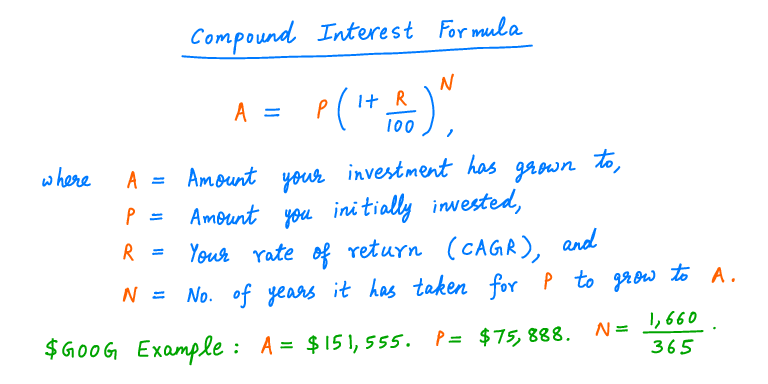
Well, your initial investment was $75,888 (100 shares times $758.88 per share).
That $75,888 has now grown to $151,555 (100 shares times $1,515.55 per share).
This growth has happened between 2015-Dec-31 and 2020-Jul-17 -- a period of 1,660 days.
Well, your initial investment was $75,888 (100 shares times $758.88 per share).
That $75,888 has now grown to $151,555 (100 shares times $1,515.55 per share).
This growth has happened between 2015-Dec-31 and 2020-Jul-17 -- a period of 1,660 days.
4/
So you just plug these numbers into the standard compound interest formula:
So you just plug these numbers into the standard compound interest formula:
5/
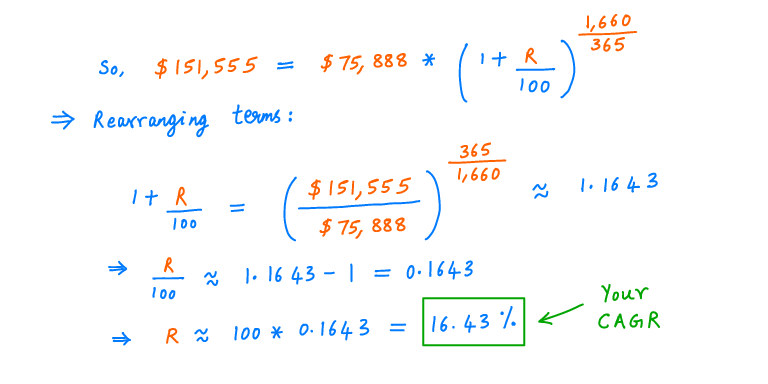
And if you rearrange the terms in the formula, you get your CAGR.
In this case, your CAGR works out to about 16.43%.
And if you rearrange the terms in the formula, you get your CAGR.
In this case, your CAGR works out to about 16.43%.
6/
Essentially, what this 16.43% CAGR means is:
Suppose you found a bank that paid 16.43% interest annually.
And suppose you deposited $75,888 into that bank on 2015-Dec-31.
Then, your money would have grown to $151,555 by 2020-Jul-17 -- same as your $GOOG investment.
Essentially, what this 16.43% CAGR means is:
Suppose you found a bank that paid 16.43% interest annually.
And suppose you deposited $75,888 into that bank on 2015-Dec-31.
Then, your money would have grown to $151,555 by 2020-Jul-17 -- same as your $GOOG investment.
7/
But you don't usually just buy a stock once and hold on forever.
You add to your position over time. Sometimes, you trim your position.
How do you calculate your CAGR in such cases?
But you don't usually just buy a stock once and hold on forever.
You add to your position over time. Sometimes, you trim your position.
How do you calculate your CAGR in such cases?
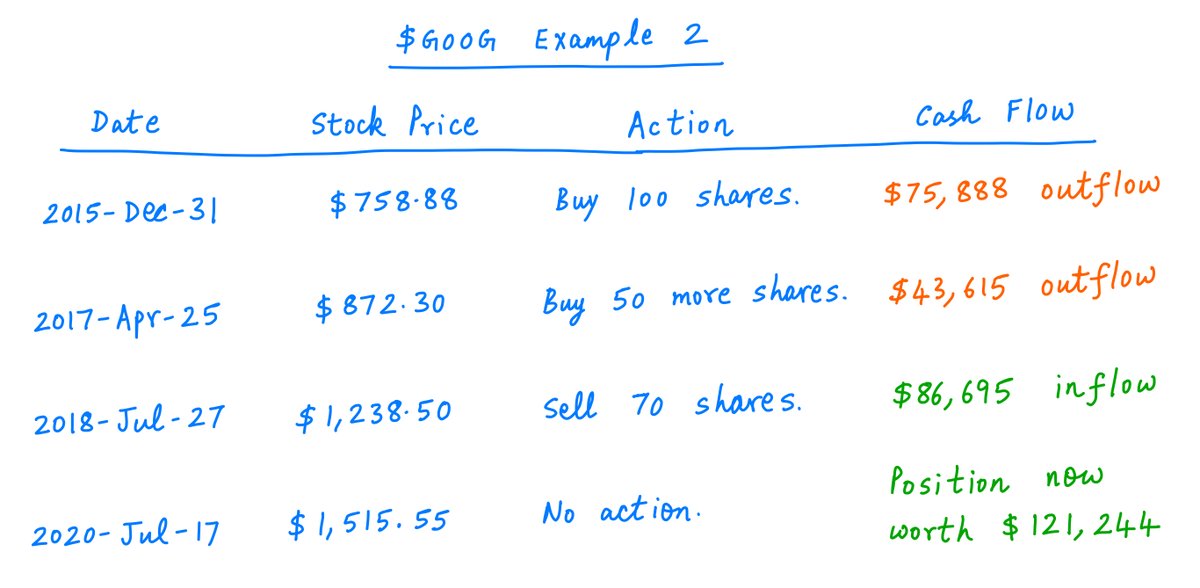
8/
Let's take an example.
Say you bought 100 shares of $GOOG on 2015-Dec-31.
Then, on 2017-Apr-25, say you bought 50 more shares.
Then, on 2018-Jul-27, say you sold 70 shares.
This left you with 100 + 50 - 70 = 80 shares, which we'll assume you're still holding today:
Let's take an example.
Say you bought 100 shares of $GOOG on 2015-Dec-31.
Then, on 2017-Apr-25, say you bought 50 more shares.
Then, on 2018-Jul-27, say you sold 70 shares.
This left you with 100 + 50 - 70 = 80 shares, which we'll assume you're still holding today:
9/
As the table above shows, your actions result in some cash inflows and outflows over time.
Every time you buy stock, there's a cash outflow. And every time you sell, there's a cash inflow.
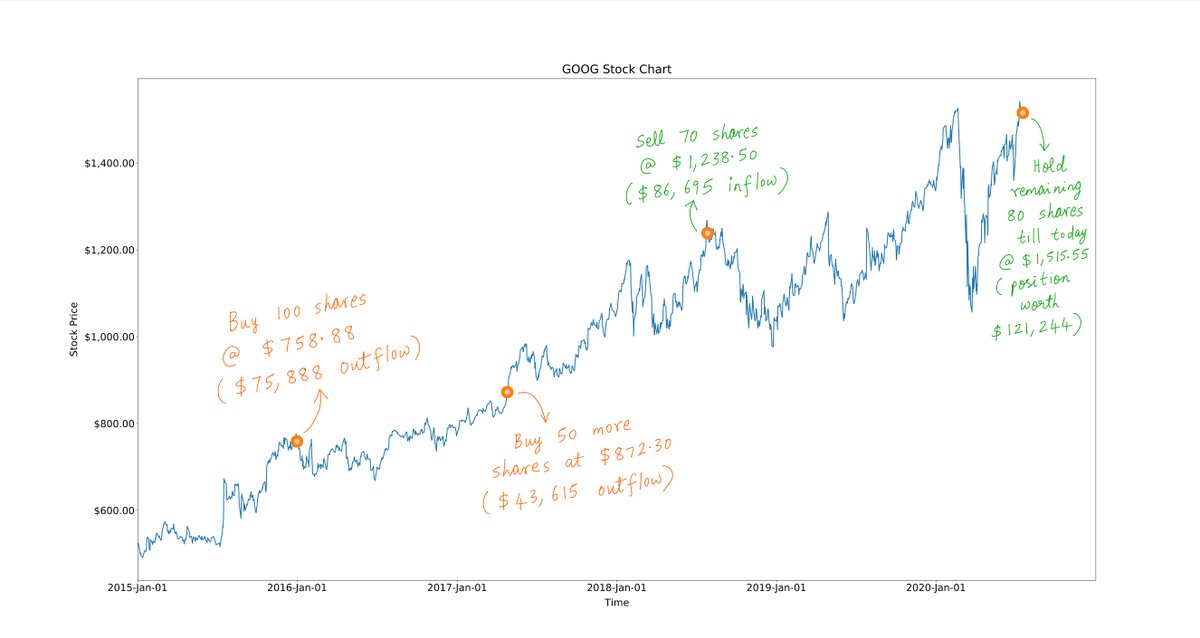
Here they are, marked on $GOOG's stock chart:
As the table above shows, your actions result in some cash inflows and outflows over time.
Every time you buy stock, there's a cash outflow. And every time you sell, there's a cash inflow.
Here they are, marked on $GOOG's stock chart:
10/
You can create a "cash flow timeline" that neatly captures these inflows and outflows. Like so:
You can create a "cash flow timeline" that neatly captures these inflows and outflows. Like so:

11/
Going back to the bank analogy: every cash *outflow* is like a *deposit* you make into a hypothetical bank account that's compounding your money.
And similarly, every cash *inflow* is like a withdrawal you make from the same bank account.
Going back to the bank analogy: every cash *outflow* is like a *deposit* you make into a hypothetical bank account that's compounding your money.
And similarly, every cash *inflow* is like a withdrawal you make from the same bank account.
12/
Imagine what would happen if you actually made these deposits and withdrawals.
Each deposit will give you a "benefit" that compounds over time, and each withdrawal will negate some of the benefit created by the deposits.
Imagine what would happen if you actually made these deposits and withdrawals.
Each deposit will give you a "benefit" that compounds over time, and each withdrawal will negate some of the benefit created by the deposits.
13/
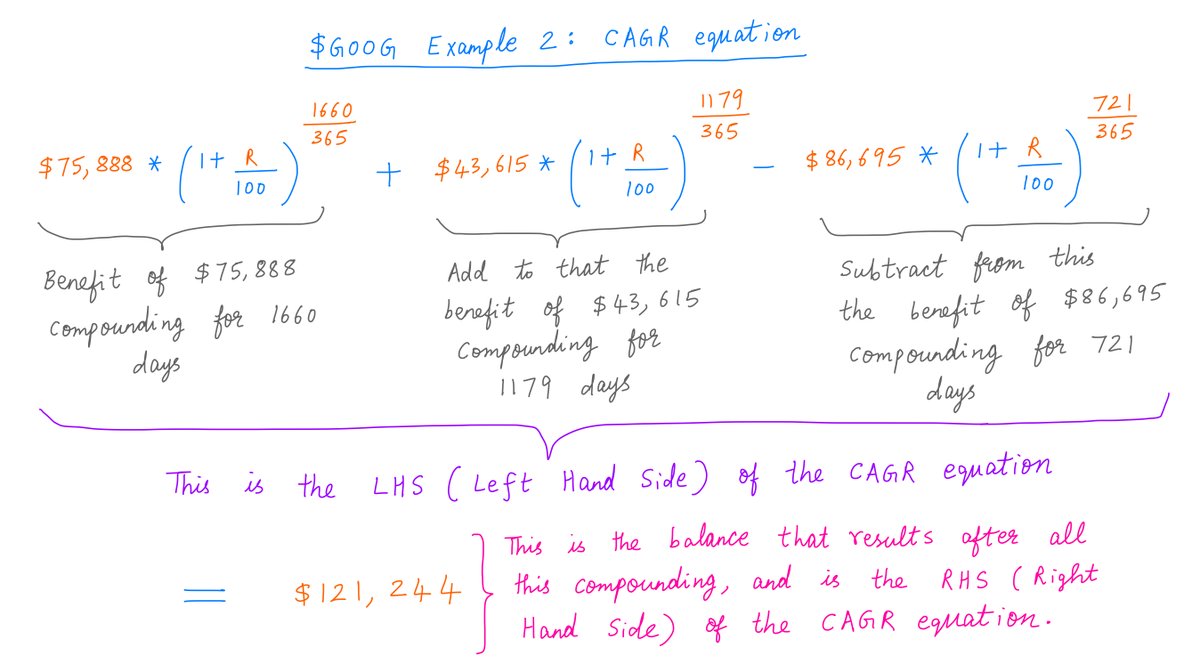
For example, buying 100 shares of $GOOG on 2015-Dec-31 gives you the benefit of $75,888 compounding for 1,660 days.
And selling 70 shares on 2018-Jul-27 erases the benefit of $86,695 compounding for 721 days.
This all follows from the "cash flow timeline" above.
For example, buying 100 shares of $GOOG on 2015-Dec-31 gives you the benefit of $75,888 compounding for 1,660 days.
And selling 70 shares on 2018-Jul-27 erases the benefit of $86,695 compounding for 721 days.
This all follows from the "cash flow timeline" above.
14/
These compounding benefits and negations all ultimately add up to your end balance ($121,244 in this case).
To capture this, we write a "CAGR equation".
The left side (LHS) of the equation takes care of all the compounding. The right side (RHS) is your end balance.
Pic:
These compounding benefits and negations all ultimately add up to your end balance ($121,244 in this case).
To capture this, we write a "CAGR equation".
The left side (LHS) of the equation takes care of all the compounding. The right side (RHS) is your end balance.
Pic:
15/
All that remains is to solve this equation to find R (our CAGR).
But this equation is *not* like the earlier equation we solved.
In the earlier equation, we could just rearrange the terms to solve for R.
But here, that's not possible. We need more powerful techniques.
All that remains is to solve this equation to find R (our CAGR).
But this equation is *not* like the earlier equation we solved.
In the earlier equation, we could just rearrange the terms to solve for R.
But here, that's not possible. We need more powerful techniques.
16/
Graphing the LHS and the RHS is a good way to solve this equation.
You take R on the X-axis.
And on the Y-axis, you graph both the LHS and the RHS.
Wherever the LHS and RHS meet, that R is your CAGR.
Like so:
Graphing the LHS and the RHS is a good way to solve this equation.
You take R on the X-axis.
And on the Y-axis, you graph both the LHS and the RHS.
Wherever the LHS and RHS meet, that R is your CAGR.
Like so:

17/
There's also another way to solve the CAGR equation.
You start with a "guess" for R.
Say, R = 10%.
If R was really 10%, what would your end balance (on 2020-Jul-17) be after the compounding effect of all the deposits and withdrawals?
There's also another way to solve the CAGR equation.
You start with a "guess" for R.
Say, R = 10%.
If R was really 10%, what would your end balance (on 2020-Jul-17) be after the compounding effect of all the deposits and withdrawals?
18/
Easy. This is just your LHS evaluated at R = 10%. In this case, it works out to $32,808.
This is *lower* than your real end balance: $121,244 (the RHS).
So your CAGR has got to be better than 10%.
Easy. This is just your LHS evaluated at R = 10%. In this case, it works out to $32,808.
This is *lower* than your real end balance: $121,244 (the RHS).
So your CAGR has got to be better than 10%.
19/
OK. Let's try 20% then.
Now, the LHS works out to $128,209.67.
This is *higher* than your end balance of $121,244.
So your CAGR can't possibly be as high as 20%.
That means your CAGR lies somewhere between 10% and 20%.
OK. Let's try 20% then.
Now, the LHS works out to $128,209.67.
This is *higher* than your end balance of $121,244.
So your CAGR can't possibly be as high as 20%.
That means your CAGR lies somewhere between 10% and 20%.
20/
OK. What about 15%?
Turns out the LHS for R = 15% is only about $97,534 -- also *lower* than your end balance.
So your CAGR has to be higher than 15% but lower than 20%.
Carrying on this way, you can narrow down your CAGR into a very tight range.
OK. What about 15%?
Turns out the LHS for R = 15% is only about $97,534 -- also *lower* than your end balance.
So your CAGR has to be higher than 15% but lower than 20%.
Carrying on this way, you can narrow down your CAGR into a very tight range.
21/
This is called "the bisection method" of solving the CAGR equation.
You start with a CAGR guess. At the beginning, this guess may be wide off the mark. But you keep iterating and improving upon it. Pretty soon, you're really close to the right answer.
This is called "the bisection method" of solving the CAGR equation.
You start with a CAGR guess. At the beginning, this guess may be wide off the mark. But you keep iterating and improving upon it. Pretty soon, you're really close to the right answer.
22/
Here's the bisection method in action for this particular example. As you can see, bisection finds the same answer as the graphical method (CAGR = 18.94%), but with much higher precision.
Here's the bisection method in action for this particular example. As you can see, bisection finds the same answer as the graphical method (CAGR = 18.94%), but with much higher precision.

23/
Dividends can complicate the picture a little. But don't worry: the principle is the same.
Just treat each dividend as a cash inflow on its pay date. Add these inflows to the cash flow timeline. Then use the same procedure (graphical or bisection) to calculate CAGR.
Dividends can complicate the picture a little. But don't worry: the principle is the same.
Just treat each dividend as a cash inflow on its pay date. Add these inflows to the cash flow timeline. Then use the same procedure (graphical or bisection) to calculate CAGR.
24/
Here's a picture summarizing the 3 steps of a CAGR calculation:
1) Prepare a cash flow timeline,
2) Write down the CAGR equation, and
3) Solve this equation either graphically or via bisection.
Here's a picture summarizing the 3 steps of a CAGR calculation:
1) Prepare a cash flow timeline,
2) Write down the CAGR equation, and
3) Solve this equation either graphically or via bisection.

25/
CAGR is a key metric we investors use to judge the performance of individual investments, portfolios, funds, and even fellow investors.
It's super important to know how to calculate CAGRs correctly. I hope this thread helps.
Thanks for reading. Enjoy your weekend!
/End
CAGR is a key metric we investors use to judge the performance of individual investments, portfolios, funds, and even fellow investors.
It's super important to know how to calculate CAGRs correctly. I hope this thread helps.
Thanks for reading. Enjoy your weekend!
/End
• • •
Missing some Tweet in this thread? You can try to
force a refresh