
I've made a major update to covid19-projections.com that tries to better account for the increase in cases and the resulting lag in reported deaths.
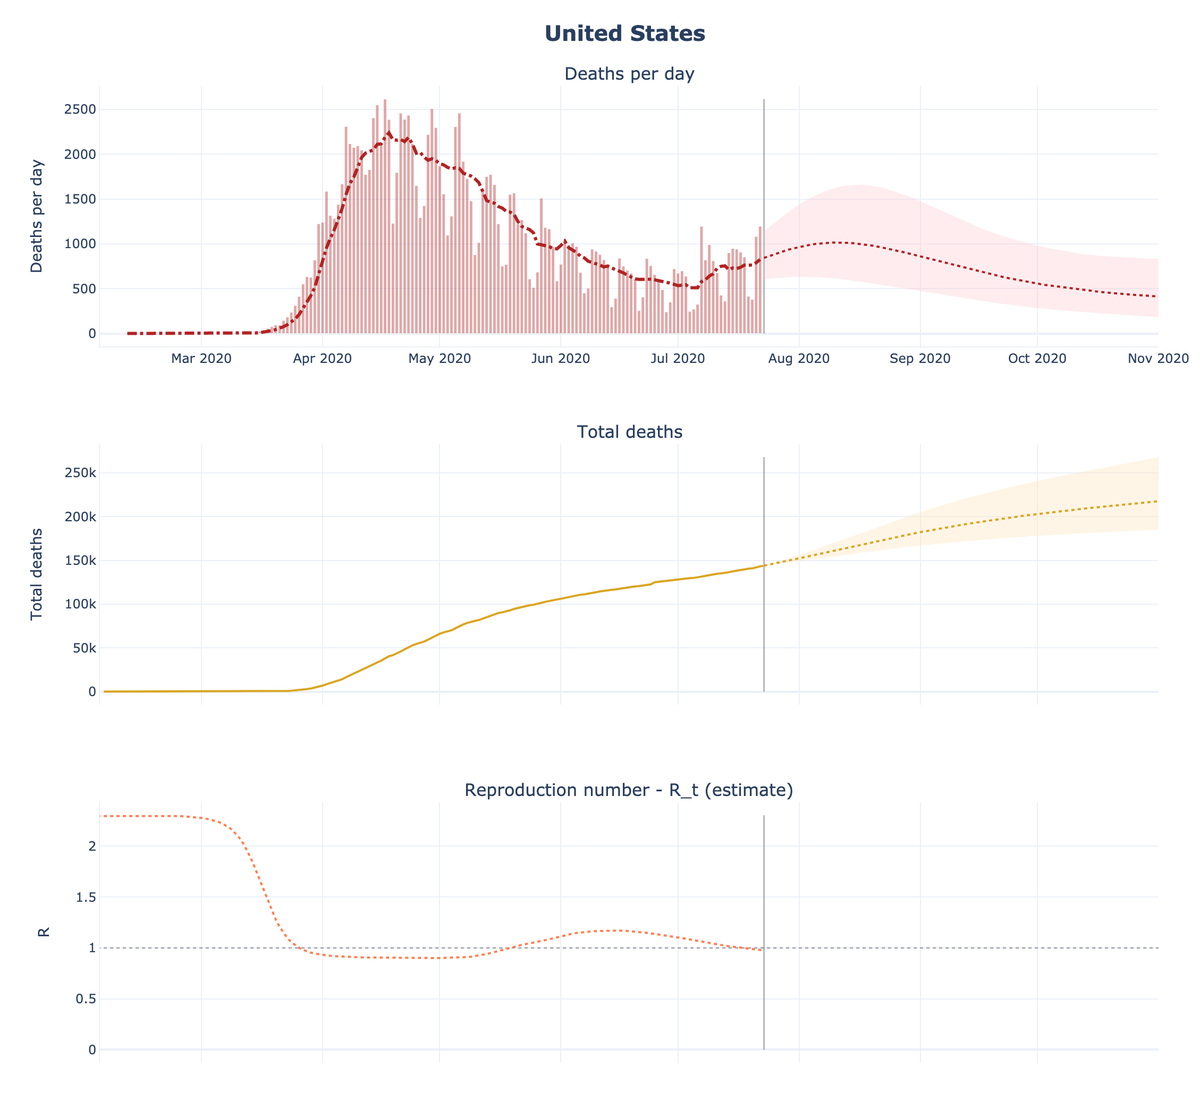
I believe new infections have likely peaked, and deaths will likely peak within the next 1-3 weeks.
I believe new infections have likely peaked, and deaths will likely peak within the next 1-3 weeks.
In this update, I decided to model this current wave the same way I modeled the first wave, by independently learning the reopening infection rate (R_t).
The previous method assumed a 0-30% increase in the infection rate for reopening, which is no longer realistic for the US.
The previous method assumed a 0-30% increase in the infection rate for reopening, which is no longer realistic for the US.
This change enabled the model to better capture the current dynamics with regards to the reproduction number (R_t).
For example, R_t went from ~0.9 -> ~1.4 in Florida/Arizona/Texas.
An even bigger change is 0.7 -> 1.6 in Idaho.
For example, R_t went from ~0.9 -> ~1.4 in Florida/Arizona/Texas.
An even bigger change is 0.7 -> 1.6 in Idaho.
Another change I made is by adding a layer that maps when a death occurred to when it is reported. The model then trains on reported deaths.
This adds an additional lag between when an infection occurred and when a death is reported to our data source, Johns Hopkins CSSE.
This adds an additional lag between when an infection occurred and when a death is reported to our data source, Johns Hopkins CSSE.
So using these new assumptions, I believe the average time span between when a person is exposed to a virus to when a death is reported is around 4 weeks.
So if deaths are peaking today, that means that the peak of the infections was likely a month ago.
So if deaths are peaking today, that means that the peak of the infections was likely a month ago.
As a result, I believe the R_t for states such as Florida/Arizona/Texas likely went above 1 in early/mid-May. This is right around the time these states reopened.
But by the time the increase in reported cases became apparent in June, the R_t was already at its peak.
But by the time the increase in reported cases became apparent in June, the R_t was already at its peak.
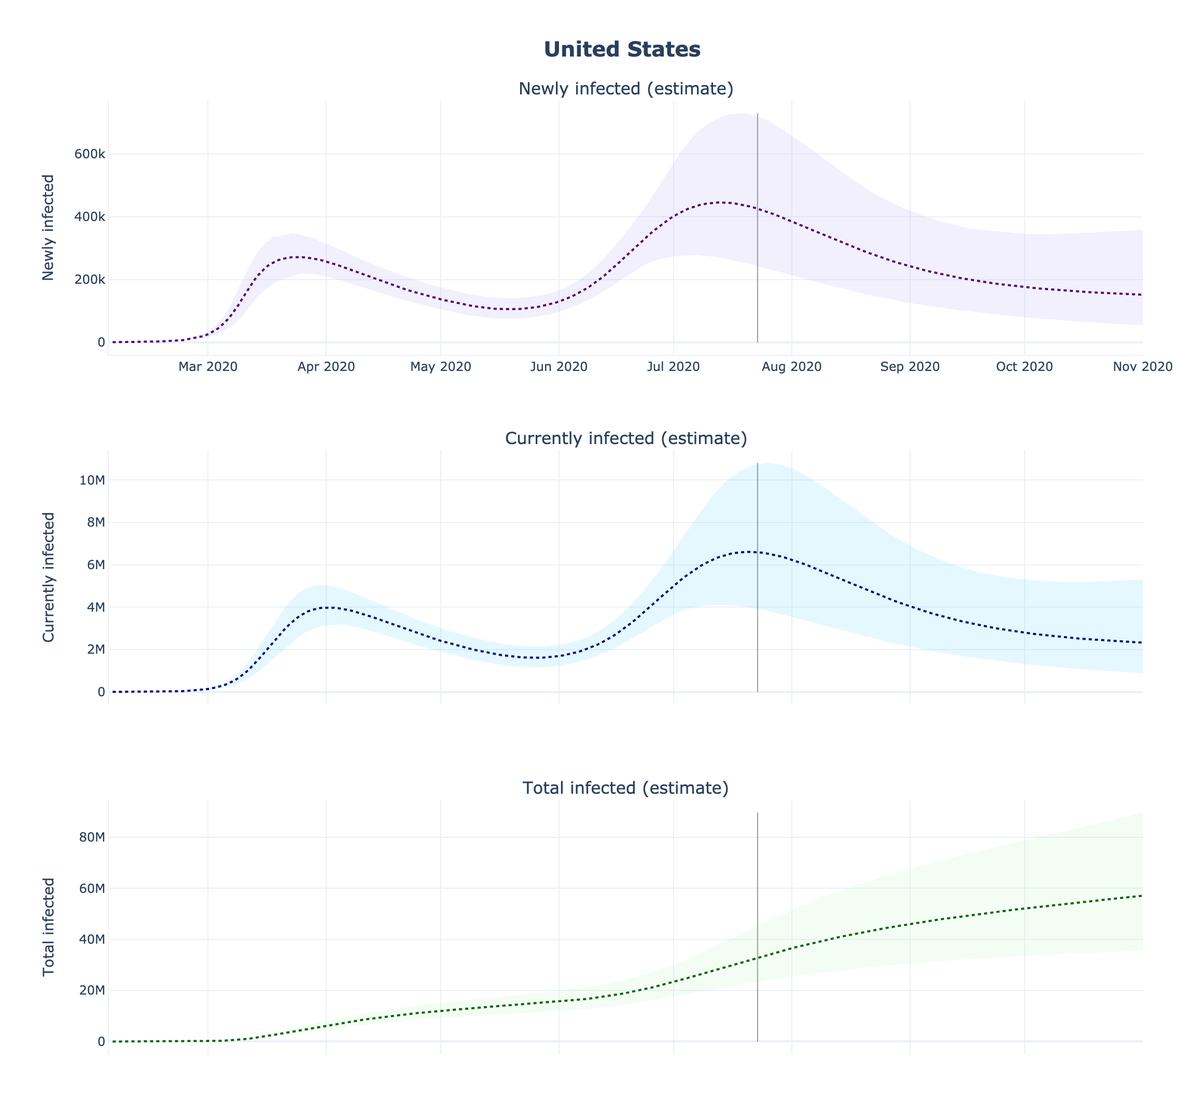
There's still a lot of debate on this one, but I use a 0.2-0.4% IFR for current infections. I estimate true infections to be ~5-8x reported cases. A higher IFR would imply a higher detection rate.
The exact IFR value does not significantly affect our death forecasts.
The exact IFR value does not significantly affect our death forecasts.
For those that are curious about the technical details behind the recent changes, you can follow the commits on GitHub:
github.com/youyanggu/yyg-…
The simulator is very easy to use: you can set up your own simulation using our latest parameters in under 5 minutes.
github.com/youyanggu/yyg-…
The simulator is very easy to use: you can set up your own simulation using our latest parameters in under 5 minutes.
The final note I want to say is that these projections will change, sometimes by a lot. No model is perfect. It's easy to look at some charts and say that deaths will go one way, but difficult for a model to learn the entire course of the pandemic.
So thanks for being patient.
So thanks for being patient.


