
1/ For the past one year I've been working on identifying coordinated inauthentic behavior exhibited by FB pages posting content about Kashmir specifically & India in general. Data has been generated from 103 FB pages. The timeline analyzed is from July 1, 2019 to August 3, 2020 

2/ The total likes for these pages as on August 3, 2020 is approx. 5.49 million with an estimated growth rate of +135.82%. None of these pages have run any ads since their creation. In July 2019 the total page likes were around 2.33 million. After the revocation of Article 370...

3/ ...in Kashmir, there was a spike in page likes taking the no. to 2.70 million with growth rate of 16.14% in August 2019. Sept. & Oct. saw a gradual increase in likes. Nov-19, Dec-19, Jan-20 & Feb-20 saw a minimal increase in the likes, which started increasing drastically from
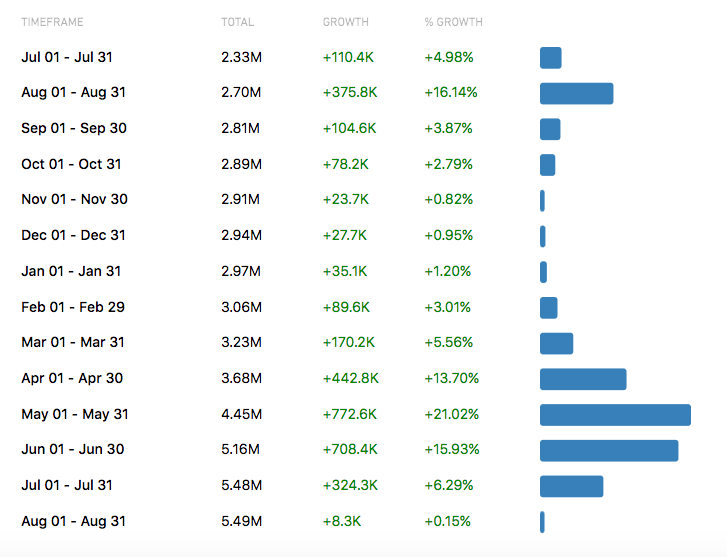
4/ the month of March 2020 with May 2020 seeing the highest jump in no. of page like which was close to 772.6k with a growth rate of +21.02%.
5/ The total number of posts stands at around 146.5K with an average monthly post count of 9,828.
In March 2020 there was a spike of content being posted with June 2020 being the peak. A lot of disinformation around Covid-19 was posted during this time.
In March 2020 there was a spike of content being posted with June 2020 being the peak. A lot of disinformation around Covid-19 was posted during this time.

6/ The graph on the left shows the average interaction rate by page followers and on the right, the graph shows the average interaction per post. There's a decline in both interactions as compared to August 2019.


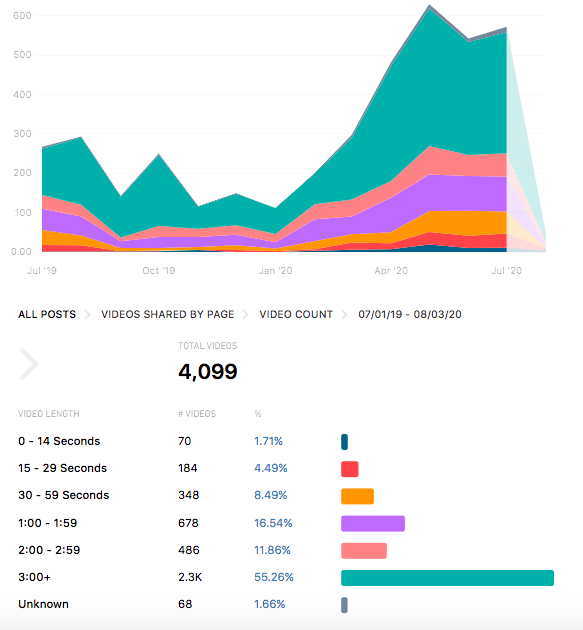
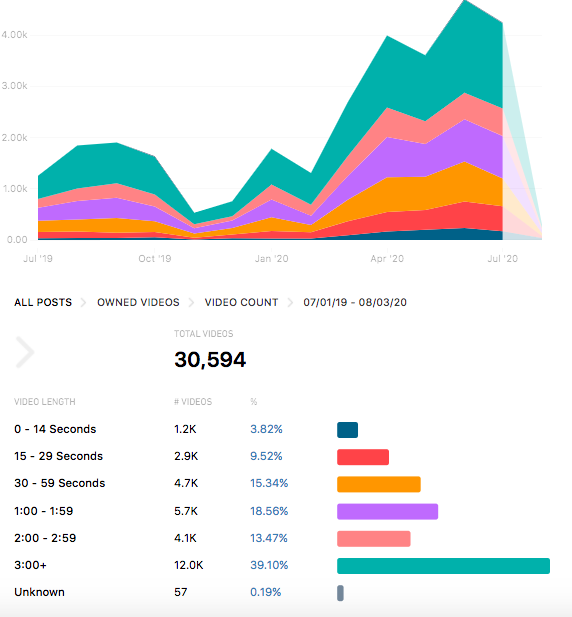
7/ Videos uploaded by these pages stand at 4,099 (left graph) while videos shared by the pages stand at 30,594 (right graph) with a sudden spike seen March 2020 onward with content being posted about Covid-19 and Indo-China border issues.
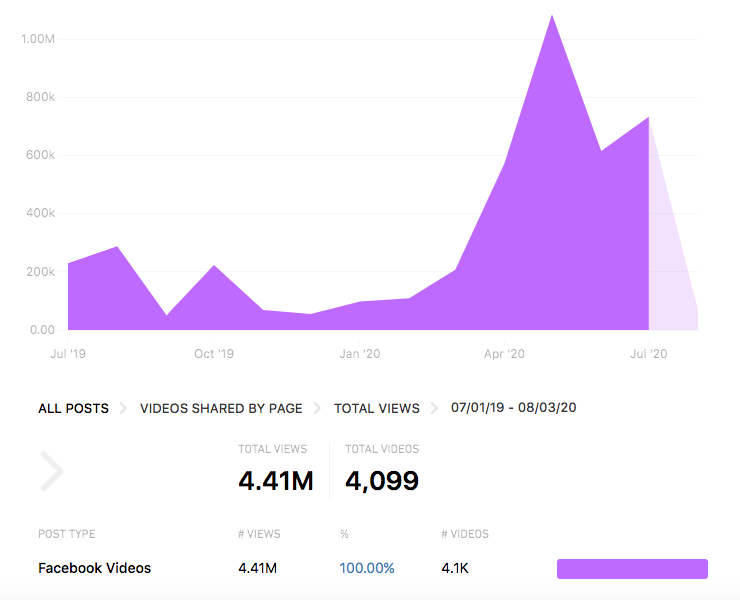
8/ Total views generated from FB video and FB live by these pages stand at around 448.06 million and views generated through the videos shared by these pages is around 4.41 million. Again there's a spike around August 2019 which again picks up from March 2020.

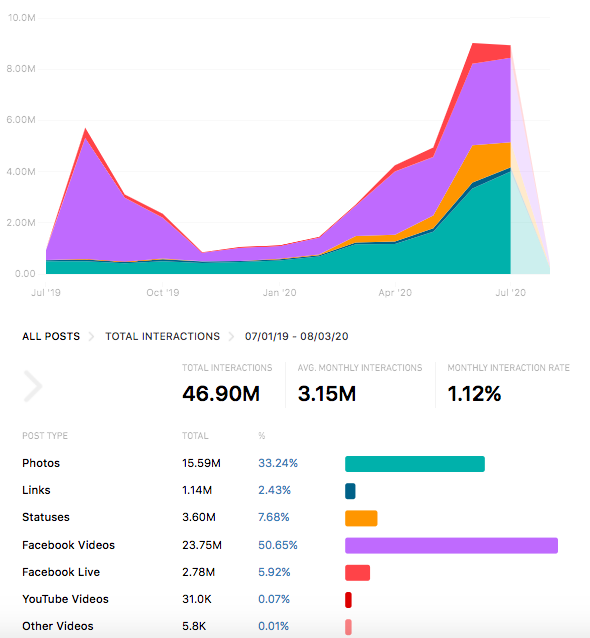
9/ Total interaction with the post uploaded by the pages stand at 46.90 million (left graph) with a break-up of the interaction shown in the graph on right. There's a spike around August 2019 which again picks up from March 2020.

10/ Out of the pages whose data I've used, 70% of them are operated from outside of India. 40% of the pages have been created in last six months with an average page like of +50k. Around 60% of these pages have categorized themselves under News&Media.

