1/
Get a cup of coffee.
In this thread, I'll show you how to do a Reverse DCF analysis.
For those unfamiliar, DCF = Discounted Cash Flow.
Get a cup of coffee.
In this thread, I'll show you how to do a Reverse DCF analysis.
For those unfamiliar, DCF = Discounted Cash Flow.
2/
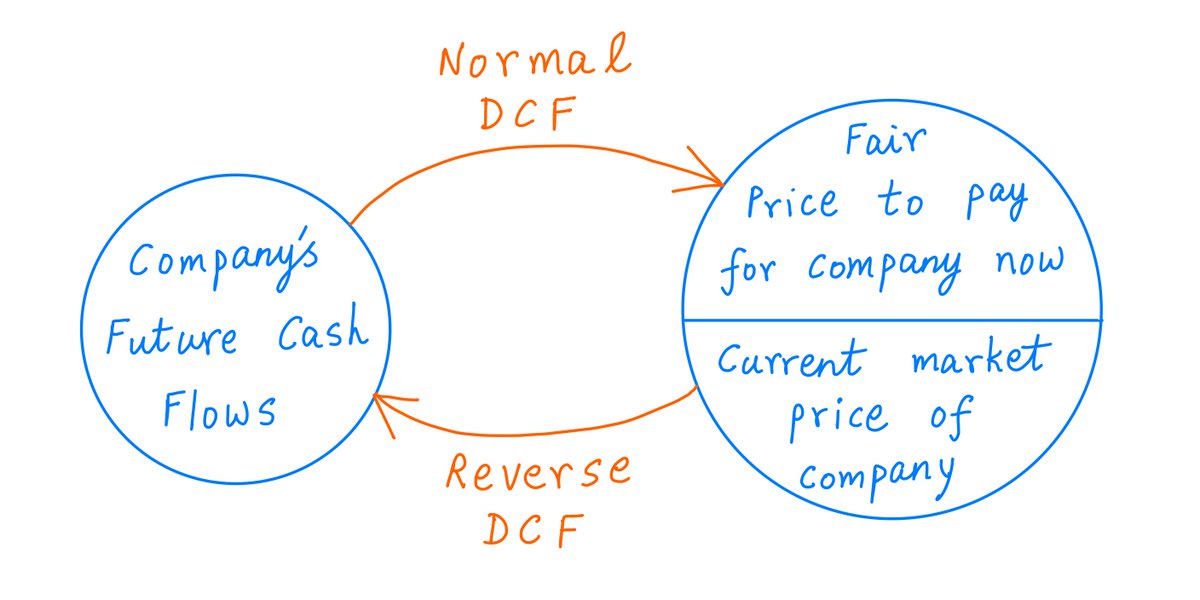
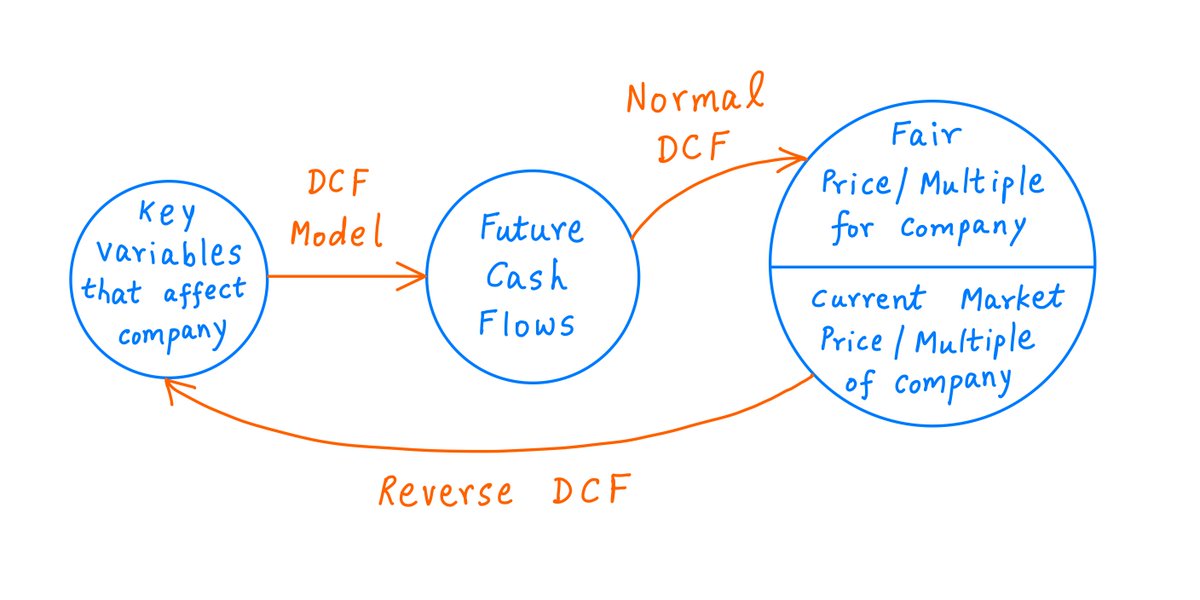
Let's start with how a Reverse DCF differs from a normal DCF.
In a normal DCF, we estimate a company's future cash flows. Then we use these cash flows to calculate a fair price to pay for the company.
For details, please see my thread from last week:
Let's start with how a Reverse DCF differs from a normal DCF.
In a normal DCF, we estimate a company's future cash flows. Then we use these cash flows to calculate a fair price to pay for the company.
For details, please see my thread from last week:
https://x.com/10kdiver/status/1292130833273257984
3/
In a Reverse DCF, we *invert* this process.
We start with the current market price of the company.
Then we figure out what future cash flows would justify this market price.
That is, what assumptions about the company's future are embedded in its current price?
In a Reverse DCF, we *invert* this process.
We start with the current market price of the company.
Then we figure out what future cash flows would justify this market price.
That is, what assumptions about the company's future are embedded in its current price?
4/
Here's a simple model for a company's cash flows.
Each year, the company earns some money.
And each year, a fraction of these earnings (I%) is reinvested back into the company -- to grow its earnings in the future.
The return (ROIIC) on such reinvestments is R% per year.
Here's a simple model for a company's cash flows.
Each year, the company earns some money.
And each year, a fraction of these earnings (I%) is reinvested back into the company -- to grow its earnings in the future.
The return (ROIIC) on such reinvestments is R% per year.
5/
Also, each year, the earnings not reinvested are distributed as dividends to the company's owners.
This continues for 15 years.
In the 16'th year and beyond, reinvestment opportunities dry up. All earnings are distributed as dividends, and growth stops.
Also, each year, the earnings not reinvested are distributed as dividends to the company's owners.
This continues for 15 years.
In the 16'th year and beyond, reinvestment opportunities dry up. All earnings are distributed as dividends, and growth stops.
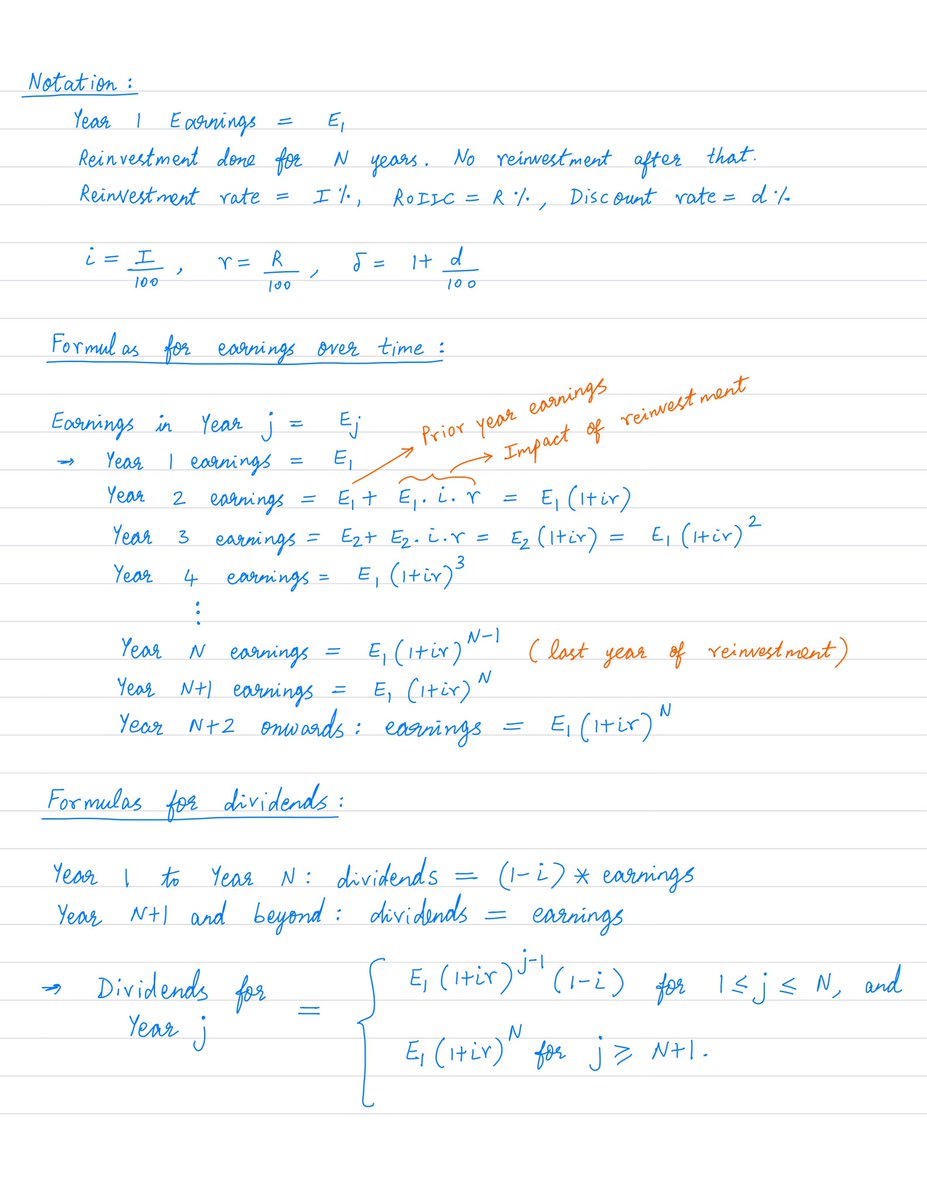
6/
Under this model, here's how the company's earnings, dividends, and reinvestments will look over time:
Under this model, here's how the company's earnings, dividends, and reinvestments will look over time:

7/
And of course, the fair value of the company will be the sum of the present values of all the dividends.
An appropriate discount rate (d% per year) should be chosen for these present value calculations.
And of course, the fair value of the company will be the sum of the present values of all the dividends.
An appropriate discount rate (d% per year) should be chosen for these present value calculations.
8/
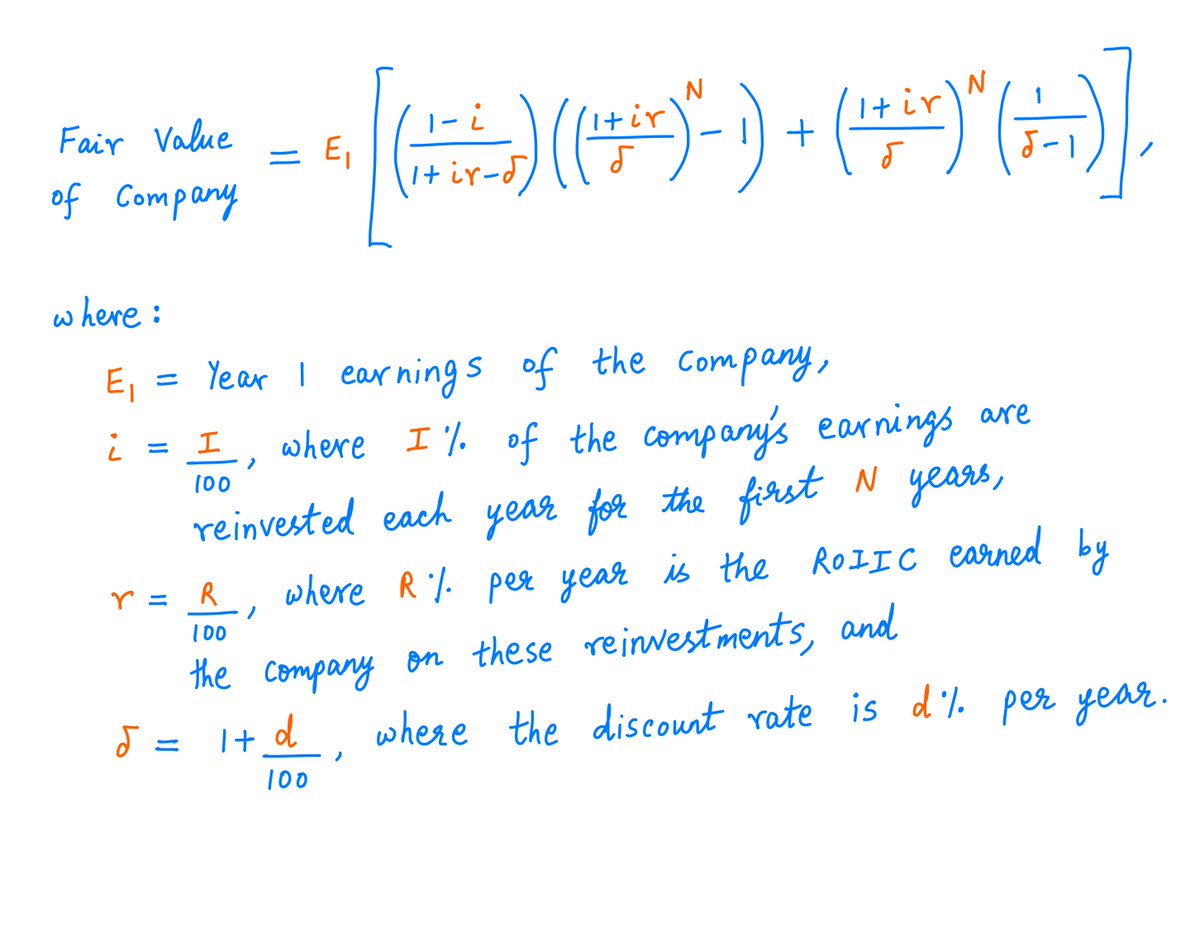
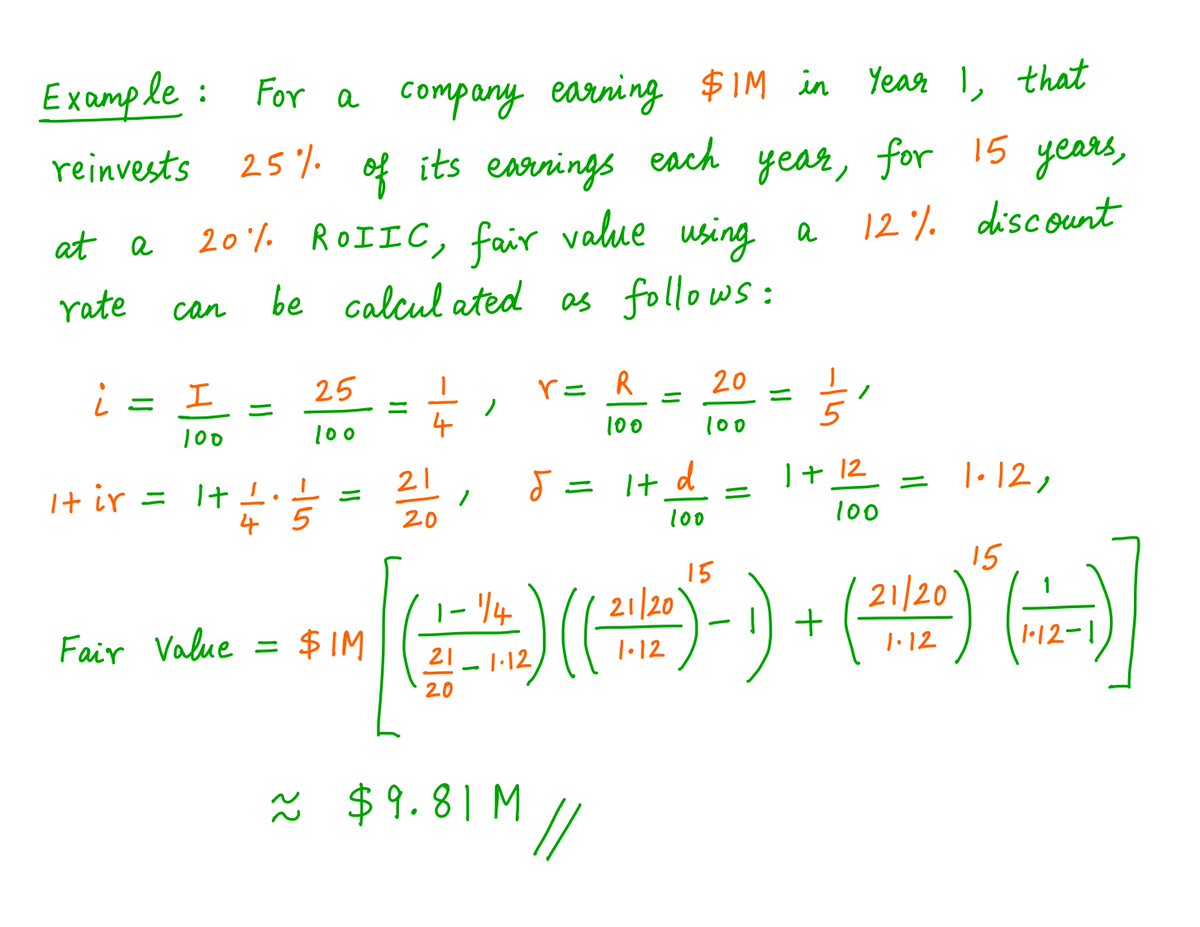
Here's a formula for the fair value of a company under this model, along with an example showing how to apply the formula to calculate fair value:
Here's a formula for the fair value of a company under this model, along with an example showing how to apply the formula to calculate fair value:
9/
If we want a fair "earnings multiple" instead, we just divide the company's fair value by its Year 1 earnings.
In the example above, the formula gave us a fair value of ~$9.81M for a company earning $1M in Year 1. So, for this company, a fair earnings multiple would be 9.81.
If we want a fair "earnings multiple" instead, we just divide the company's fair value by its Year 1 earnings.
In the example above, the formula gave us a fair value of ~$9.81M for a company earning $1M in Year 1. So, for this company, a fair earnings multiple would be 9.81.
10/
All of this is just a normal DCF.
For a 15-year reinvestment horizon, the fair earnings multiple calculated by this DCF depends on just 3 parameters:
(1) The reinvestment rate (I%),
(2) The ROIIC (R% per year), and
(3) The discount rate (d% per year).
All of this is just a normal DCF.
For a 15-year reinvestment horizon, the fair earnings multiple calculated by this DCF depends on just 3 parameters:
(1) The reinvestment rate (I%),
(2) The ROIIC (R% per year), and
(3) The discount rate (d% per year).
11/
A Reverse DCF means *inverting* this.
That is, we take the current earnings multiple of our company.
Then we try to find plausible values for these 3 parameters that will give us exactly this multiple -- when run through a normal DCF.
A Reverse DCF means *inverting* this.
That is, we take the current earnings multiple of our company.
Then we try to find plausible values for these 3 parameters that will give us exactly this multiple -- when run through a normal DCF.
12/
Let's take an example.
Suppose our company is trading at 25 times earnings.
And suppose our discount rate is 10% per year.
If the company will reinvest 50% of its earnings each year over the next 15 years, what ROIIC should it earn to justify this 25 earnings multiple?
Let's take an example.
Suppose our company is trading at 25 times earnings.
And suppose our discount rate is 10% per year.
If the company will reinvest 50% of its earnings each year over the next 15 years, what ROIIC should it earn to justify this 25 earnings multiple?
13/
Suppose the company earns 10% ROIIC. Then, the fair multiple for it (calculated via DCF) works out to just 10 -- a far cry from 25.
If we increase the ROIIC to 20%, the fair multiple increases to 16.82. Still, not at 25.
Suppose the company earns 10% ROIIC. Then, the fair multiple for it (calculated via DCF) works out to just 10 -- a far cry from 25.
If we increase the ROIIC to 20%, the fair multiple increases to 16.82. Still, not at 25.
14/
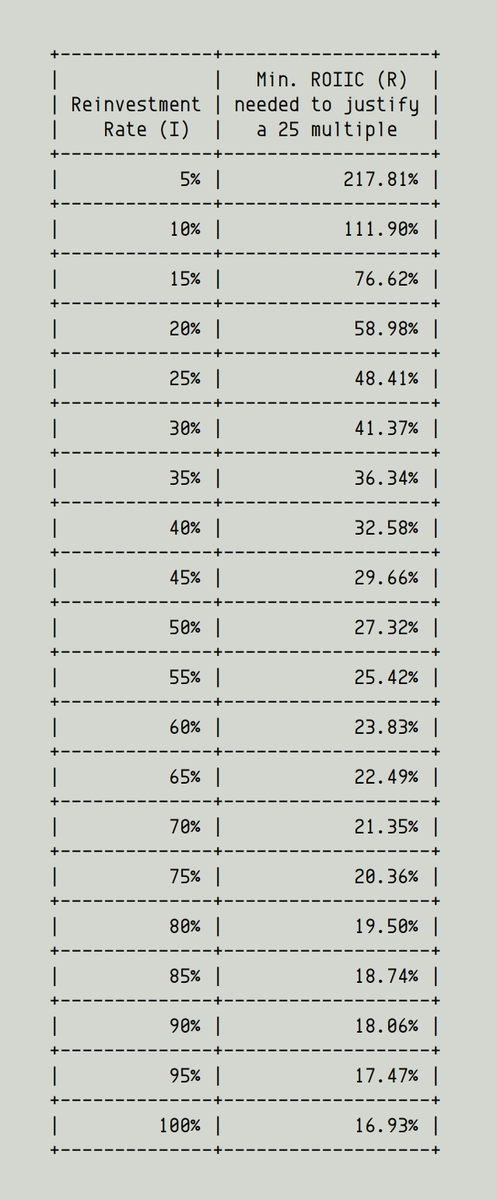
By trial and error, we find that a 27.32% ROIIC is needed to justify a 25 multiple.
But this assumes that the company reinvests only 50% of its earnings.
What if it reinvested, say, 75% of its earnings? Then, it turns out, a 20.35% ROIIC is enough to justify a 25 multiple.
By trial and error, we find that a 27.32% ROIIC is needed to justify a 25 multiple.
But this assumes that the company reinvests only 50% of its earnings.
What if it reinvested, say, 75% of its earnings? Then, it turns out, a 20.35% ROIIC is enough to justify a 25 multiple.
15/
Thus, there are many combinations of ROIIC (R) and reinvestment rate (I) that justify a 25 multiple.
There's a trade-off. As reinvestment increases (ie, owners are willing to defer more of their dividends), the ROIIC required to justify a given multiple decreases. Table:
Thus, there are many combinations of ROIIC (R) and reinvestment rate (I) that justify a 25 multiple.
There's a trade-off. As reinvestment increases (ie, owners are willing to defer more of their dividends), the ROIIC required to justify a given multiple decreases. Table:
16/
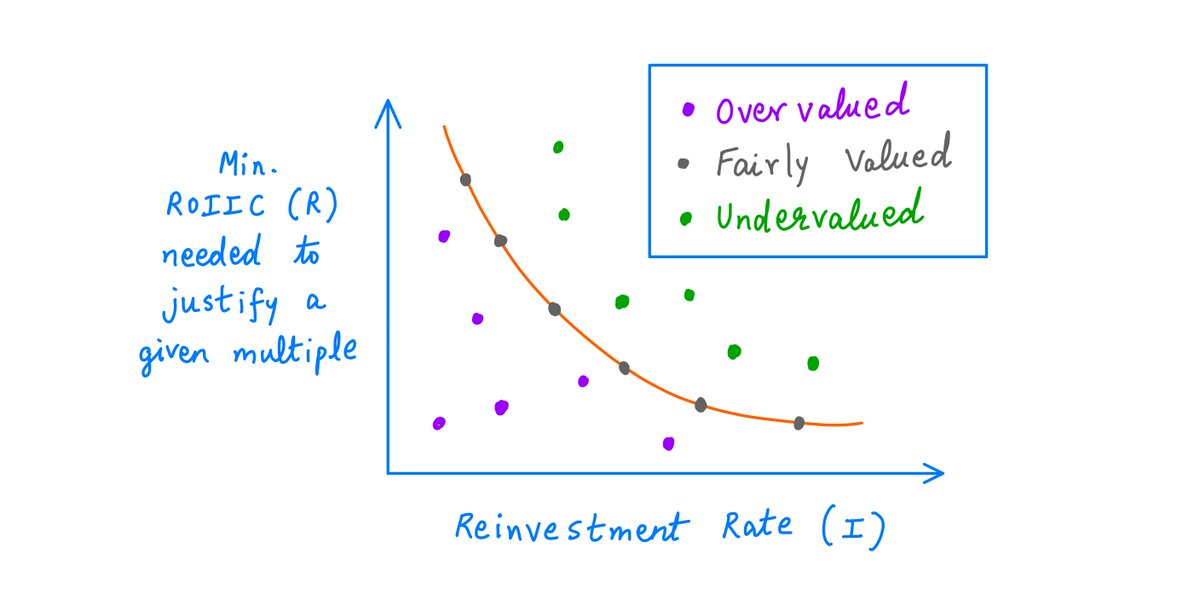
The orange curve in the picture below shows all combinations of I and R that "work": they all justify the current market multiple.
"Reverse DCF" essentially means "an analysis that takes the current market multiple as input and produces this orange curve as output".
The orange curve in the picture below shows all combinations of I and R that "work": they all justify the current market multiple.
"Reverse DCF" essentially means "an analysis that takes the current market multiple as input and produces this orange curve as output".
17/
The orange curve shows the expectations embedded in the current price.
If, in future, our company puts up numbers to the *right* of the orange curve (the green points), then future performance *exceeds* current expectations.
Meaning, the company is currently *undervalued*.
The orange curve shows the expectations embedded in the current price.
If, in future, our company puts up numbers to the *right* of the orange curve (the green points), then future performance *exceeds* current expectations.
Meaning, the company is currently *undervalued*.
18/
But if our company is only able to achieve I and R to the *left* of the orange curve (the purple points), it means the company's actual performance falls short of the expectations embedded in the current price.
That is, the company is *overvalued* at the current price.
But if our company is only able to achieve I and R to the *left* of the orange curve (the purple points), it means the company's actual performance falls short of the expectations embedded in the current price.
That is, the company is *overvalued* at the current price.
19/
Key lesson: Reverse DCFs *invert* normal DCFs. They find all possible combinations of normal DCF parameters that justify current market prices/multiples.
Thus, Reverse DCFs can tell you what expectations of future performance are embedded in current prices.
Key lesson: Reverse DCFs *invert* normal DCFs. They find all possible combinations of normal DCF parameters that justify current market prices/multiples.
Thus, Reverse DCFs can tell you what expectations of future performance are embedded in current prices.
20/
And if your due diligence and research tell you -- with high certainty -- that the expectations embedded in current prices are too low (too high), you may be able to profit by buying (shorting) the company when it's undervalued (overvalued).
And if your due diligence and research tell you -- with high certainty -- that the expectations embedded in current prices are too low (too high), you may be able to profit by buying (shorting) the company when it's undervalued (overvalued).
21/
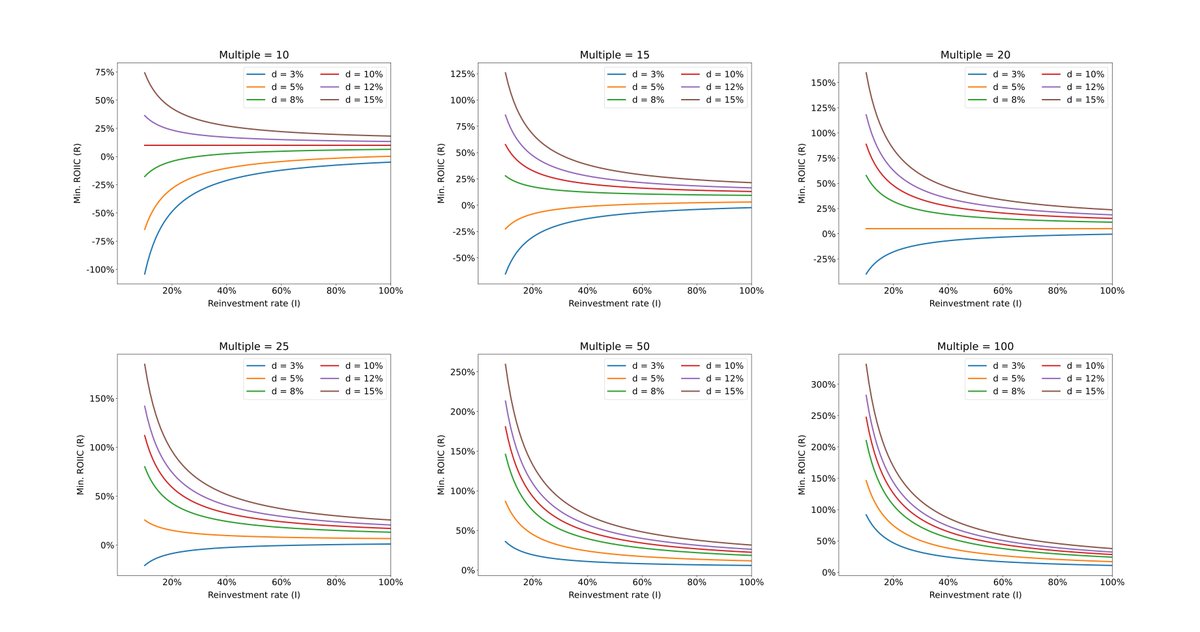
The plots below show the "R vs I" curves produced by Reverse DCFs for various multiples and discount rates.
As the discount rate increases, you can see that the curve shifts to the right and up. That is, better future performance is necessary to justify the same multiple.
The plots below show the "R vs I" curves produced by Reverse DCFs for various multiples and discount rates.
As the discount rate increases, you can see that the curve shifts to the right and up. That is, better future performance is necessary to justify the same multiple.
22/
So far, what I've described is a *generic* Reverse DCF.
There's also *company specific* Reverse DCFs.
The idea here is that most companies have a few key variables that affect their cash flows. You first have to identify these key variables.
So far, what I've described is a *generic* Reverse DCF.
There's also *company specific* Reverse DCFs.
The idea here is that most companies have a few key variables that affect their cash flows. You first have to identify these key variables.
23/
For Apple, key variables may be how many iPhones they sell, how fast their services revenue grows, etc.
For Starbucks, key variables may be how many new stores they open in China, the operating margins of these stores, same store sales growth in the US and China, etc.
For Apple, key variables may be how many iPhones they sell, how fast their services revenue grows, etc.
For Starbucks, key variables may be how many new stores they open in China, the operating margins of these stores, same store sales growth in the US and China, etc.
24/
Having identified these key variables, you build a DCF model whose parameters are these variables.
The DCF model essentially converts these variables into cash flows.
Reverse DCF analysis can then tell you what the market expects these key variables to be in the future:
Having identified these key variables, you build a DCF model whose parameters are these variables.
The DCF model essentially converts these variables into cash flows.
Reverse DCF analysis can then tell you what the market expects these key variables to be in the future:
25/
That's all I have for you today. I hope it was useful.
Thanks for reading. Enjoy your weekend. And remember Munger's mantra: Invert, always invert.
/End
That's all I have for you today. I hope it was useful.
Thanks for reading. Enjoy your weekend. And remember Munger's mantra: Invert, always invert.
/End
A1/
Several people have contacted me asking how I derived the fair value formula in tweet 8 above.
Hence this “appendix tweet” with the math. See pics.
( Don’t worry if you don’t understand the math. Just continue using the formula. I promise it’s correct. 😀 )
Several people have contacted me asking how I derived the fair value formula in tweet 8 above.
Hence this “appendix tweet” with the math. See pics.
( Don’t worry if you don’t understand the math. Just continue using the formula. I promise it’s correct. 😀 )

• • •
Missing some Tweet in this thread? You can try to
force a refresh