Marc Bevand Profile picture
Sep 5, 2020 10 tweets 4 min read Read on X
Beware of this claim:

«A US resident in a Long-Term Care Facility (LTCF) has a median length of stay (LOS) of 5 months until death, so if they die of COVID-19 it's no big deal»

It's false.

1/n
First the definition of LTCF varies by state, but usually is "nursing facilities, assisted living facilities, adult care centers, intermediate care facilities, and/or other long-term care facilities", see kff.org/health-costs/i… (in Notes under Additional State-level Data)

2/n
The claim of a 5-month median LOS comes from this 2010 study: ncbi.nlm.nih.gov/pmc/articles/P…

There are 3 flaws with this claim:

Flaw #1: this study only covers nursing facilities, and excludes all other LTCF such as assisted living facilities, adult care centers, etc

3/n
Flaw #2: this study only examines the last admission (until death) in a nursing home. That's why the "at the end of life" terminology is repeated in many places.

4/n Image
In other words a resident may be admitted into a nursing home, stay for a while, return home, and years later is re-admitted, until his death.

Only the second stay ("at the end of life") would be included in the statistics of this study.

5/n
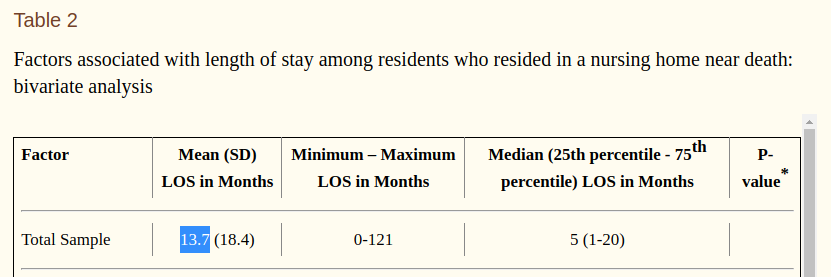
Flaw #3: the median is 5 months, but the mean is 13.7 months (see table 2). If the goal is to quantify the amount of life (persons × years) potentially lost to COVID-19, the mean is what we should be looking at, not the median.

6/n Image
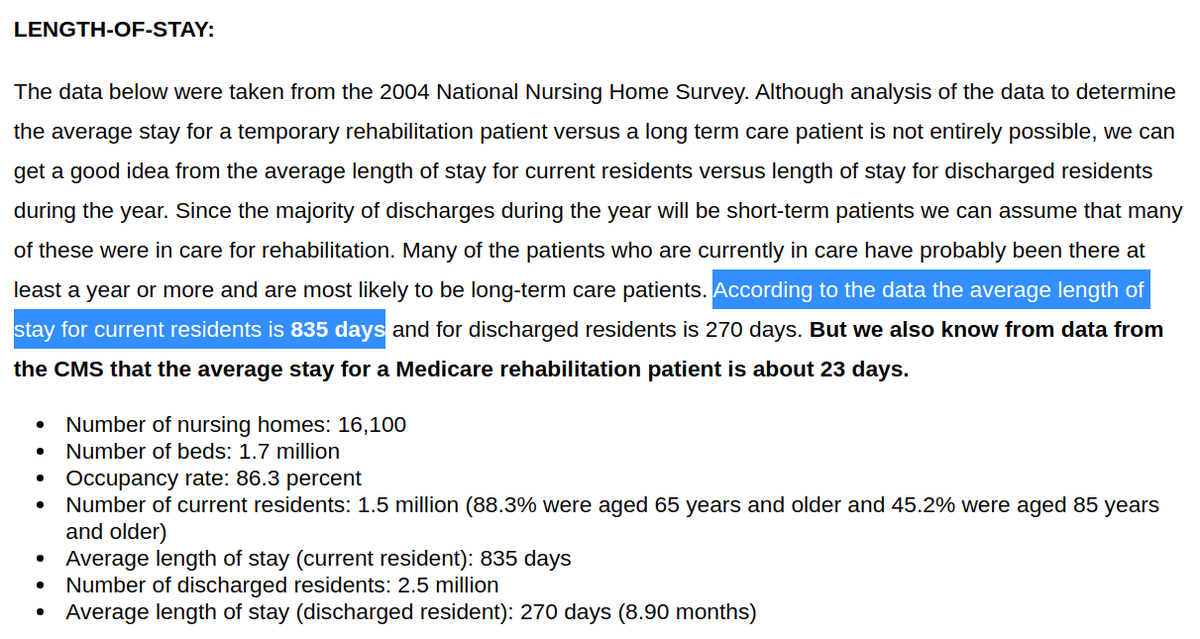
More accurate studies on the mean LOS in nursing homes (not necessarily the LOS "at the end of life") show it is around 27 months (eg. longtermcarelink.net/eldercare/nurs… claims 835 days)

7/n Image
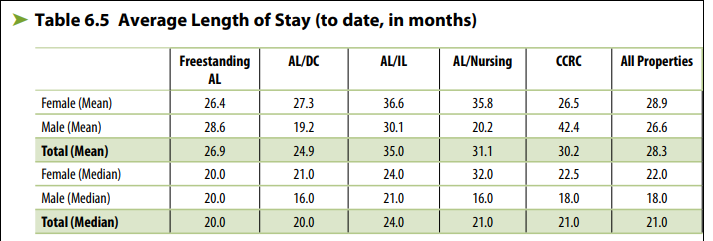
Another study found that on all LTCF (not only nursing homes), the mean LOS was 28.3 months (web.archive.org/web/2019040621…)

8/n Image
And the end of the stay does not necessarily conclude with death: only 33.1% of discharges are due to death, see table 6.15.

9/n Image
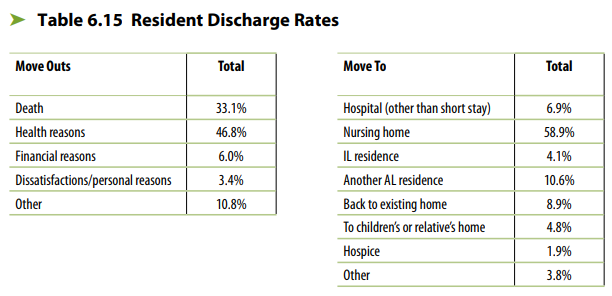
So only 1 in 3 LTCF residents die after a mean stay of around 27-28 months.

This implies the average life expectancy of an LTCF resident, at the time of admission in the facility, is greater than 27-28 months.

10/n

• • •

Missing some Tweet in this thread? You can try to force a refresh
 

Keep Current with Marc Bevand

Marc Bevand Profile picture

Stay in touch and get notified when new unrolls are available from this author!

Read all threads

This Thread may be Removed Anytime!

PDF

Twitter may remove this content at anytime! Save it as PDF for later use!

Try unrolling a thread yourself!

how to unroll video
  1. Follow @ThreadReaderApp to mention us!

  2. From a Twitter thread mention us with a keyword "unroll"
@threadreaderapp unroll

Practice here first or read more on our help page!

More from @zorinaq

May 3, 2022
Alex Berenson argues in alexberenson.substack.com/p/one-covid-ch… that Sweden had the best Covid strategy

Let's point out numerous obvious flaws in his analysis, shall we?

1/n
Firstly, Berenson chooses to ignore Asian countries. Why? Because geography is "the most important factor in how hard Covid hits a country"

In other words: "countries who did better than Sweden don't count, because, well, I sAy So"

Such well-reasoned logic. Much wow 🤣

2/n
Secondly, he claims geography is the most important factor, but IGNORES ALL the countries geographically close to Sweden: Finland, Norway, Denmark (none of them are charted)

This self-inconsistency is 100% expected from The Pandemic’s Wrongest Man
theatlantic.com/ideas/archive/…

3/n
Read 9 tweets
Mar 8, 2022
I modeled excess deaths per capita by age group, for each US state, since the beginning of the pandemic.

I believe this is the first time an analysis of this type has been done BY AGE GROUP for each state. This removes the need to do "age-adjustment" to compare states.

1/n
Methodology, data, and source code are available on GitHub: github.com/mbevand/excess…

The raw numerical output, with excess deaths per age group are in this CSV file: github.com/mbevand/excess…

Charts follow:

2/n
Excess deaths per capita for ages 85+

3/n
Read 13 tweets
Mar 1, 2022
Mask usage correlates with lower deaths

Based on NYT's mask survey across United States counties, plot deaths/capita recorded during the survey & up to 30 days later, along with each county's mask wearing score

Result:
Linear regression (Y log-transformed) R²=0.144 in red:
There are hundreds of factors affecting the dependent variable (deaths). Ignoring ALL of these factors, looking at mask usage only, and still finding R²=0.144 is pretty cool/unexpected

Confounders abound!: people who wear masks often are likely doing more social-distancing. Etc.
Methodology behind the chart:

Two data sources:
- mask wearing survey github.com/nytimes/covid-…
- COVID deaths (and population) by US county as per JHU CSSE
Read 6 tweets
Feb 8, 2022
A little thread on the Great Disinformer @ianmSC

Why Real Science™ isn't done with MSPaint charts.

His charts seem to claim that nothing works. Locking down doesn't work, masking doesn't work, vaccination doesn't work, your printer doesn't wo—wait scratch that one

1/n
One iota of critical thinking is all you need to expose numerous errors in his charts:

Error #1 — Case ascertainment rate bias:

A country may detect 1 in 2 cases, while another 1 in 4. We say the case ascertainment rate is respectively 50%, and 25%.
This variance in case ascertainment rate alone is enough to put half of @ianmSC's charts where they belong: in the trash🗑️

Real Science™ looks at covid deaths—not cases—to compare the severity of the pandemic across different regions. This avoids case ascertainment rate bias.
Read 12 tweets
Feb 7, 2022
I compiled a list—as exhaustive as possible—of all peer-reviewed & published research articles that evaluate the effectiveness of nonpharmaceutical interventions, specifically lockdowns on COVID-19

➡️Papers finding NPIs effective outnumber, by 8 to 1, those finding the opposite
Criteria for inclusion in the list:

1-Be a RESEARCH ARTICLE (data, methods, results). Commentaries, opinion pieces, etc, do not qualify

2-Be PEER-REVIEWED & PUBLISHED among the 26,000 titles in Scopus

3-Be EXPLICIT. No secondhand interpretation of the data
Regarding criterion #3: the authors must explicitly state in the text whether their results suggest NPIs are effective or not

Their exact words have been peer-reviewed & published. Your interpretation of figures or data tables has not.
Read 61 tweets
Jan 24, 2022
Heads of government who have died of COVID-19

Confirmed:
1. Prime Minister of Eswatini, Ambrose Mandvulo Dlamini

Suspected:
2. President of Burundi, Pierre Nkurunziza
3. President of Tanzania, John Magufuli
4. Prime Minister of Ivory Coast, Hamed Bakayoko
1. Prime Minister of Eswatini tested positive on 15 Nov 2020, was hospitalized 8 days later, and died on 13 Dec.

bnonews.com/index.php/2020…
2. President of Burundi died on 8 June 2020. The cause of death was given officially as "cardiac arrest" by the Burundian government, but is suspected to be COVID: economist.com/middle-east-an…

His wife was flown to Kenya and hospitalized for COVID a week before his death.
Read 5 tweets

Did Thread Reader help you today?

Support us! We are indie developers!


This site is made by just two indie developers on a laptop doing marketing, support and development! Read more about the story.

Become a Premium Member ($3/month or $30/year) and get exclusive features!

Become Premium

Don't want to be a Premium member but still want to support us?

Make a small donation by buying us coffee ($5) or help with server cost ($10)

Donate via Paypal

Or Donate anonymously using crypto!

Ethereum

0xfe58350B80634f60Fa6Dc149a72b4DFbc17D341E copy

Bitcoin

3ATGMxNzCUFzxpMCHL5sWSt4DVtS8UqXpi copy

Thank you for your support!

Follow Us!

:(