
#DeepakNitrite
To all the Serious investors, I am sharing a method to calculate.
Future Stock value, based on the PE-EPS model. There are many complex models available. But, I follow a very simple method.
To all the Serious investors, I am sharing a method to calculate.
Future Stock value, based on the PE-EPS model. There are many complex models available. But, I follow a very simple method.
We know that
Stock CMP=PE*EPS.😀
In order to find the future value of the stock, we need Future PE and Future EPS. Right!!!!
So,
Future Stock Price=Future PE * Future EPS.😎
Stock CMP=PE*EPS.😀
In order to find the future value of the stock, we need Future PE and Future EPS. Right!!!!
So,
Future Stock Price=Future PE * Future EPS.😎
So, let us do it for my favorite stock
I collected the stock price monthly data from bseindia.com by clicking the following link. You can also download it from here.
bseindia.com/markets/equity…
I collected the stock price monthly data from bseindia.com by clicking the following link. You can also download it from here.
bseindia.com/markets/equity…
The Low and High of a month are selected from data. Why? this is the high and low price market experts decided in a month. 

Then, I selected quarterly wise, the high and low values of the stock.🧐

After identifying HL of monthly data, the EPS quarterly wise data, I entered manually.
screener.in
MarketSmithindia.com
From that data TTM (Trailing 12 month) EPS data calculated from each 4 qtrs by summing.
screener.in
MarketSmithindia.com
From that data TTM (Trailing 12 month) EPS data calculated from each 4 qtrs by summing.
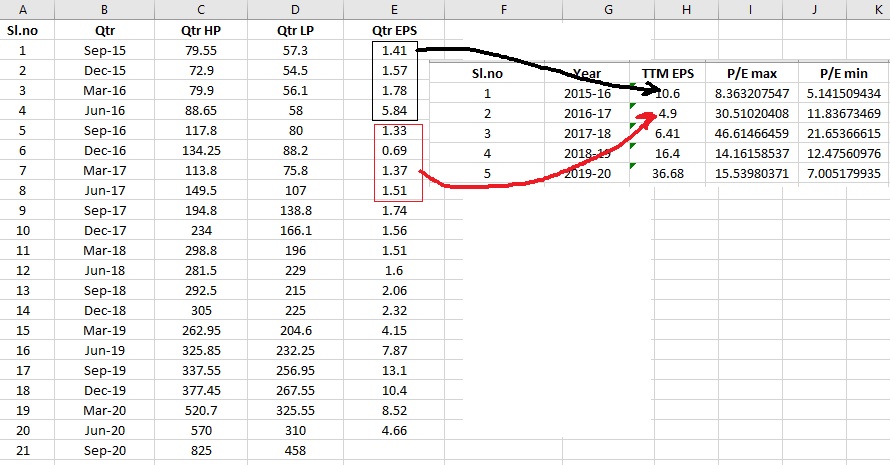
Then, the PE value can be calculated by diving the price with TTM EPS.
I Used the maximum price of a stock in a qtr and minimum price in qtr to calculate
Max PE
Min PE
Average PE
Market participants ready to pay during a Qtr.
I Used the maximum price of a stock in a qtr and minimum price in qtr to calculate
Max PE
Min PE
Average PE
Market participants ready to pay during a Qtr.

Usually, Many analysts use a growth rate (from previous Qtr or Yr) in eps to estimate future value.
But, I prefer the Average and Standard deviation of samples as it will take all the historical data into consideration.
But, I prefer the Average and Standard deviation of samples as it will take all the historical data into consideration.

As we can see, by adding average value to the standard deviation.
The Estimated EPS, Max PE, Min PE, and Avg PE are obtained.
Best Price= Estimated EPS*Max PE=26.54*36.9=979.3
Avg Price=Estimated EPS*Avg PE=26.54*26.94=715.2
Worst Price=Estimated EPS*Min PE=26.54*17.36=460.9
The Estimated EPS, Max PE, Min PE, and Avg PE are obtained.
Best Price= Estimated EPS*Max PE=26.54*36.9=979.3
Avg Price=Estimated EPS*Avg PE=26.54*26.94=715.2
Worst Price=Estimated EPS*Min PE=26.54*17.36=460.9

This is by considering the minimum expected performance and the expected behaviour of the crowd. There can always be irrational valuations and expectations from investors. Then the stock price will shoot.
Now, it is purely based on Maths.
Now, it is purely based on Maths.
If the price doesn't reach that is underperformance. This is one way to calculate the target price.
And, Technical analysis is a different ball game. I will share interesting TA details also.
And, Technical analysis is a different ball game. I will share interesting TA details also.
So, that's it,
If everything goes well, it should touch 980-1000 by Fy21.😍😍
The current stock price is close to its average performance.😉
If the performance is bad and investors react badly, it should be fairly valued at 460 zones.😡
If everything goes well, it should touch 980-1000 by Fy21.😍😍
The current stock price is close to its average performance.😉
If the performance is bad and investors react badly, it should be fairly valued at 460 zones.😡
So, the note is, there are various models available. After doing quite a bit of research, I found this to be simple and easy to understand.😀
So, Happy Investing!!!!!😇
PS: I will share much more, I believe in sharing is caring.
So, Happy Investing!!!!!😇
PS: I will share much more, I believe in sharing is caring.
I am by profession a research guy, so, I love doing research and share details. By sharing with others, I will get a different perspective. We are here to make money.
So, work hard and be confident. It is one way to develop conviction.
Cheers.
So, work hard and be confident. It is one way to develop conviction.
Cheers.
• • •
Missing some Tweet in this thread? You can try to
force a refresh


