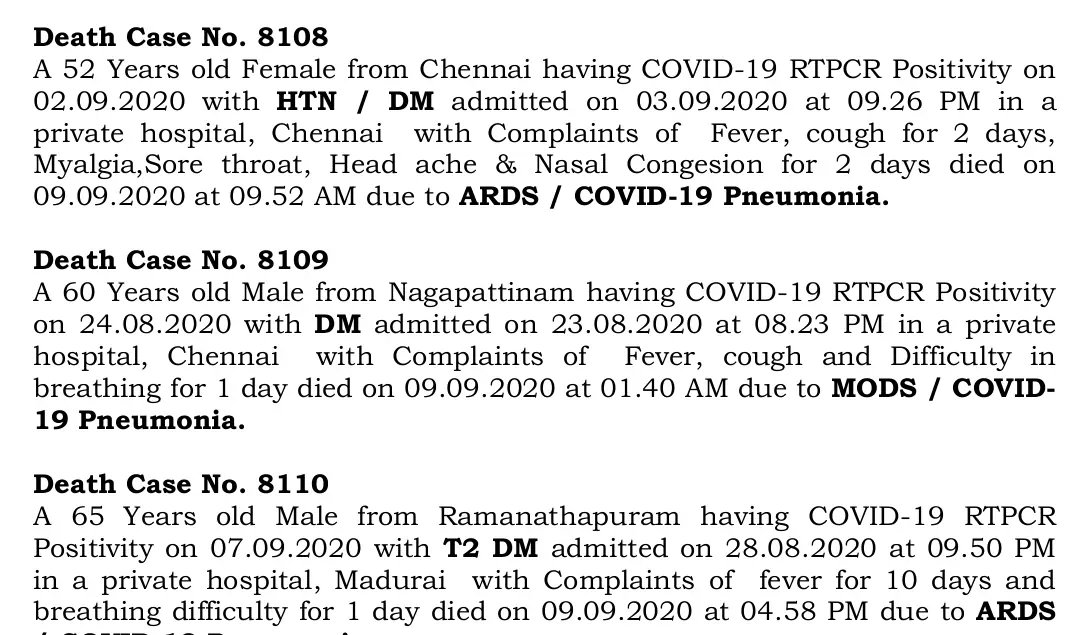
Tamil Nadu provides detailed information on its fatalities in its daily bulletin
I scraped that data (Jul-1 to Sep-10).
This thread contains a preliminary analysis, and a comparison with Karnataka/Odisha (at the end) @epigiri
I scraped that data (Jul-1 to Sep-10).
This thread contains a preliminary analysis, and a comparison with Karnataka/Odisha (at the end) @epigiri

Age-Profile
mean age: 63.1 yrs
Very clear clustering in the 60-80 yrs range
The Mean age has increased significantly from July-Sep
mean age: 63.1 yrs
Very clear clustering in the 60-80 yrs range
The Mean age has increased significantly from July-Sep


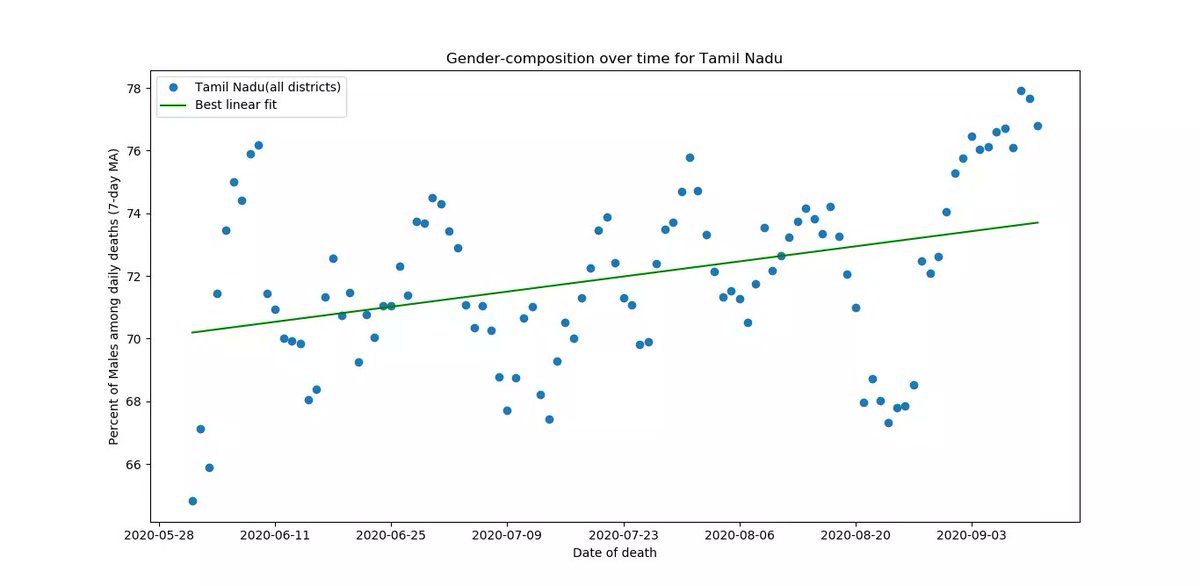
Gender-Profile
Male : 71.9%
Female: 27.6%
Fraction of Males in daily deaths has increased slowly over time
Male : 71.9%
Female: 27.6%
Fraction of Males in daily deaths has increased slowly over time
Co-Morbidiites:
63.7% of deaths had co-morbidities
36.2% of deaths had NO co-morbidities
Common ones,
Diabetes : 41%
Hypertension : 29%
Kidney disease: 6%
63.7% of deaths had co-morbidities
36.2% of deaths had NO co-morbidities
Common ones,
Diabetes : 41%
Hypertension : 29%
Kidney disease: 6%
Admission-Death interval
The time between a patient's admission to hospital and death is a measure of quality of hospital-care as well as early-detectionn
46% of TN's deaths occur within 2 days of admission
The time between a patient's admission to hospital and death is a measure of quality of hospital-care as well as early-detectionn
46% of TN's deaths occur within 2 days of admission
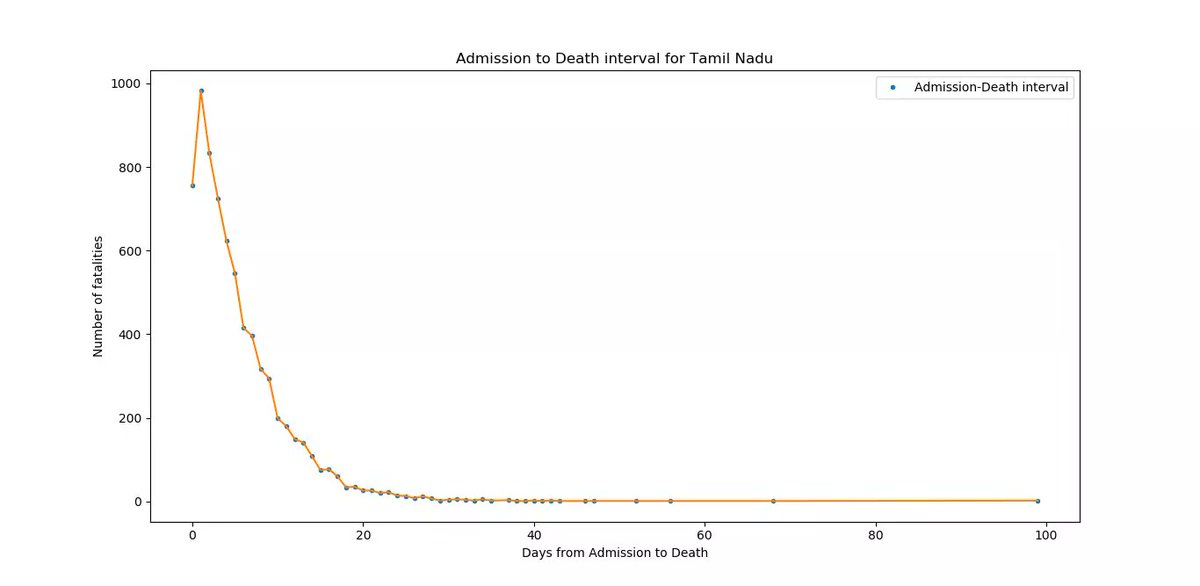
mean Admission-Death interval ~ 5.4 days
The distribution has a long tail (some patients spend several weeks in hosp.)
it has risen significantly from July-Sep
The distribution has a long tail (some patients spend several weeks in hosp.)
it has risen significantly from July-Sep

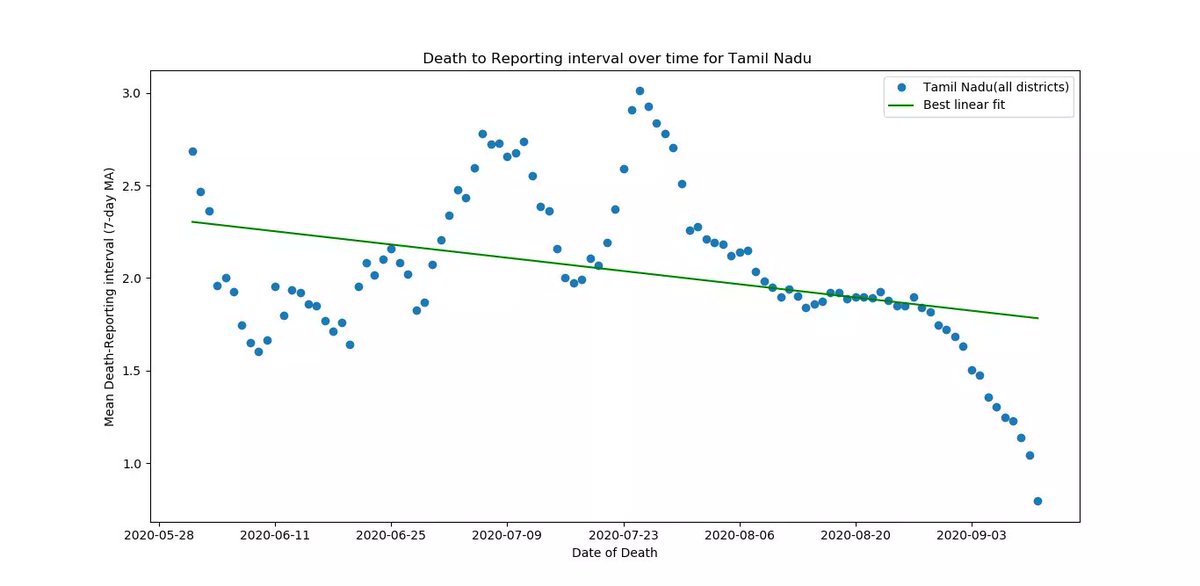
Death-Reporting inteval
A quantitative measure of size of TN's reporting "backlog". Its the time between death and actual reporting in state bulletin
Mean ~ 2 days
It has fallen from July-Sep
A quantitative measure of size of TN's reporting "backlog". Its the time between death and actual reporting in state bulletin
Mean ~ 2 days
It has fallen from July-Sep
Chennai vs Rest of TN (RoTN):
Chennai's mean age of fatalities is consistently higher than RoTN
CHN : 65.1 yrs
RoTN: 61.4 yrs
Chennai's mean age of fatalities is consistently higher than RoTN
CHN : 65.1 yrs
RoTN: 61.4 yrs

Fraction of Males is slightly lower in Chennai
CHN : 70%
RoTN: 72%
CHN : 70%
RoTN: 72%

Co-morbidities
A much higher fraction of Chennai's deaths had co-morbidities
CHN : 72%
RoTN: 60%
A much higher fraction of Chennai's deaths had co-morbidities
CHN : 72%
RoTN: 60%
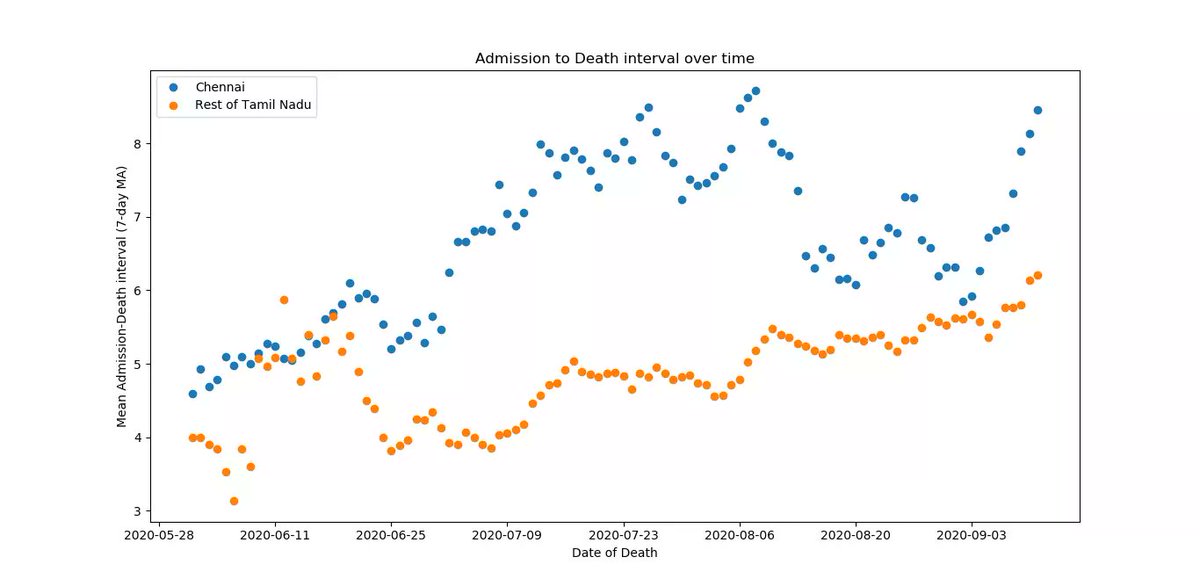
Admission-Death interval
Consistently higher in Chennai, corresponding to availability of better hospital care in the capital
Mean,
CHN : 6.7 days
RoTN: 4.8 days
Consistently higher in Chennai, corresponding to availability of better hospital care in the capital
Mean,
CHN : 6.7 days
RoTN: 4.8 days
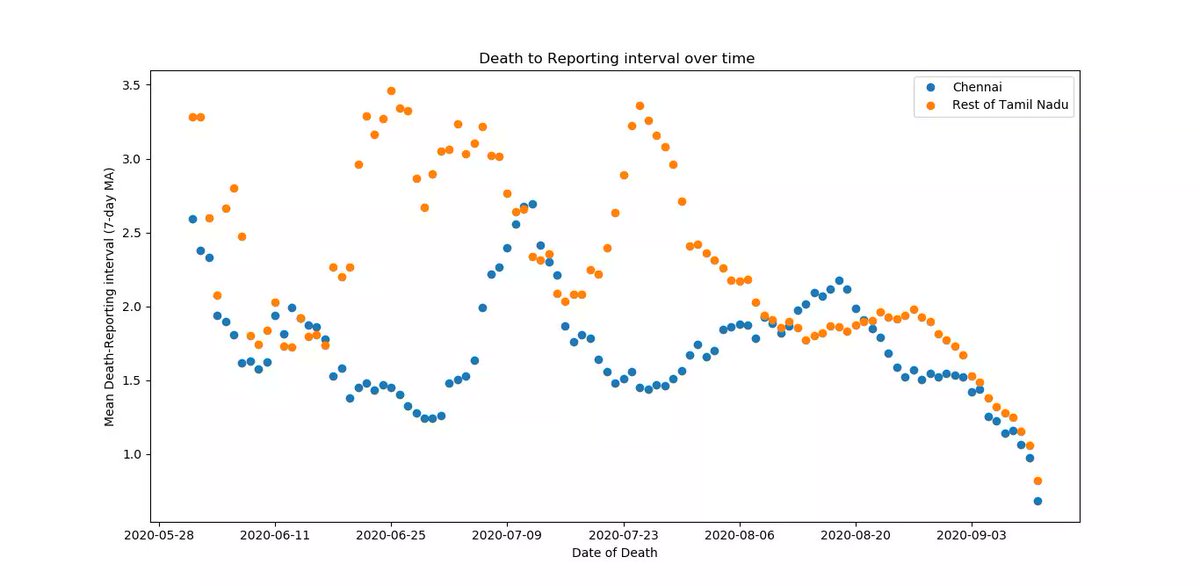
Death-Reporting interval
Chennai reports deaths more prompty vs RoTN
CHN : 1.7 day
RoTN: 2.2 days
Chennai reports deaths more prompty vs RoTN
CHN : 1.7 day
RoTN: 2.2 days
Comparison with Karnataka and odisha:
- TN has the highest mean-age of deaths, OD lowest
- OD has the highest fraction of Male deaths
- TN's deaths with no comorb. are higher
- TN's A-D inteval is higher than KA
- TN's reporting lag is lower
- TN has the highest mean-age of deaths, OD lowest
- OD has the highest fraction of Male deaths
- TN's deaths with no comorb. are higher
- TN's A-D inteval is higher than KA
- TN's reporting lag is lower
https://twitter.com/shananalla/status/1304728660776071168

One important caveat here is that TN and KAR are in different stages of their epidemics, and most of KAR's metrics (mean age,A-D interval,R-D interval) have improved from Aug to Sep.
Common:
- Mean age of deaths is rising with time in all 3 states
Common:
- Mean age of deaths is rising with time in all 3 states
One thing thats hard to miss is the very high fraction of diabetics among deaths in all 3 states. Why does diabetes increase risk of death so much? @anupampom @amitsurg @giridar100 @drcheruvarun
https://twitter.com/kprabhdeep/status/1304653709436047360
Bulletins -> stopcorona.tn.gov.in/daily-bulletin/
Source code -> github.com/grill05/covid1…
Parsed TN deaths dataset (CSV format) -> github.com/grill05/covid1…
Source code -> github.com/grill05/covid1…
Parsed TN deaths dataset (CSV format) -> github.com/grill05/covid1…
@anupampom @muradbanaji @rijomjohn @amitsurg @giridar100 @menonbiophysics @oommen @rukmini @covid19indiaorg @spacem0nk3y @countthedead @ShamikaRavi @BhramarBioStat @thattai @vishuguttal @rsidd120 @jamewils @UllasKolthur @drpugazh @kprabhdeep @gkangind @jebujohn @vincentrk
Tamil Nadu reported 518 deaths on July 22, including 444 deaths from its "backlog" (mostly from Chennai city)
No details were provided for these 444 deaths in Chennai, so they were excluded from the above analysis (clip from July 22 TN bulletin)
No details were provided for these 444 deaths in Chennai, so they were excluded from the above analysis (clip from July 22 TN bulletin)

• • •
Missing some Tweet in this thread? You can try to
force a refresh