NEW with @ChrisGiles_ & @DanielThomasLDN: UK’s big cities are shadows of their usual selves, but smaller urban areas have rebounded ft.com/content/203cc8…
What’s driving the divergence? Chart thread:
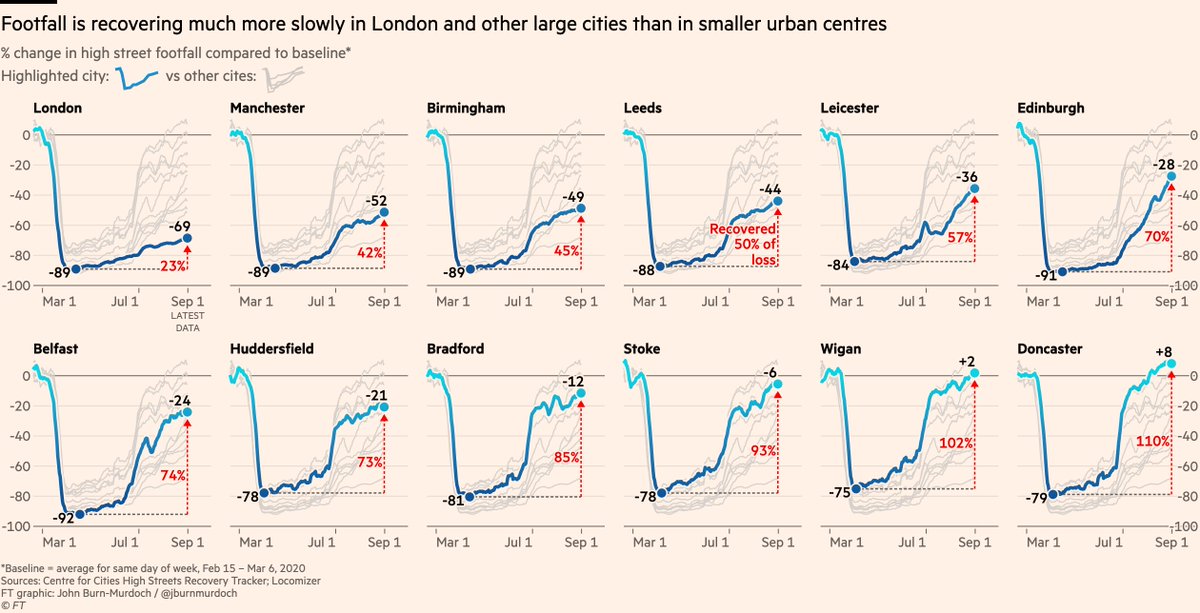
1/ Footfall in central London is still down 69%, but has picked up elsewhere
What’s driving the divergence? Chart thread:
1/ Footfall in central London is still down 69%, but has picked up elsewhere
2/ This is driven by working patterns, but that in itself plays out in two distinct ways:
First, job type. Staff are returning to the workplace at very different rates in different sectors, and the sectors with the most remote working today are clustered in cities, esp. London
First, job type. Staff are returning to the workplace at very different rates in different sectors, and the sectors with the most remote working today are clustered in cities, esp. London
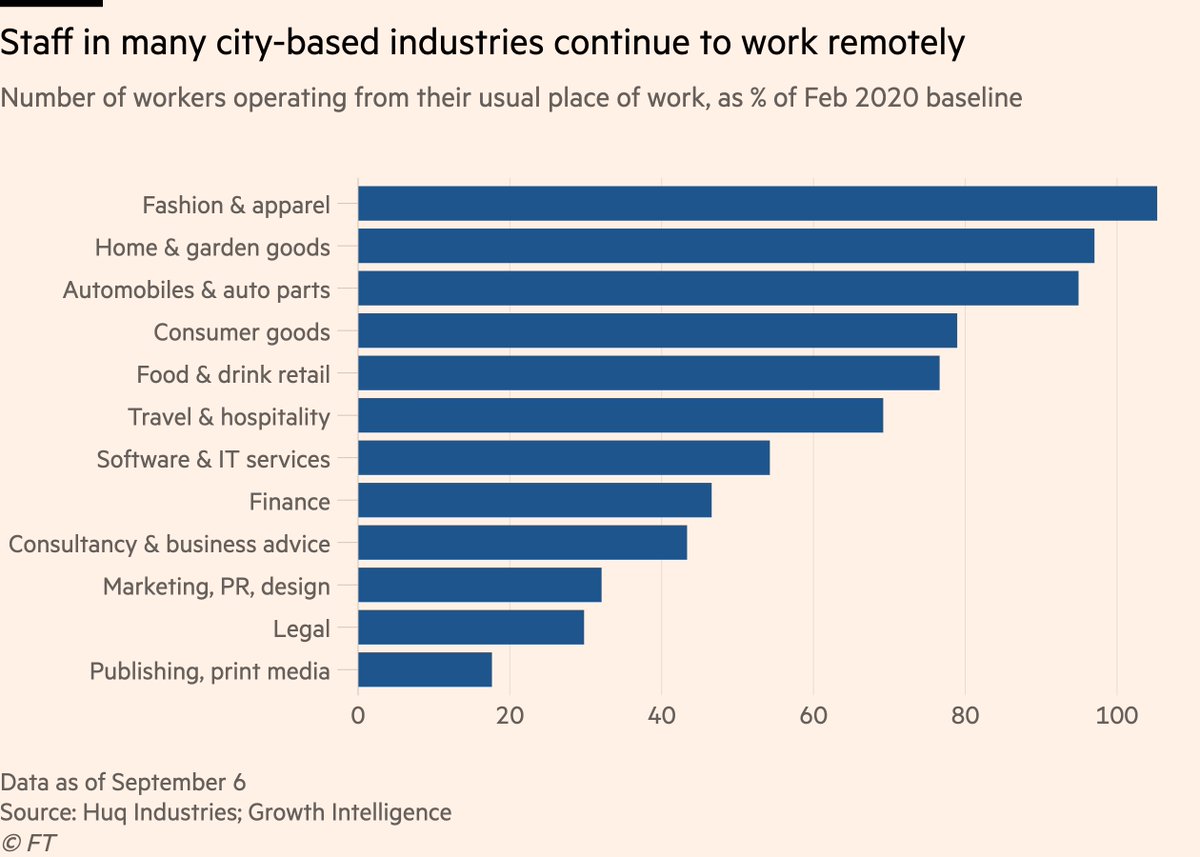
3/ Workers in retail, hospitality can’t do their jobs remotely and have returned to the workplace. They’re popping out for lunch or drinks near work and maybe shopping centrally before going home.
In big cities, office-workers are still at home, leaving the high streets empty.
In big cities, office-workers are still at home, leaving the high streets empty.
4/ But a bigger factor than what jobs people do is how they get to work, and how far they travel.
The bulk of the divergence is driven by commuting.
There’s a clear relationship between a city/town’s footfall and the % of its workers who usually commute on trains, buses or Tube
The bulk of the divergence is driven by commuting.
There’s a clear relationship between a city/town’s footfall and the % of its workers who usually commute on trains, buses or Tube

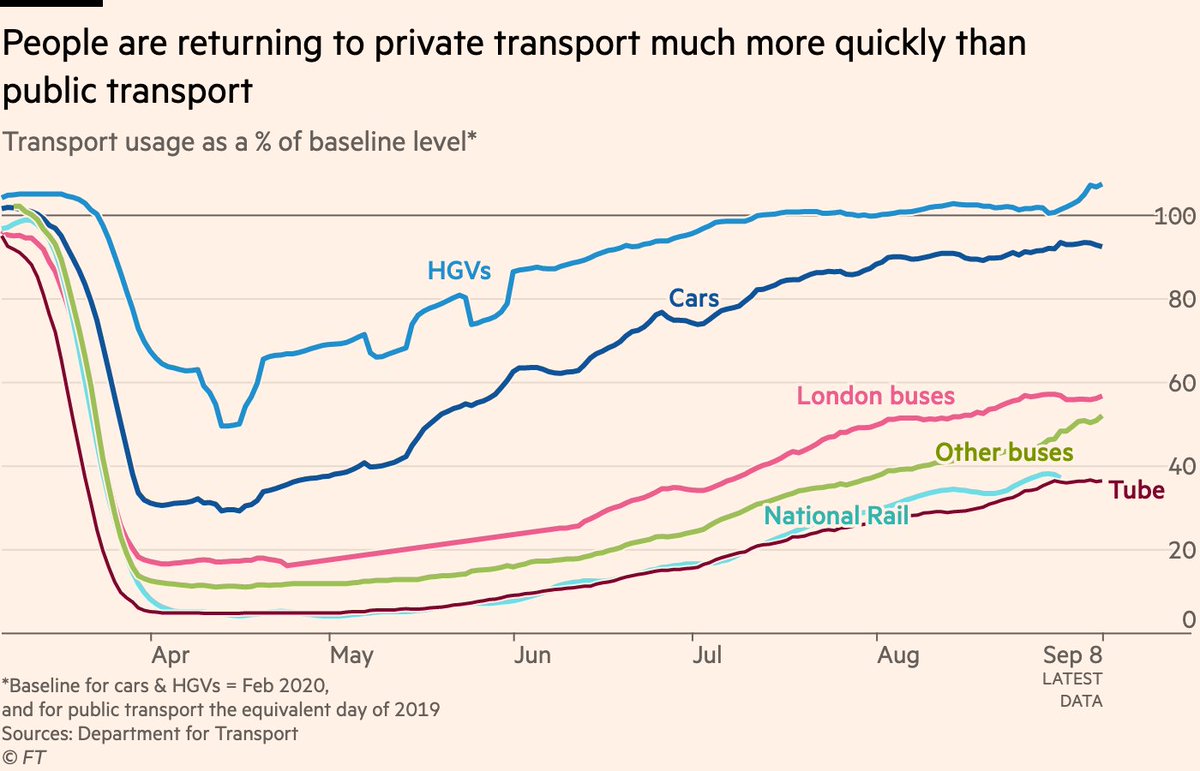
5/ People who usually walk or drive have been much more comfortable resuming their commute than those who take public transport.
Car trips are almost back to normal, but train and Tube travel are below 40% of their baseline, and buses below 60%.
Car trips are almost back to normal, but train and Tube travel are below 40% of their baseline, and buses below 60%.
6/ That’s 100,000s of people who would usually be piling onto trains to spend time & money in city centres but are now staying home, spending locally instead.
This is a boon for suburban retailers etc, but potentially fatal for their cousins in the business district.
This is a boon for suburban retailers etc, but potentially fatal for their cousins in the business district.
7/ Let’s look at the top-line numbers again:
Almost every city or town saw an uptick in high street footfall over summer as people returned to work, but London’s was barely perceptible.
I’m not sure people fully realise how commuter-reliant central London’s high streets are...
Almost every city or town saw an uptick in high street footfall over summer as people returned to work, but London’s was barely perceptible.
I’m not sure people fully realise how commuter-reliant central London’s high streets are...

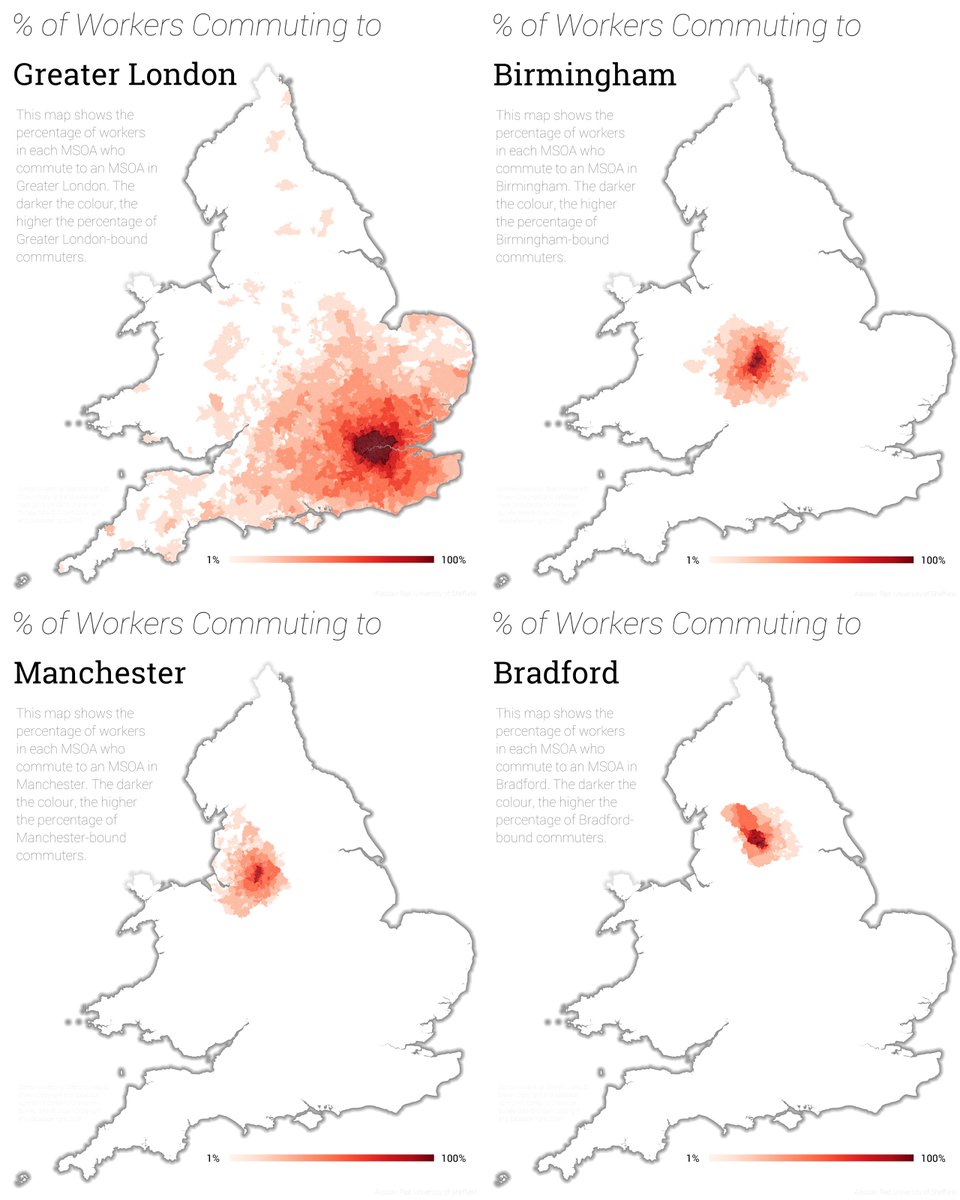
8/ ...but thanks to @undertheraedar, we know:
Here’s where the "daytime population" (workers, schoolkids etc) come in from, for four major UK cities.
Suffice it to say, one of these is not like the others...
(all images from @undertheraedar)
Here’s where the "daytime population" (workers, schoolkids etc) come in from, for four major UK cities.
Suffice it to say, one of these is not like the others...
(all images from @undertheraedar)
9/ Even if we zoom right into the very core of London — Cities of London & Westminster — a huge portion of its daily workforce usually travels in by train, Tube and or bus.
~80% of the people who usually spend money in its shops & hospitality are just ... not there anymore.
~80% of the people who usually spend money in its shops & hospitality are just ... not there anymore.
10/ The big question: is this a temporary blip that will spring back to normality post-Covid (whenever that may be), or are people (and employers) settling into a new normal?
Read @ChrisGiles_ & @DanielThomasLDN’s full story for more discussion on that ft.com/content/203cc8…
Read @ChrisGiles_ & @DanielThomasLDN’s full story for more discussion on that ft.com/content/203cc8…
Woops, this one was meant to come with an @undertheraedar image as well:

11/10 a belated but huge thanks here to @CentreforCities and @lramuni for sharing the city/town footfall data with us.
You can explore their full dataset here, including additional data on high street spending centreforcities.org/data/high-stre…
You can explore their full dataset here, including additional data on high street spending centreforcities.org/data/high-stre…
• • •
Missing some Tweet in this thread? You can try to
force a refresh