Youyang Gu Profile picture
Sep 15, 2020 6 tweets 3 min read Read on X
9/15 Weekly covid19-projections.com Update:

We forecast 24,000 (13-39k) additional reported deaths in the US by November 1 (~500/day).

Nov 1 Total Deaths Forecasts:

Today: 219k (208-233k)
Last week: 219k (207-236k)
2 weeks ago: 219k (205-240k)
4 weeks ago: 225k (203-255k)
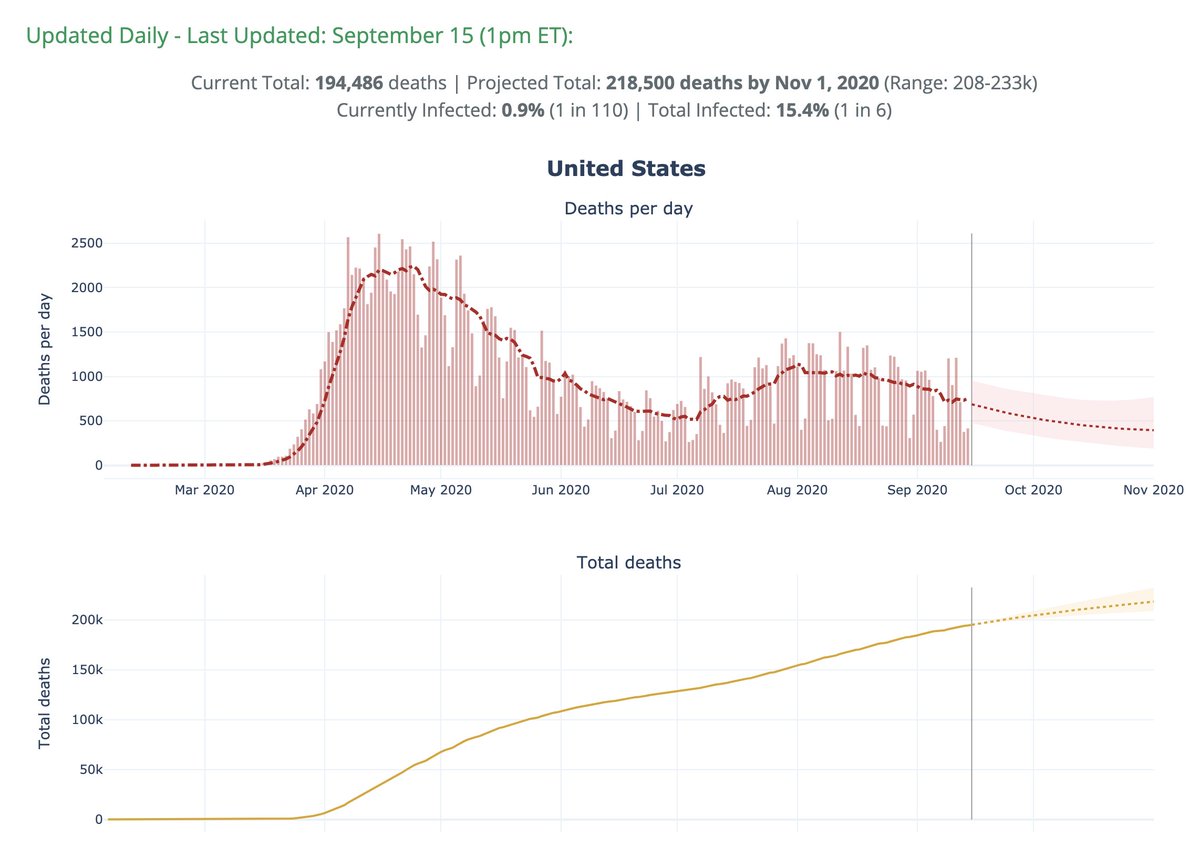
The 7-day average for deaths increased yesterday and will spike up today due to the Labor Day effects.

But there is no cause for alarm.

The average should fall again starting on Wednesday and we'll likely reach an average of around 750 deaths per day by the weekend.
It's possible that cases may flatten over the next few weeks, while the test positivity and hospitalizations continue to decrease.

We expect the downward trend in deaths to continue.

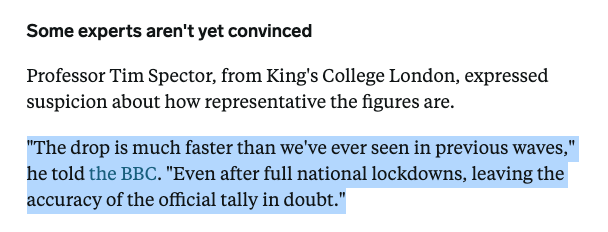
Reporting delay for deaths may be peaking in states like Florida:

Here is how our US daily deaths forecasts from 3 weeks ago have done thus far, compared with the most-cited model in the media.

20 days in, the true results have already fallen out of the confidence interval of the IHME model. They are now projecting out until 2021 (108 days).
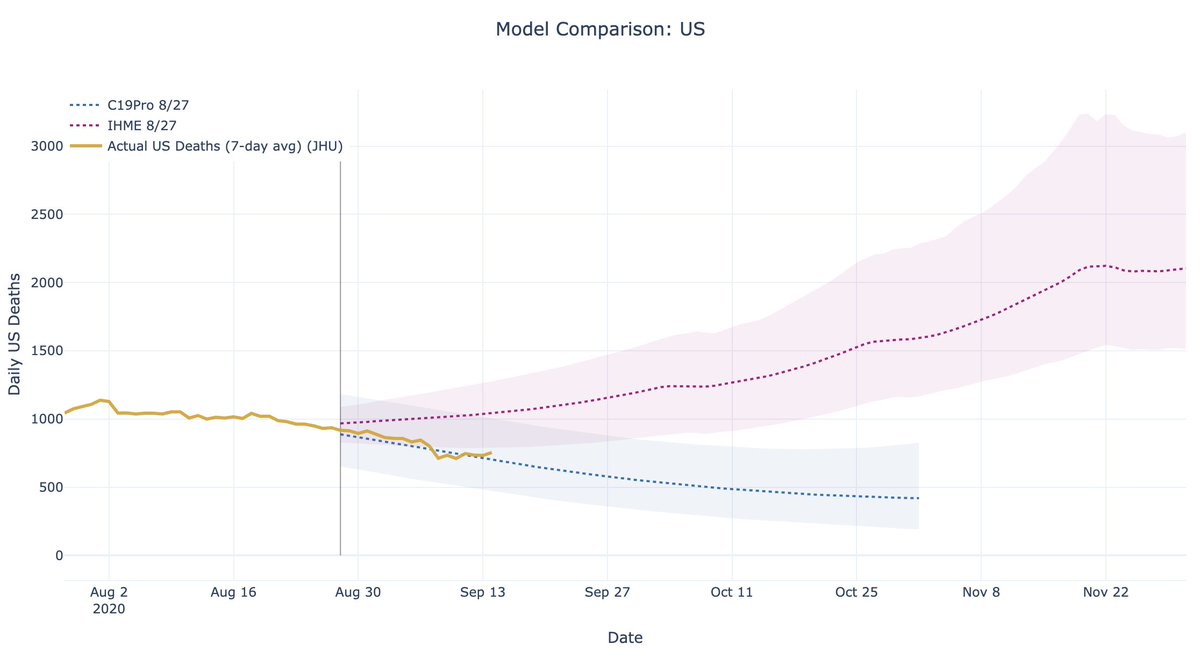
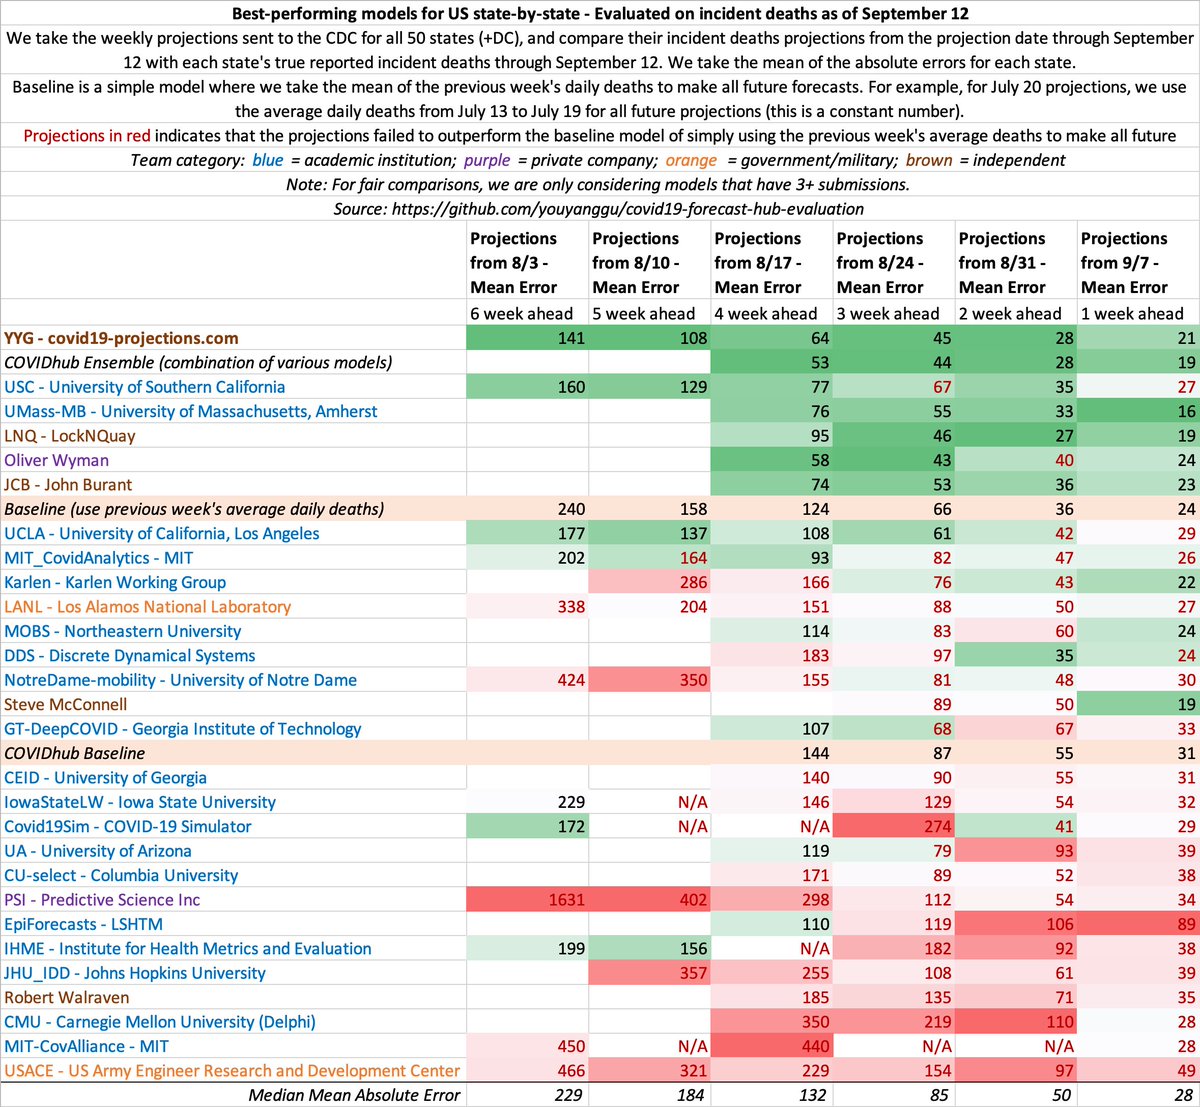
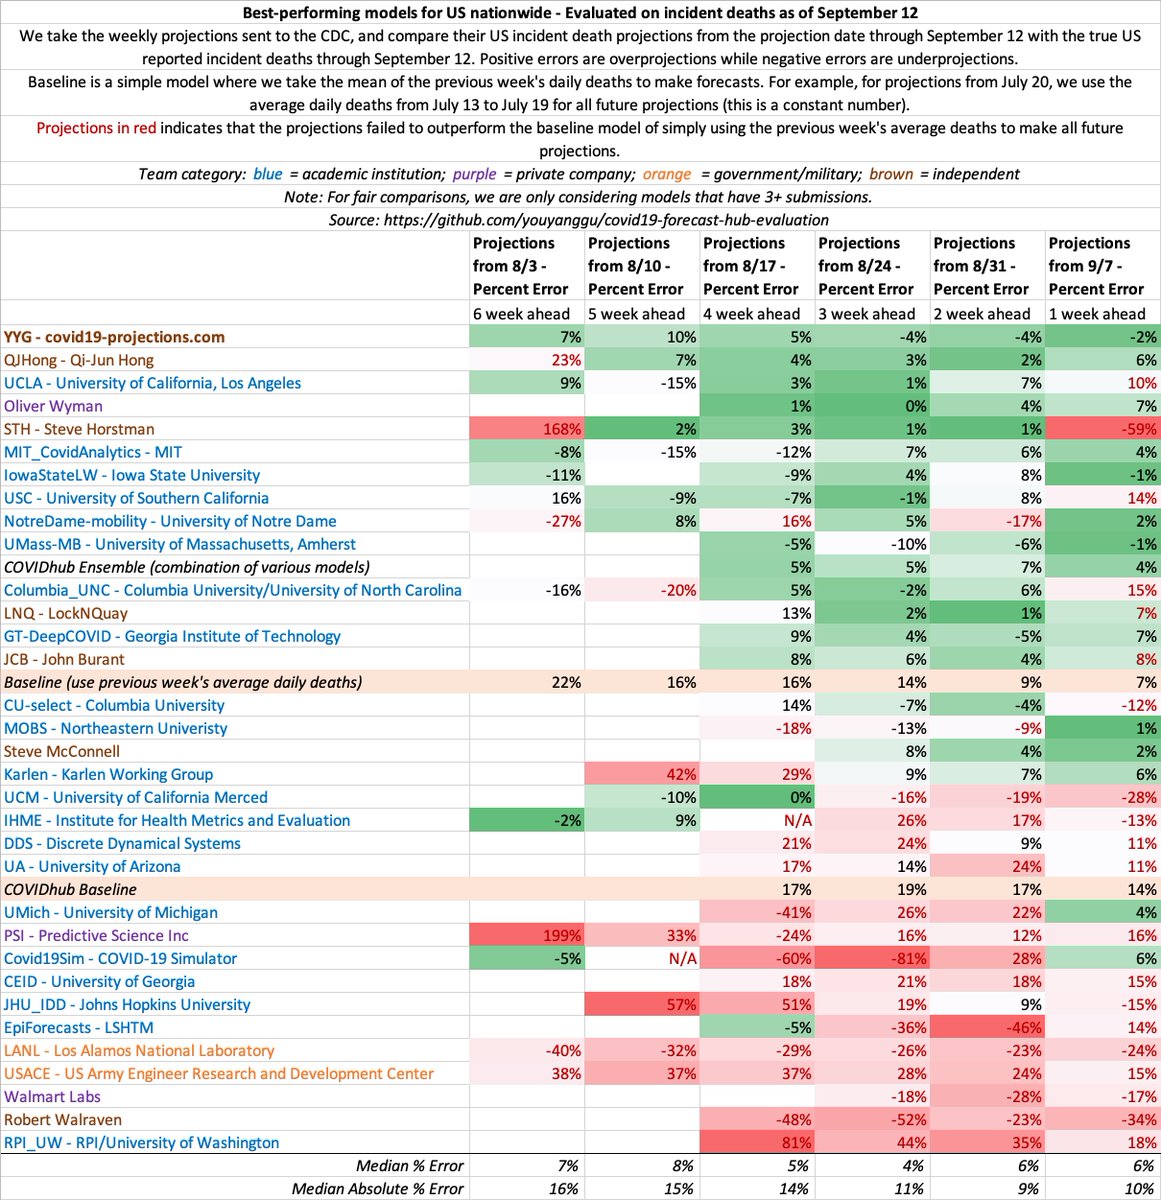
According to our most recent evaluation, covid19-projections.com continues to be a top-performing model.

You can find more evaluations, methodology and plots here: covid19-projections.com/about/#histori…
It appears that IHME now has COVID forecasts for 18 months in the future.

It’d makes more sense for them to focus on accurately forecasting 18 days in the future before focusing on 18 months.

• • •

Missing some Tweet in this thread? You can try to force a refresh
 

Keep Current with Youyang Gu

Youyang Gu Profile picture

Stay in touch and get notified when new unrolls are available from this author!

Read all threads

This Thread may be Removed Anytime!

PDF

Twitter may remove this content at anytime! Save it as PDF for later use!

Try unrolling a thread yourself!

how to unroll video
  1. Follow @ThreadReaderApp to mention us!

  2. From a Twitter thread mention us with a keyword "unroll"
@threadreaderapp unroll

Practice here first or read more on our help page!

More from @youyanggu

Aug 5, 2021
People were worried cases would spike further when the UK lifted almost all remaining restrictions in July. The opposite happened.

We must acknowledge that restrictions aren't all that effective in Western countries.

(Except Australia, who just entered their 6th lockdown)
It's interesting that some experts would rather question the accuracy of the data than acknowledge this reality.
Many bad papers looked at these curves in 2020 & concluded that more restrictions is followed by a decline in cases, when the decline would've happened regardless.

If we apply the same flawed logic here, one can say that the lifting of restrictions is followed by fewer cases.
Read 6 tweets
Jul 22, 2021
Thanks @ScottGottliebMD! On data, research & messaging, there’s lots of room for improvement at the CDC.

For modeling, they were right in enlisting @reichlab to run Forecast Hub: cdc.gov/coronavirus/20…

They’ve crowdsourced 30+ teams for weekly updates.

Of course, the modeling isn’t perfect & never will be. But this ensemble of forecasts coming from 250+ researchers has helped add clarity for many over the past year.

The CDC deserves credit for taking a conscious, hands-off approach on this.

technologyreview.com/2021/05/28/102…
That said, I do think there's too much focus on modeling cases/deaths. For ex, I've haven't seen many efforts on vaccination forecasts or infections/immunity estimates.

There may be some reluctance in the general scientific community to do this, so it's hard to blame one entity.
Read 4 tweets
Jul 1, 2021
On its last model update on March 5, 2021, covid19-projections.com projected that 180 million people in the US will be vaccinated by July 1 (1+ dose).

Today, July 1, @CDCgov reported that the US surpassed 180M people vaccinated.

Not all models are bad.

covid19-projections.com/path-to-herd-i… Image
Since I began making vaccination projections in Dec 2020, I have consistently predicted a return to normal by Summer 2021.

Some said it was too optimistic, others too pessimistic.

It appears that as of this week, all states (minus HI) are fully reopen.

ImageImage
Of course, this is a new normal - we will never return to pre-pandemic normal.

The Delta variant will be around. People will still be infected, even among the vaccinated.

But that's expected. Efforts must continue to focus on vaccinating the vulnerable population.
Read 4 tweets
Jun 30, 2021
South Dakota has a vaccination rate of 50% (1+ dose). Maine is at 66%. So is Maine better protected?

Not quite. If you factor in immunity from natural infection, SD has a total population immunity of ~70%, while ME is at ~62%.

I created a calculator: docs.google.com/spreadsheets/d…
Many existing immunity estimates only look at a single metric: vaccination rate. But there are two main issues:

1) Not all vaccinated individuals are fully immune
2) They do not take into account acquired natural immunity

This calculator attempts to correct for this.
Looking at the US:
- 54% of the population have been vaccinated
- Natural infection rate is ~30-40% (covid19-projections.com/path-to-herd-i…).

If you assume the vaccination rate of previously infected individuals is slightly lower (say 45%), that gives a total population immunity of ~65%.
Read 5 tweets
Jun 22, 2021
I believe income inequality is the single best predictor of total Covid deaths in the US.

Not income, but income *inequality*. The R^2 is surprisingly high: 0.35.

Thanks to @joe_sill, I was able to look at over 40 different variables, and expands on my analysis from last month.
It's honestly shocking how correlated the Gini coefficient, a measure of inequality in wealth distribution in a state, is with total Covid deaths.

No other predictor I've seen comes close.

Props to @joe_sill for the finding and an excellent dataset:

Income is not correlated at all with total Covid deaths, but income *inequality* is.

While intuitively this makes sense, this clear dichotomy was extremely surprising for me.

(By the way, there is almost no correlation between income and income inequality)
Read 13 tweets
May 25, 2021
Is containing COVID-19 a requirement for preserving the economy? My analysis suggests: probably not.

In the US, there is no correlation between Covid deaths & changes in unemployment rates.

However, blue states are much more likely to have higher increases in unemployment.

🧵 Image
We can dive deeper by looking at levels of restrictions in each state, using the Oxford Covid-19 Government Response Tracker (OxCGRT).

More restrictions in a state is NOT correlated with fewer COVID-19 deaths.

However, more restrictions IS correlated with higher unemployment. ImageImage
The most interesting data point is South Dakota.

As the only state to never order closures of restaurants, bars & retail, SD actually saw a 0.5% DECREASE in unemployment since the pandemic started. It also never ordered a mask mandate.

Its deaths per capita is the 10th highest.
Read 18 tweets

Did Thread Reader help you today?

Support us! We are indie developers!


This site is made by just two indie developers on a laptop doing marketing, support and development! Read more about the story.

Become a Premium Member ($3/month or $30/year) and get exclusive features!

Become Premium

Don't want to be a Premium member but still want to support us?

Make a small donation by buying us coffee ($5) or help with server cost ($10)

Donate via Paypal

Or Donate anonymously using crypto!

Ethereum

0xfe58350B80634f60Fa6Dc149a72b4DFbc17D341E copy

Bitcoin

3ATGMxNzCUFzxpMCHL5sWSt4DVtS8UqXpi copy

Thank you for your support!

Follow Us!

:(