9/22 Weekly covid19-projections.com Update:
We forecast 23,000 (13-38k) additional reported deaths in the US by November 1 (~600/day).
Nov 1 Total Deaths Forecasts:
Today: 223k (213-238k)
Last week: 219k (208-233k)
2 weeks ago: 219k (207-236k)
4 weeks ago: 219k (202-244k)
We forecast 23,000 (13-38k) additional reported deaths in the US by November 1 (~600/day).
Nov 1 Total Deaths Forecasts:
Today: 223k (213-238k)
Last week: 219k (208-233k)
2 weeks ago: 219k (207-236k)
4 weeks ago: 219k (202-244k)
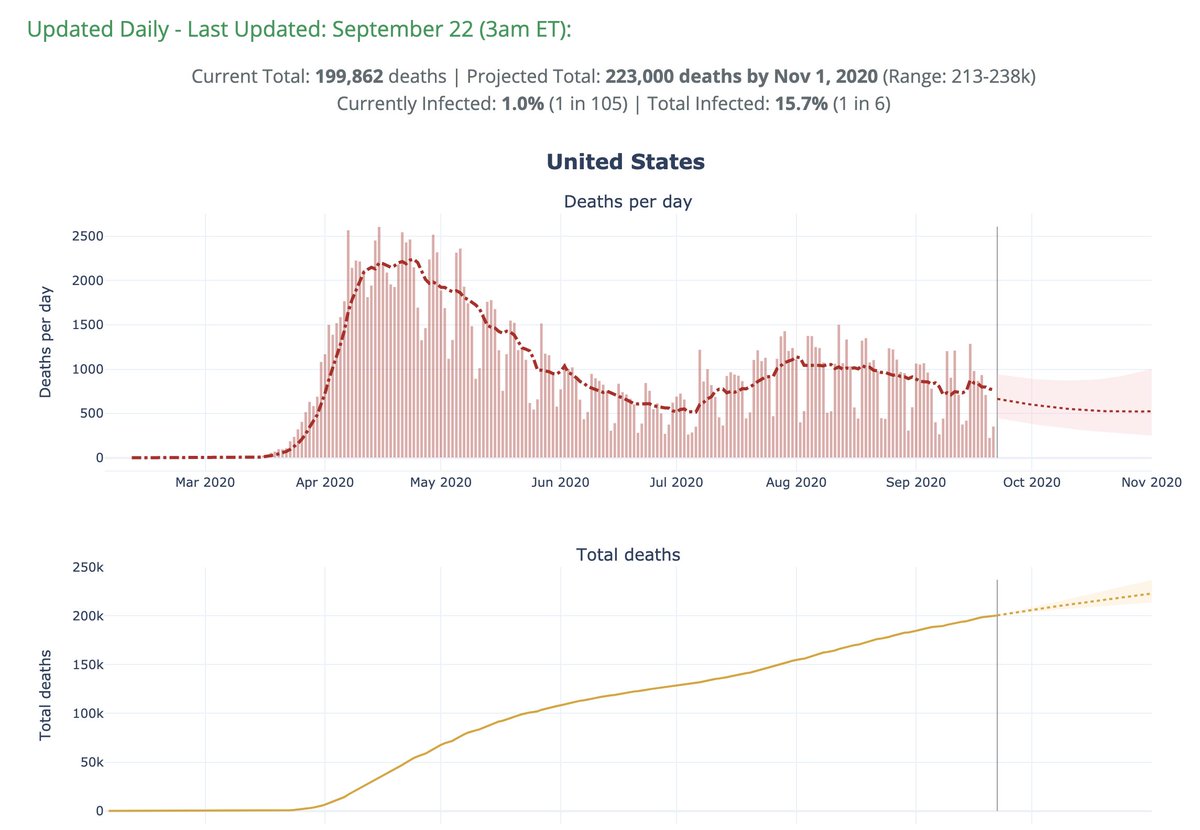
This week's forecast is a slight uptick from past weeks' forecasts.
We believe new infections may be flattening at 2x the level it was back in May. That is a cause for concern.
Which direction new infections will go is still uncertain, at least from the data.
We believe new infections may be flattening at 2x the level it was back in May. That is a cause for concern.
Which direction new infections will go is still uncertain, at least from the data.
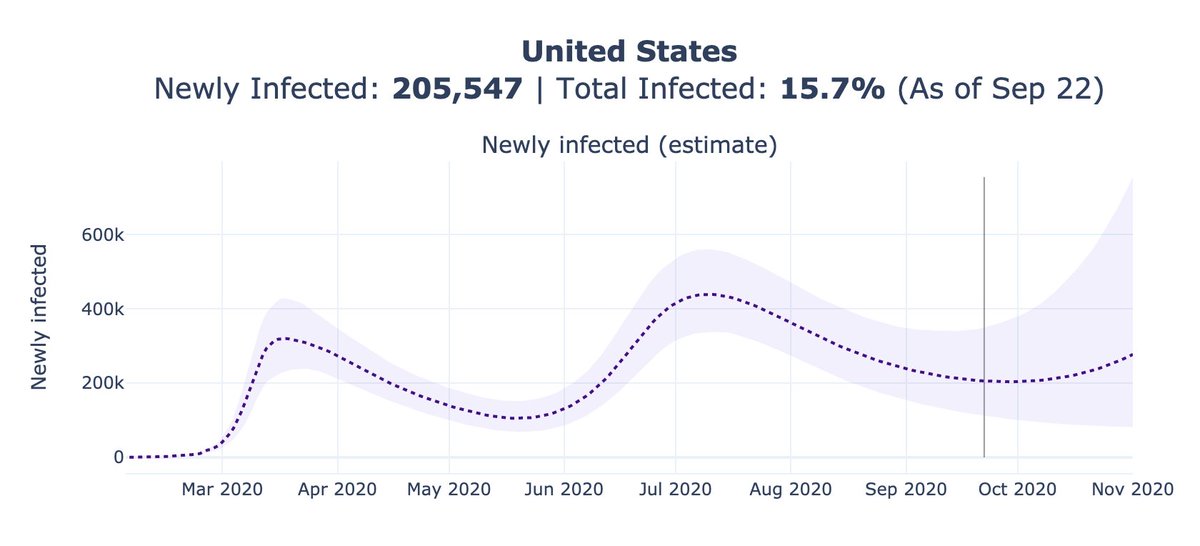
We may see cases plateau at around the 40k/day mark. Cases may increase in the near future, but it's unclear if that'll be due to backlog/increased testing or due to a true rise.
Hence, test positivity and hospitalizations are better metrics to monitor.
Hence, test positivity and hospitalizations are better metrics to monitor.
https://twitter.com/youyanggu/status/1305937873011716099
For example, Texas added ~20,000 backlogged cases yesterday. So that will skew the 7-day averages upwards.
Of course, that does not mean that infections in Texas (or the US as a whole) are increasing. But this may mislead those who only look at raw case counts.
Of course, that does not mean that infections in Texas (or the US as a whole) are increasing. But this may mislead those who only look at raw case counts.
Looking at CDC data that breaks down new cases by age, we saw another increased proportion of cases among the 18-49 age group.
If the same pattern holds, we may see a deja vu scenario where the younger population spreads it to the higher-risk population.
cdc.gov/coronavirus/20…
If the same pattern holds, we may see a deja vu scenario where the younger population spreads it to the higher-risk population.
cdc.gov/coronavirus/20…

With all that said, due to lag, we believe deaths will continue to fall over the next month.
In some states (such as Florida), the lag is so severe that the average time between when a person is infected to when their death is reported is more than 40 days.
In some states (such as Florida), the lag is so severe that the average time between when a person is infected to when their death is reported is more than 40 days.
So that means that a person whose death was reported today most likely was infected in early August.
And for a person who gets infected today (and eventually die) will not have his/her death reported until November.
And for a person who gets infected today (and eventually die) will not have his/her death reported until November.
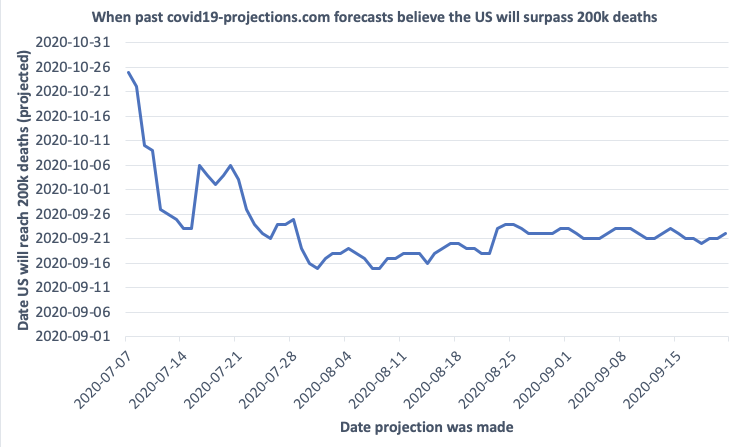
Today, Sep 22, the US surpassed 200,000 reported deaths.
Since the end of July, our model has consistently projected that the US will surpass 200,000 deaths between Sep 15-25, a 10-day window.
Since the end of August, it has projected a 4-day window, Sep 20-24.
Since the end of July, our model has consistently projected that the US will surpass 200,000 deaths between Sep 15-25, a 10-day window.
Since the end of August, it has projected a 4-day window, Sep 20-24.
A year ago, 200,000 deaths would've been an unfathomable number. We cannot let this become normalized.
We must all do our part to continue to protect those around us.
We must all do our part to continue to protect those around us.
We believe consistent, accurate modeling is more important now than ever.
Unfortunately, this unbiased approach to modeling does not tend to generate attention-grabbing headlines in the media.
Unfortunately, this unbiased approach to modeling does not tend to generate attention-grabbing headlines in the media.
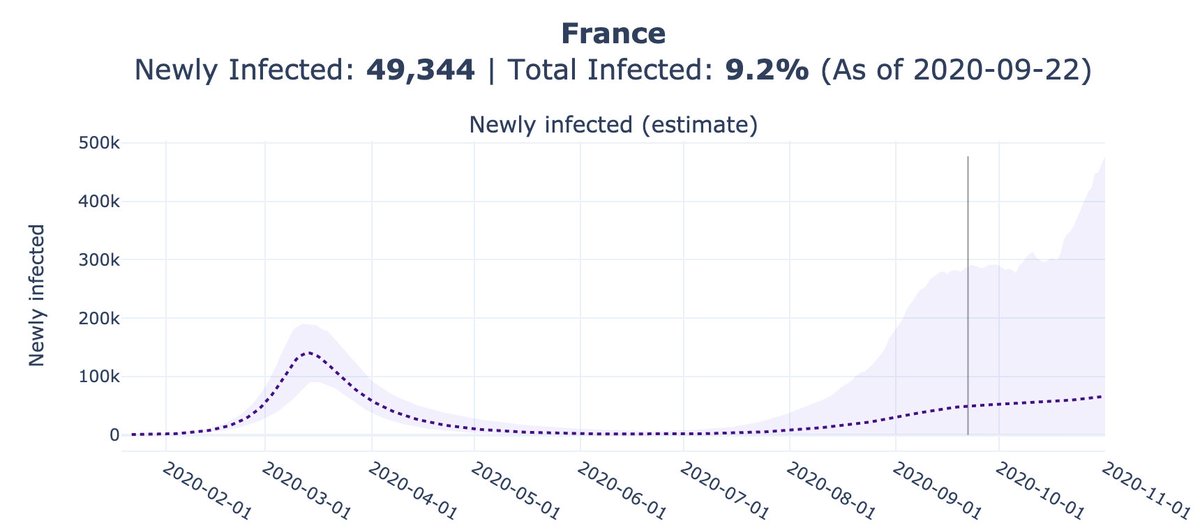
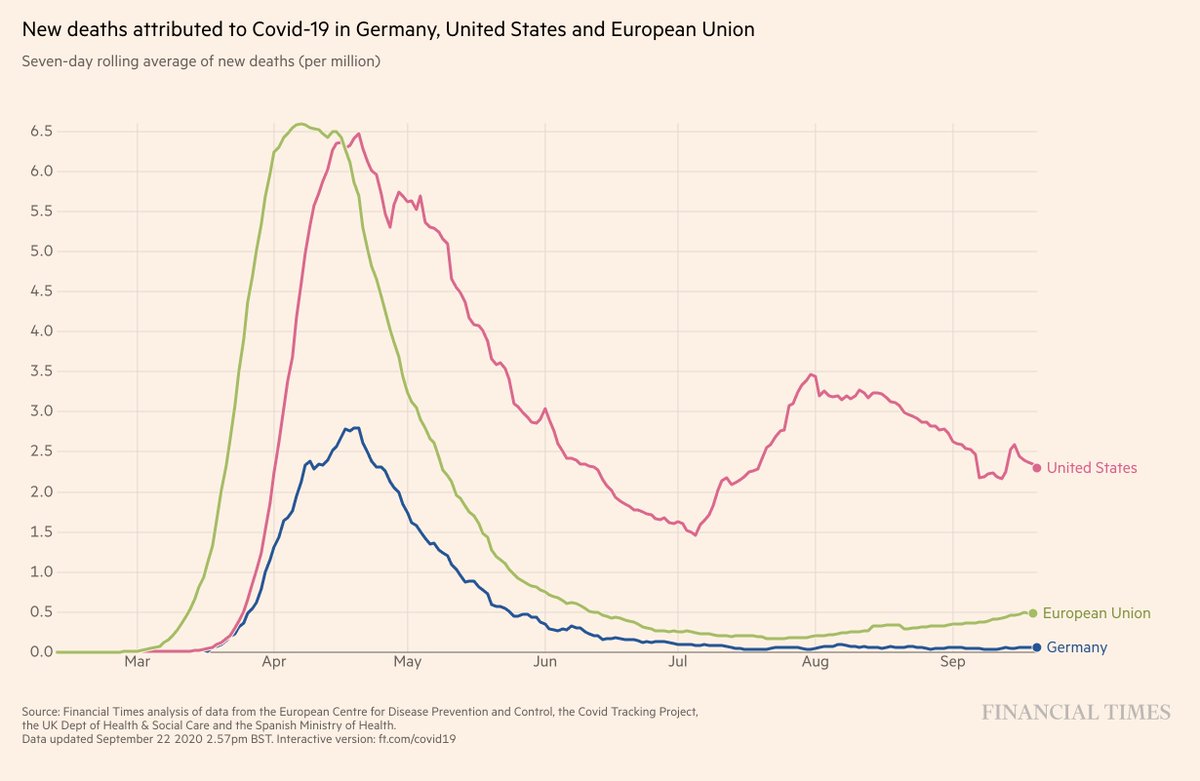
Across the Atlantic, We are seeing a second wave taking place across Europe.
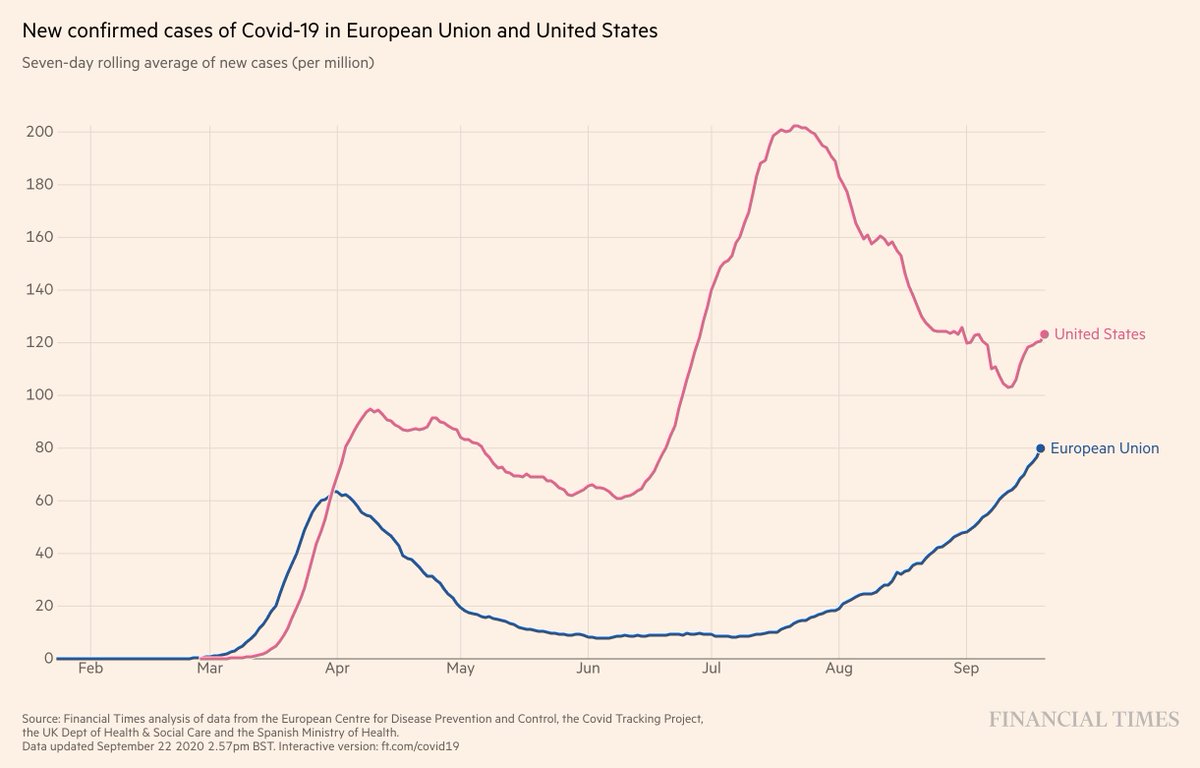
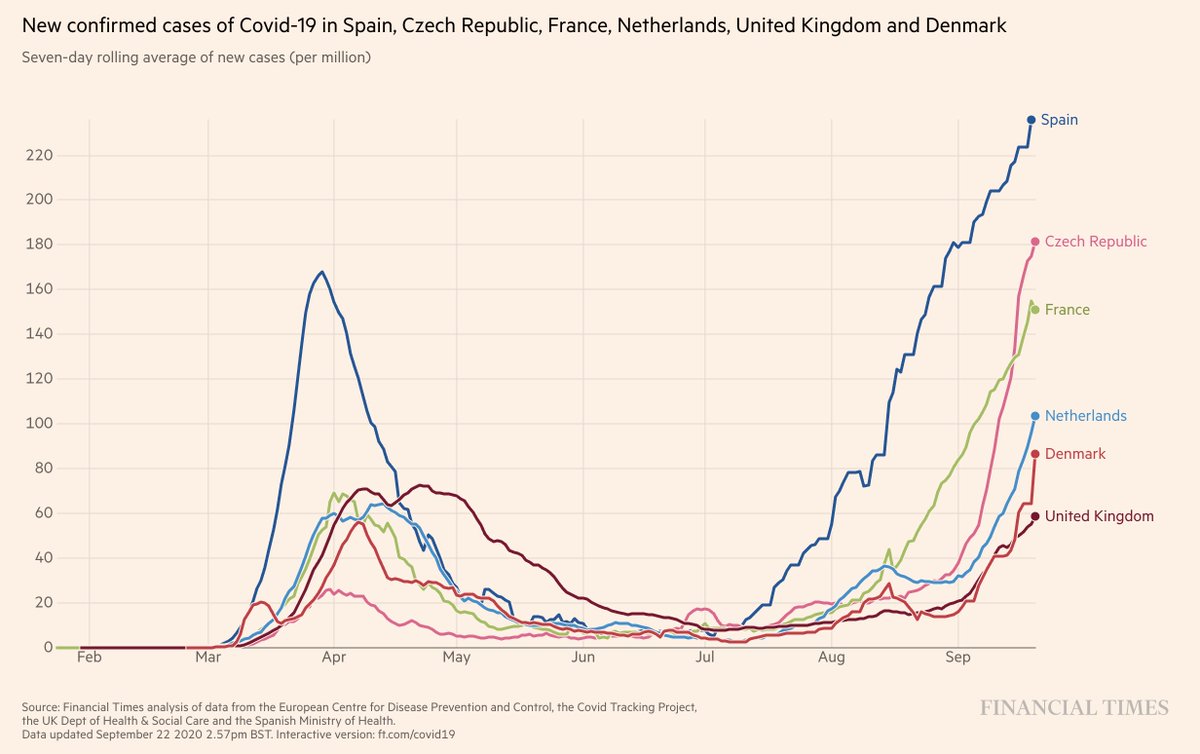
Infections in Spain and France may be approaching levels seen back in March.

Here are two takeaways from this second wave in Europe:
1) Very few regions in Europe, if any, have enough population immunity to prevent new outbreaks.
2) The praise we saw in June-July for the way European countries handled the reopening was premature.
1) Very few regions in Europe, if any, have enough population immunity to prevent new outbreaks.
2) The praise we saw in June-July for the way European countries handled the reopening was premature.
Our model is forecasting that both the US and Europe will report ~20k additional deaths by November 1.
One notable outlier in Europe? Germany.
Their population exceeds that of California, Florida, and New York combined, but they have been reporting <10 deaths per day.
One notable outlier in Europe? Germany.
Their population exceeds that of California, Florida, and New York combined, but they have been reporting <10 deaths per day.
I'll end my weekly update here. There's so much new data available each week and not enough time to go through them all.
Hopefully this thread presents a good summary.
/END
Hopefully this thread presents a good summary.
/END
• • •
Missing some Tweet in this thread? You can try to
force a refresh