More data on schools in GA. I am trying to do comparisons that are reasonably near each other geographically, and have a difference in virtual vs in-person school. First up, Gwinnett (Aug start school) vs Dekalb Co. (virtual) 1/
Second up, our coastal region. Chatham Co is virtual, while Effingham,Bryan,Liberty,Mcintosh,Glynn have some in person options with varied Aug start dates. Will try to add more to this today. 2/
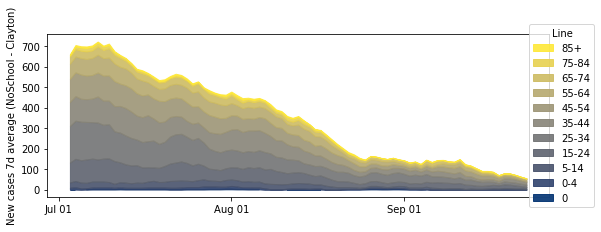
Clayton County, no school. Fayette County with a Aug 17 start. (note: population of Clayton is larger).
Cobb County (still virtual) vs Forsyth+Cherokee counties (in person Aug 1 in Cherokee and Aug 17 in Forstyth). Most in person also have virtual option.
Add up all the counties in this thread, with some effort to pair them geographically and by population. I get school in session with Rt of 0.83 and school virtual with Rt of 0.85. Calculations from mid-Aug to mid-Sept using 6.5 day cycle.
Conclusions: the introduction of managed in-person school with restrictions in Georgia has not resulted in obvious measurable spread. School systems that are virtual should migrate to careful, managed, in person options asap. Masks, and outdoor options, especially!
Sorry for those who really want the COVID-19 graphs, I am checking them. We have a disease burden about 50% higher than a normal flu season (most active 3 months), and we are likely close to our seasonal high in the next week or two. Hospitals are not like last year.
1/
What can an individual do?
1) Get vaccinations up to date. These are REALLY high cost/benefit shots. I got my fourth about six week ago. 2) Wear an N95 in crowded indoor settings. Especially homes (which are by design poorly ventilated).
2/
3) Use MERV-13 filters designed for the airspace. The combination of N-95 respirators and air filters can reduce the chances of infection 100-fold in most circumstances. If you wear a mask, you can expect 20-fold reduction in risks.
3/
Atlanta Medical Center is closing. This choice, by their owners, occurred because it is not profitable, and it is not profitable because it provides free health care to too large a portion of uninsured Georgians. 1/
This profit/uninsured problem exists because hospitals must serve people in need regardless of their ability to pay, and in some cases 40% of a hospital's patients will be uninsured. So hospitals play games to try to minimize their uninsured patient fraction. 2/
In 2014, Obamacare passed. It included a Medicaid expansion. The federal reimbursement rates for procedures would be cut. And, the federally funded Medicaid expansion would reduce the number of uninsured by about a factor of two. It was a breakeven proposition. 3/
US COVID-19 cases, census, and deaths. In this plot, these three lines were aligned in amplitude for their peaks in January. The idea is that shifts between cases, census, and deaths, would show by relative line height today. We are near the national peak for this wave. 1/
Census is up a little for this wave, the ratio between deaths and cases are about the same as late January. Case Fatality Ratio is also about the same. 2/
State by state, we are not seeing the census push system-wide hospital stress (would be over 50 on this plot), although some areas are having issues. Some of our divisions have multiple attendings out right now with case positives. 3/
@JasonSalemi I think the CDC move is actually in the right direction. Omicron featured huge problems, but among the positives were a five-fold decline in CFR. Which implies a five-fold reduction in disease burden per case.
1/
@JasonSalemi Which doesn't matter much when cases are several times higher than prior peaks.
But what happens when cases drop precipitously to levels below prior peaks? That five-fold reduction in disease burden per case really starts to matter.
2/
@JasonSalemi It implies hospital burdens, caused by cases today, will be quite negligible in most of the US, which reduces the value of protections. Everything would be scaled down.
Interesting thoughts on Sars-COV-2. As the pandemic progressed, people generated ever increasing proportions of the population that needed resistance to generate an Rt under 1 (a temporary herd immunity), because it was assumed R0 was rising.
What if they were mostly wrong?
1/
The evidence is now emerging that MOST of the increased transmissibility of Sars-COV-2 came from shorter intervals from a person infected to a secondary attack (the next person in the transmission chain).
2/
For example, estimates for the April 2020 transmission were an R0 of 2-3, and a serial interval of 5.2 days.
Alpha had a serial interval of 4.5 days
Delta was 3.3 days
Omicron was 2.2 days.
An R0 of 2 at 2.2 days would look like an R0 of 5.1 at 5.2 days.
3/
US COVID-19 cases, census, and deaths. Again. Rt for hospitalizations is nearly one, about to decline. Some states with delta outbreaks and early omicron outbreaks are shown in thread.
🧵 1/
New York state. Census was climbing over a month before omicron onset, and is now preparing to turn. It is important to distinguish census from hospitalizations (of which there are many). The hospital average length of stay for omicron is MUCH shorter. 2/