Marc Bevand Profile picture
Sep 27, 2020 9 tweets 3 min read Read on X
Excited to share this new COVID modeling script:

It applies various age-stratified IFR estimates to calculate the expected overall IFR in a given country. It's based on demographics (countries population pyramids): github.com/mbevand/covid1…

Many interesting findings—read on

1/n
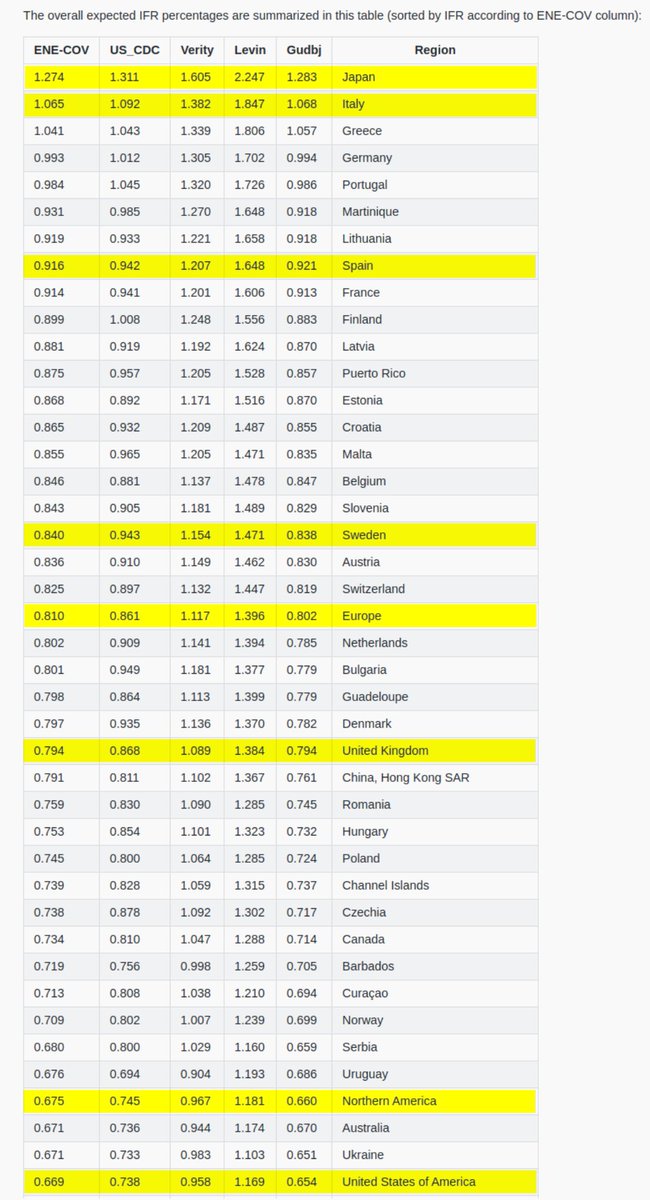
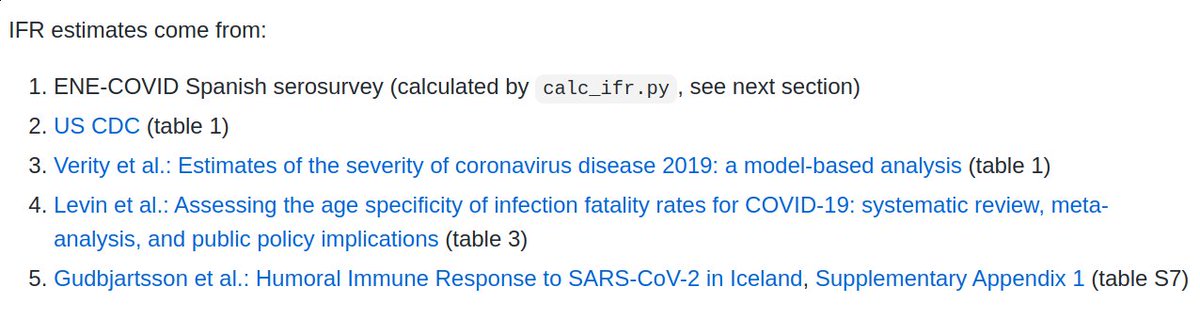
First off, I use five different sources estimating the age-stratified Infection Fatality Ratio of COVID-19:

1. ENE-COVID
2. US CDC
3. Verity et al.
4. Levin et al.
5. Gudbjartsson et al.

If you know of more sources, let me know and I'll add them to my script

2/n
So, what do we find?

The overall IFR estimates, with the exception of Levin et al., are relatively consistent with each other, usually within 30-40%. Levin et al. is up to 2-fold higher than the others, depending on the country.

3/n
The country with the oldest population is expected to have the highest overall IFR: Japan at 1.3-1.6% (excluding Levin et al.)

The one with the youngest pop. is expected to have the lowest overall IFR: Uganda at 0.074-0.147%

>10-fold difference between these 2 countries!

4/n
In fact, the young age of the population of Africa is a major factor explaining their small number of deaths. We find IFR=0.13-0.24% for Africa, compared to IFR=0.8-1.4% in Europe, a ~5-fold difference!

5/n
Using ENE-COVID data from June 2020, our code accurately predicts an overall IFR of 0.669% in the United States.

This is very close to the last 2 estimates from the US CDC:
- 0.65% published in July 2020 web.archive.org/web/2020071205…
- 0.738% calculated from their Sep 2020 update

6/n
Head over to github.com/mbevand/covid1… for full documentation and results table

7/n
Here's a summary of the expected overall IFR for each continent.

The youngest continents should fare the best, thanks to their young population:

8/n
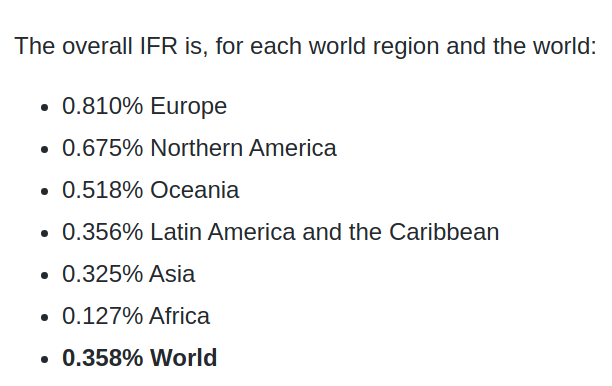
Finally, the real-world overall IFR will dependent on many factors: varying prevalence among age groups, underlying health conditions, access to healthcare, socioeconomic status, ethnicity, etc.

But I expect the age of the population to be one of the most important factors.

9/n

• • •

Missing some Tweet in this thread? You can try to force a refresh
 

Keep Current with Marc Bevand

Marc Bevand Profile picture

Stay in touch and get notified when new unrolls are available from this author!

Read all threads

This Thread may be Removed Anytime!

PDF

Twitter may remove this content at anytime! Save it as PDF for later use!

Try unrolling a thread yourself!

how to unroll video
  1. Follow @ThreadReaderApp to mention us!

  2. From a Twitter thread mention us with a keyword "unroll"
@threadreaderapp unroll

Practice here first or read more on our help page!

More from @zorinaq

May 3, 2022
Alex Berenson argues in alexberenson.substack.com/p/one-covid-ch… that Sweden had the best Covid strategy

Let's point out numerous obvious flaws in his analysis, shall we?

1/n
Firstly, Berenson chooses to ignore Asian countries. Why? Because geography is "the most important factor in how hard Covid hits a country"

In other words: "countries who did better than Sweden don't count, because, well, I sAy So"

Such well-reasoned logic. Much wow 🤣

2/n
Secondly, he claims geography is the most important factor, but IGNORES ALL the countries geographically close to Sweden: Finland, Norway, Denmark (none of them are charted)

This self-inconsistency is 100% expected from The Pandemic’s Wrongest Man
theatlantic.com/ideas/archive/…

3/n
Read 9 tweets
Mar 8, 2022
I modeled excess deaths per capita by age group, for each US state, since the beginning of the pandemic.

I believe this is the first time an analysis of this type has been done BY AGE GROUP for each state. This removes the need to do "age-adjustment" to compare states.

1/n
Methodology, data, and source code are available on GitHub: github.com/mbevand/excess…

The raw numerical output, with excess deaths per age group are in this CSV file: github.com/mbevand/excess…

Charts follow:

2/n
Excess deaths per capita for ages 85+

3/n
Read 13 tweets
Mar 1, 2022
Mask usage correlates with lower deaths

Based on NYT's mask survey across United States counties, plot deaths/capita recorded during the survey & up to 30 days later, along with each county's mask wearing score

Result:
Linear regression (Y log-transformed) R²=0.144 in red:
There are hundreds of factors affecting the dependent variable (deaths). Ignoring ALL of these factors, looking at mask usage only, and still finding R²=0.144 is pretty cool/unexpected

Confounders abound!: people who wear masks often are likely doing more social-distancing. Etc.
Methodology behind the chart:

Two data sources:
- mask wearing survey github.com/nytimes/covid-…
- COVID deaths (and population) by US county as per JHU CSSE
Read 6 tweets
Feb 8, 2022
A little thread on the Great Disinformer @ianmSC

Why Real Science™ isn't done with MSPaint charts.

His charts seem to claim that nothing works. Locking down doesn't work, masking doesn't work, vaccination doesn't work, your printer doesn't wo—wait scratch that one

1/n
One iota of critical thinking is all you need to expose numerous errors in his charts:

Error #1 — Case ascertainment rate bias:

A country may detect 1 in 2 cases, while another 1 in 4. We say the case ascertainment rate is respectively 50%, and 25%.
This variance in case ascertainment rate alone is enough to put half of @ianmSC's charts where they belong: in the trash🗑️

Real Science™ looks at covid deaths—not cases—to compare the severity of the pandemic across different regions. This avoids case ascertainment rate bias.
Read 12 tweets
Feb 7, 2022
I compiled a list—as exhaustive as possible—of all peer-reviewed & published research articles that evaluate the effectiveness of nonpharmaceutical interventions, specifically lockdowns on COVID-19

➡️Papers finding NPIs effective outnumber, by 8 to 1, those finding the opposite
Criteria for inclusion in the list:

1-Be a RESEARCH ARTICLE (data, methods, results). Commentaries, opinion pieces, etc, do not qualify

2-Be PEER-REVIEWED & PUBLISHED among the 26,000 titles in Scopus

3-Be EXPLICIT. No secondhand interpretation of the data
Regarding criterion #3: the authors must explicitly state in the text whether their results suggest NPIs are effective or not

Their exact words have been peer-reviewed & published. Your interpretation of figures or data tables has not.
Read 61 tweets
Jan 24, 2022
Heads of government who have died of COVID-19

Confirmed:
1. Prime Minister of Eswatini, Ambrose Mandvulo Dlamini

Suspected:
2. President of Burundi, Pierre Nkurunziza
3. President of Tanzania, John Magufuli
4. Prime Minister of Ivory Coast, Hamed Bakayoko
1. Prime Minister of Eswatini tested positive on 15 Nov 2020, was hospitalized 8 days later, and died on 13 Dec.

bnonews.com/index.php/2020…
2. President of Burundi died on 8 June 2020. The cause of death was given officially as "cardiac arrest" by the Burundian government, but is suspected to be COVID: economist.com/middle-east-an…

His wife was flown to Kenya and hospitalized for COVID a week before his death.
Read 5 tweets

Did Thread Reader help you today?

Support us! We are indie developers!


This site is made by just two indie developers on a laptop doing marketing, support and development! Read more about the story.

Become a Premium Member ($3/month or $30/year) and get exclusive features!

Become Premium

Don't want to be a Premium member but still want to support us?

Make a small donation by buying us coffee ($5) or help with server cost ($10)

Donate via Paypal

Or Donate anonymously using crypto!

Ethereum

0xfe58350B80634f60Fa6Dc149a72b4DFbc17D341E copy

Bitcoin

3ATGMxNzCUFzxpMCHL5sWSt4DVtS8UqXpi copy

Thank you for your support!

Follow Us!

:(