A few people asked me about the accuracy of a recent NY Times Magazine / NY Times Daily Podcast story “How Climate Migration Will Reshape America”. It contains plenty of interesting discussion on e.g., property insurance under a changing climate BUT…
nytimes.com/interactive/20…
nytimes.com/interactive/20…
It is VERY loose with the facts on current climate change in the US and it continuously errs on the side of hyperbole and exaggeration. I wrote a quick blog response and have reproduced some content from that below. patricktbrown.org/2020/10/03/cla…
I take a look at some observational data corresponding to some of the claims in the article. Overall, I think the actual data gives a VERY different impression of the state of climate change in the US than does the rhetoric of the piece.
This is important because this kind of exaggeration undermines the credibility of the NY Times / NY Times Daily Podcast at a time when people really need journalism they can trust.
Furthermore, the issue of human migration under climate change is important and thus it needs to be covered in a serious and fact-based way. We cannot afford for this kind of sloppiness to give people an excuse to dismiss the entire premise.
Most of the piece’s claims are about the future. It is obviously difficult to fact-check claims about the future so I will just look at a few claims that can be easily put in context against observational data.
Claim: “August besieged California with a heat unseen in generations.”
Context on CA heat: August 2020 was the fourth hottest month on record in California. Its average temperature was 79°F. Not as hot as July 2018 (79.6°F), July 2006 (79.3°F), or July 1931 (79.5°F). So it was hot but not “unseen in generations”. 

Claim: “I am far from the only American facing such questions. This summer has seen more fires, more heat, more storms — all of it making life increasingly untenable in larger areas of the nation”
Context on fires: The nation has not seen more fires through August but when September numbers are tallied this will indeed go up and likely will set a record. Though it is important to note that there is not an obvious nationwide long-term trend in wildfires.

Context on US heat: It is true that this summer was hot in the US. It was the 4th warmest on record behind 2011, 2012 and 1936.

More context on heat: Rather than looking at summer means, we can look at indices that measure attributes of heatwaves like the “Warm Spell Duration Index”. Here’s what that looks like for the US. The 1920s and 1930s had higher values than what we have seen recently.

Context on storms: It is not clear what is meant by storms. But maximum 1-day precipitation might be a pretty good proxy for what most people think of as storms. There have been increases in this metric over recent decades but we are not at a historical maxima:

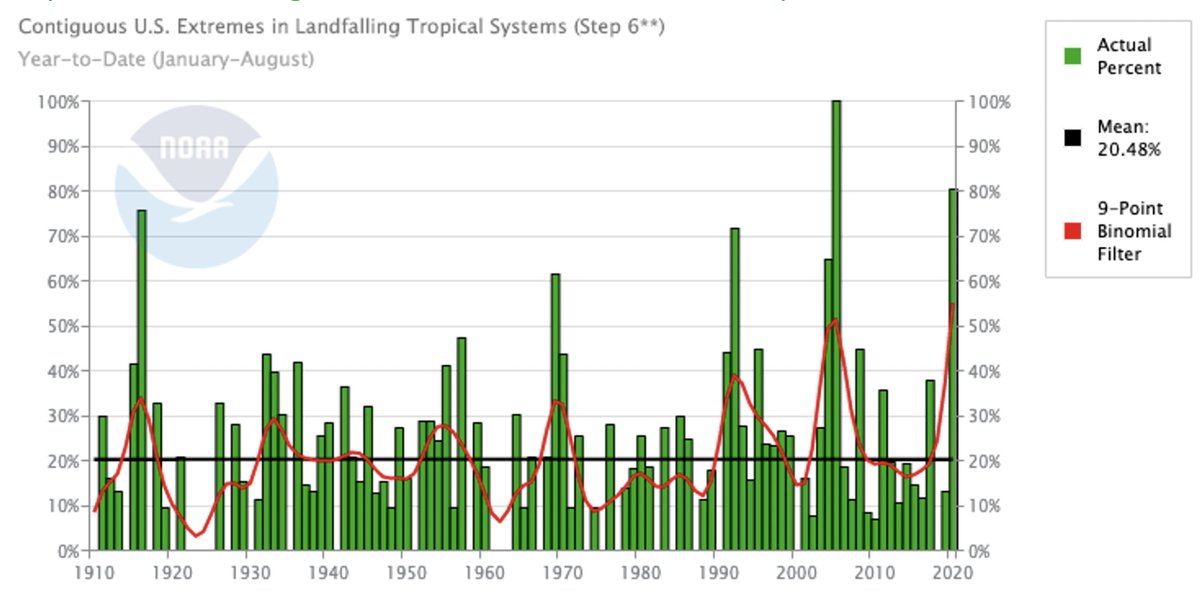
More context on storms: The author could also be referring to tropical storms: here is a measure of tropical storms making landfall in the United States. Some upward movement here:
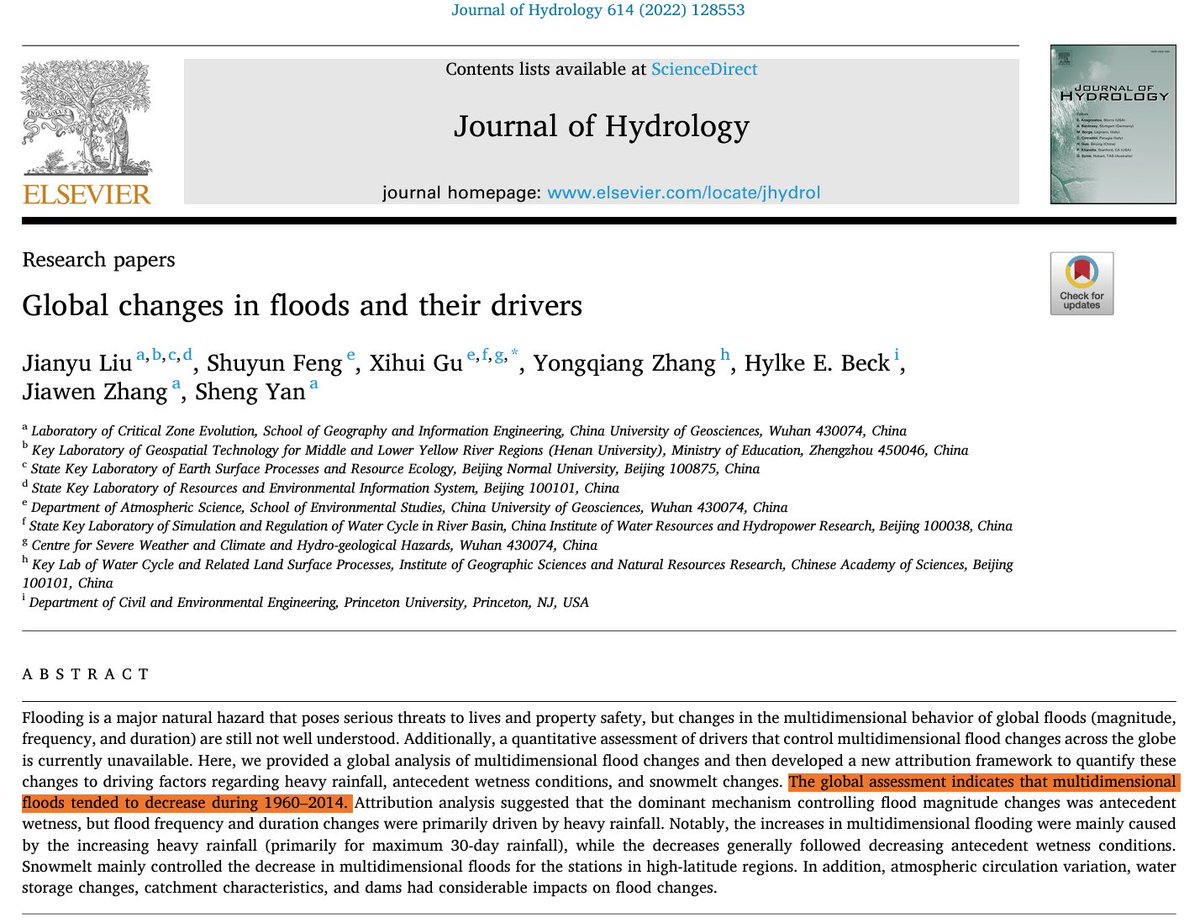
Claim: “while destructive floods inundate towns and fields from the Dakotas to Maryland”
Context on floods: Here is the long-term change in an index of maximum 5-day precipitation. While not a direct measure of floods, this can be thought of as a rough proxy. By this measure, we are not currently at a historical maxima.

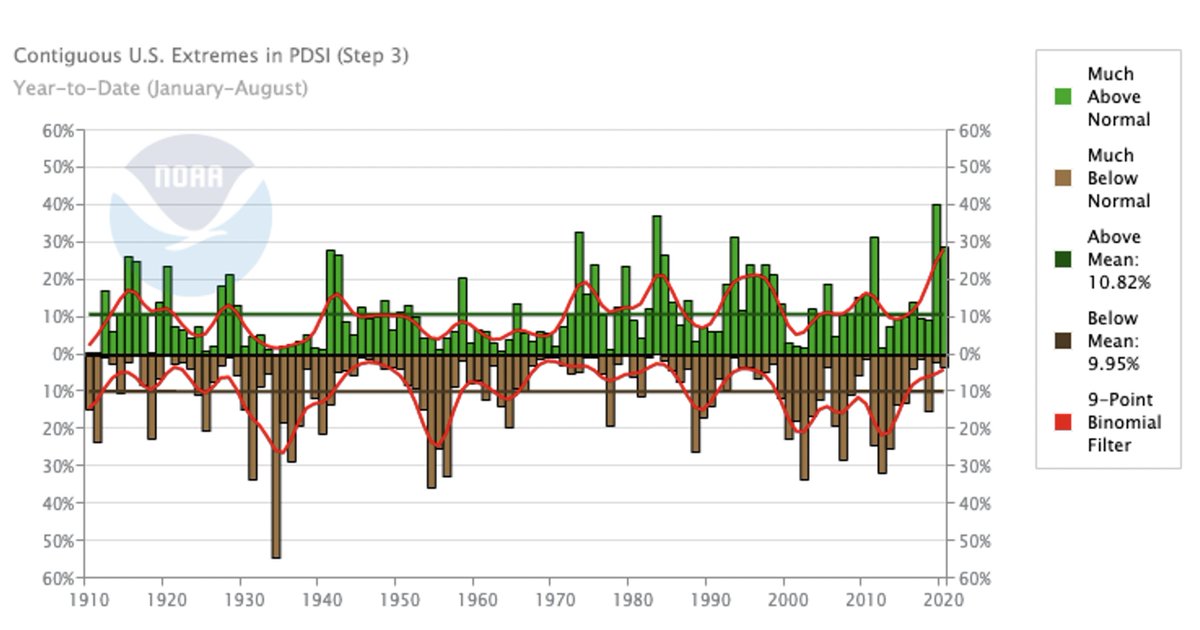
Claim: “Already, droughts regularly threaten food crops across the West…”
Context on droughts: The brown bars are the area in the US West (left) and US (right) that are much more arid than normal. The US West has indeed seen bad droughts in the 2000s and 2010s. It is worth noting that we do not see long-term trends in droughts over the US overall.

Claim: “Let’s start with some basics. Across the country, it’s going to get hot. Buffalo may feel in a few decades like Tempe, Ariz., does today”
Context: This is absolutely false. The average daily high temperature in July in Buffalo NY is near 79°F. The average daily high temperature in July in Tempe Arizona is near 106°F. That’s a 27°F difference.


Buffalo is projected to warm by roughly 2.3°F under a medium emissions scenario by 2050 (and by 5°F by 2100). So that would mean that the author claimed a warming of something like 27°F “in a few decades” when our best estimate is something closer to 10% of that.

I could go on but you should get the idea. It paints a picture of current climate change in the US that is very different than the story that is told from looking at the actual data and all the errors are in the direction of overstating the negative impact on the US today.
The editors at NY Times Magazine / The Daily Podcast must think that being cavalier with the facts is OK because ‘sending the right message’ on climate change is more important than accuracy. I could not disagree more.
At a time when trust in institutions like the New York times is faltering, and the right calls them fake news – they cannot afford to confirm that narrative. It makes it too easy for those who want to be dismissive of climate change to feel vindicated in that belief.
• • •
Missing some Tweet in this thread? You can try to
force a refresh