Random Critical Analysis Profile picture
Oct 5, 2020 18 tweets 5 min read Read on X
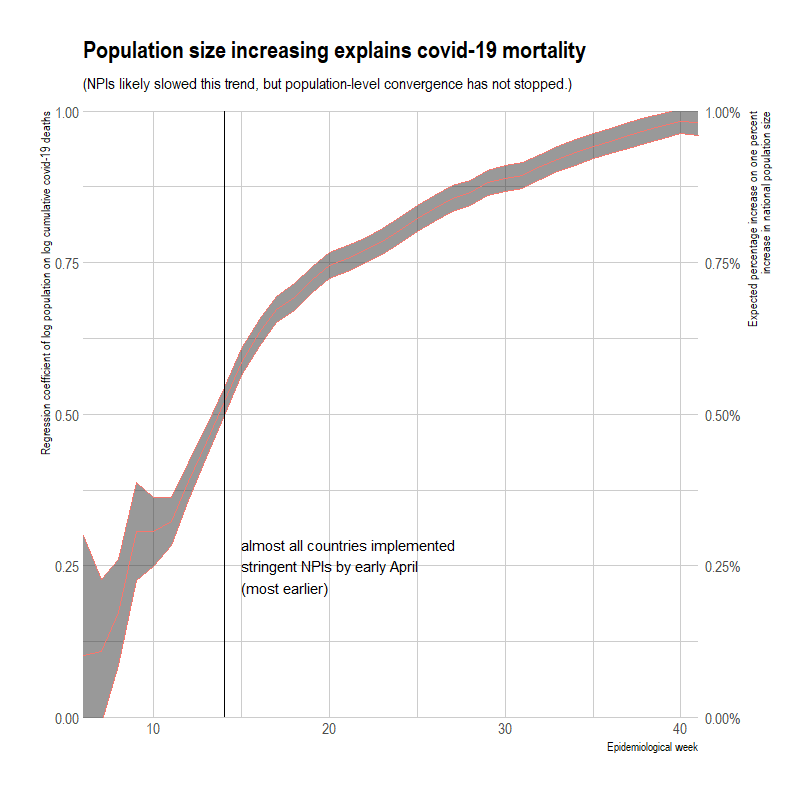
There has been substantial convergence of covid-19 deaths. Image
In heatmap form with exponential color steps
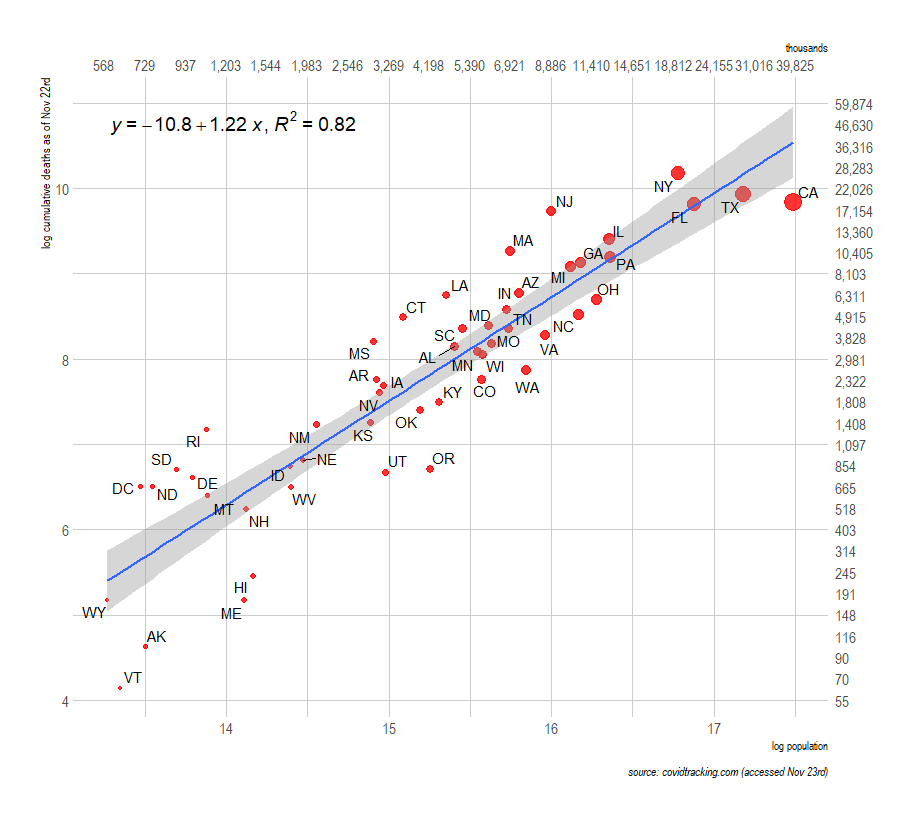
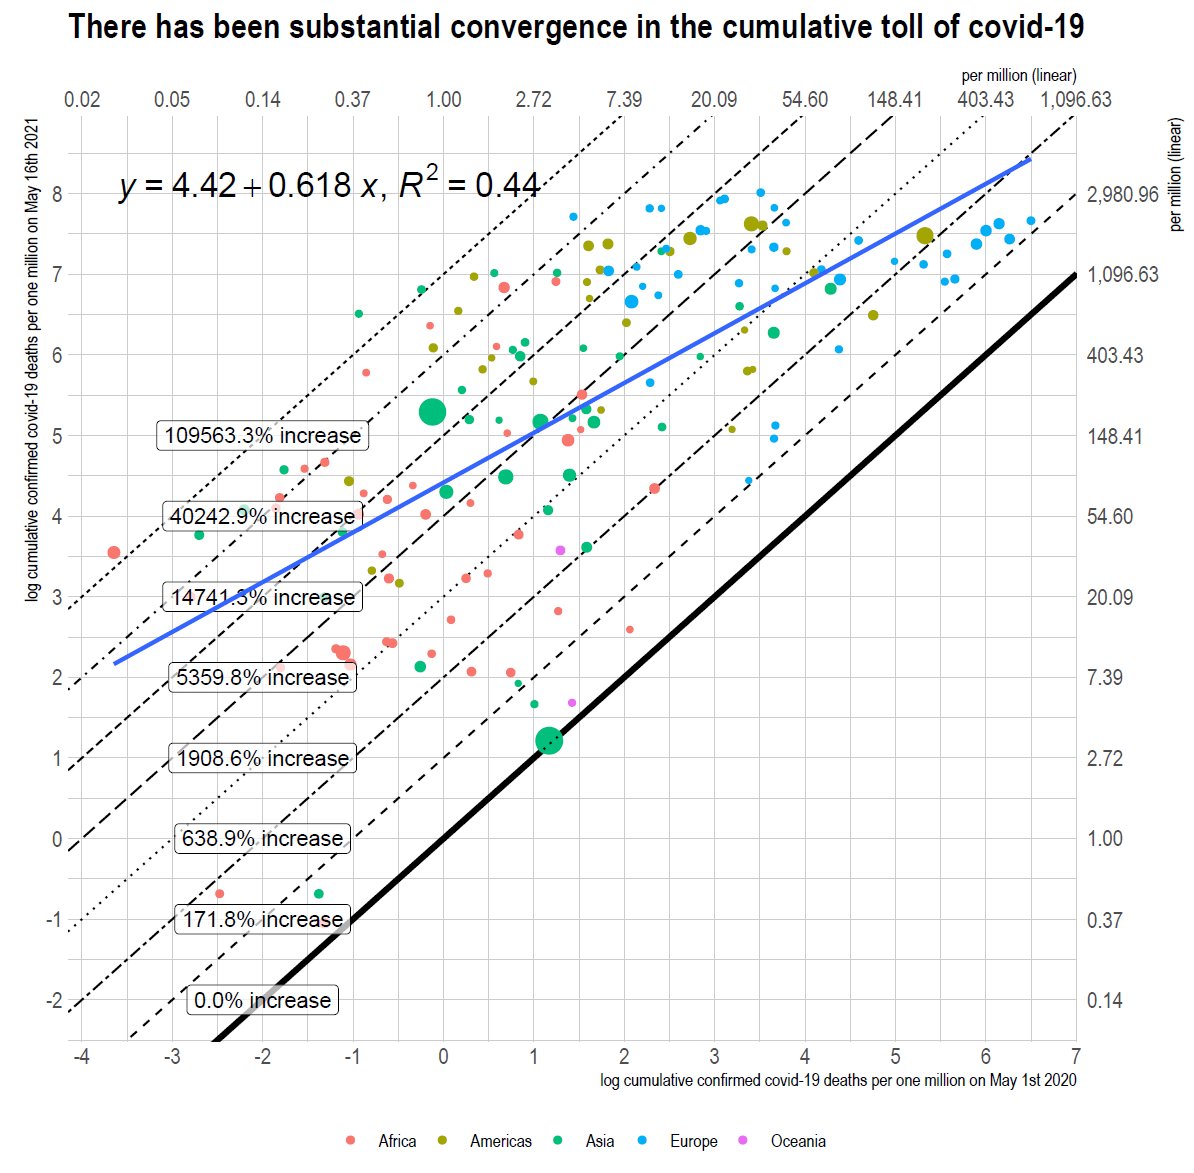
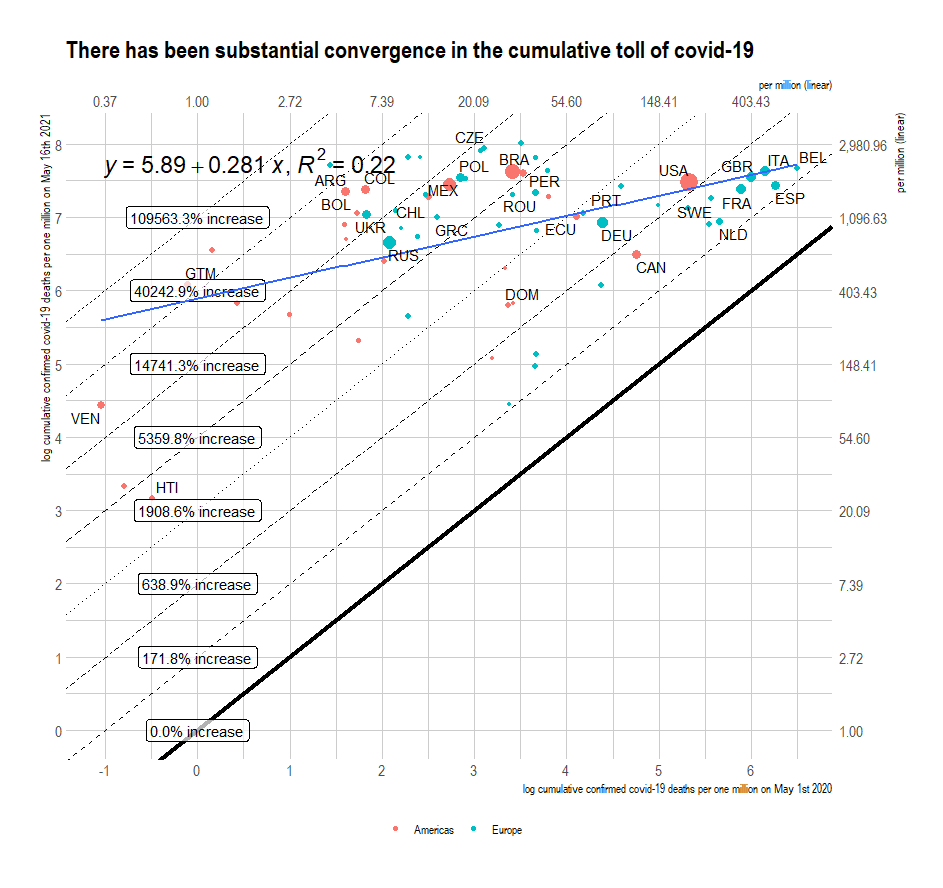
 Image
In regression terms Image
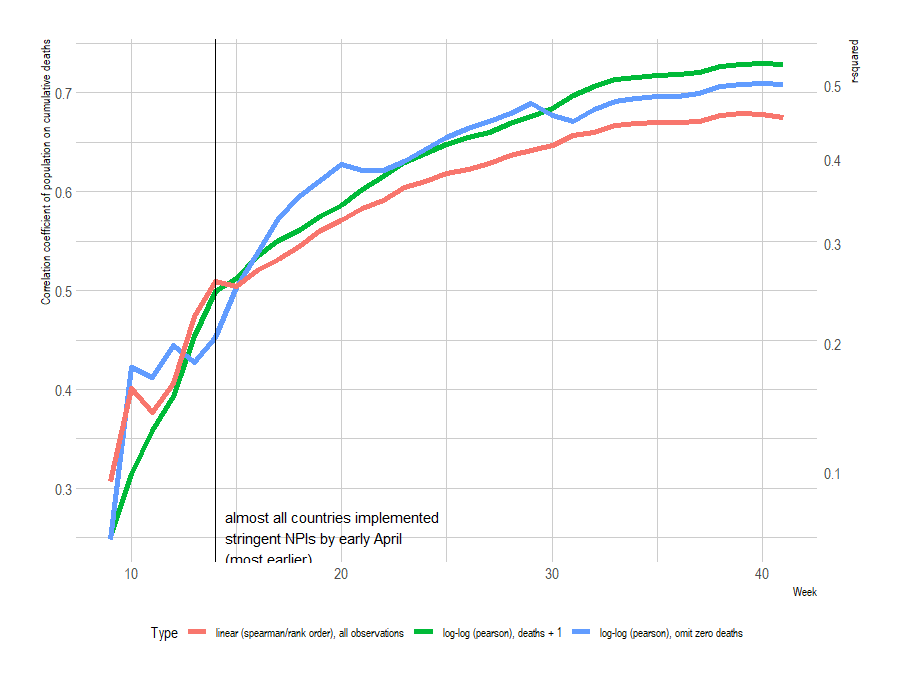
In correlational terms Image
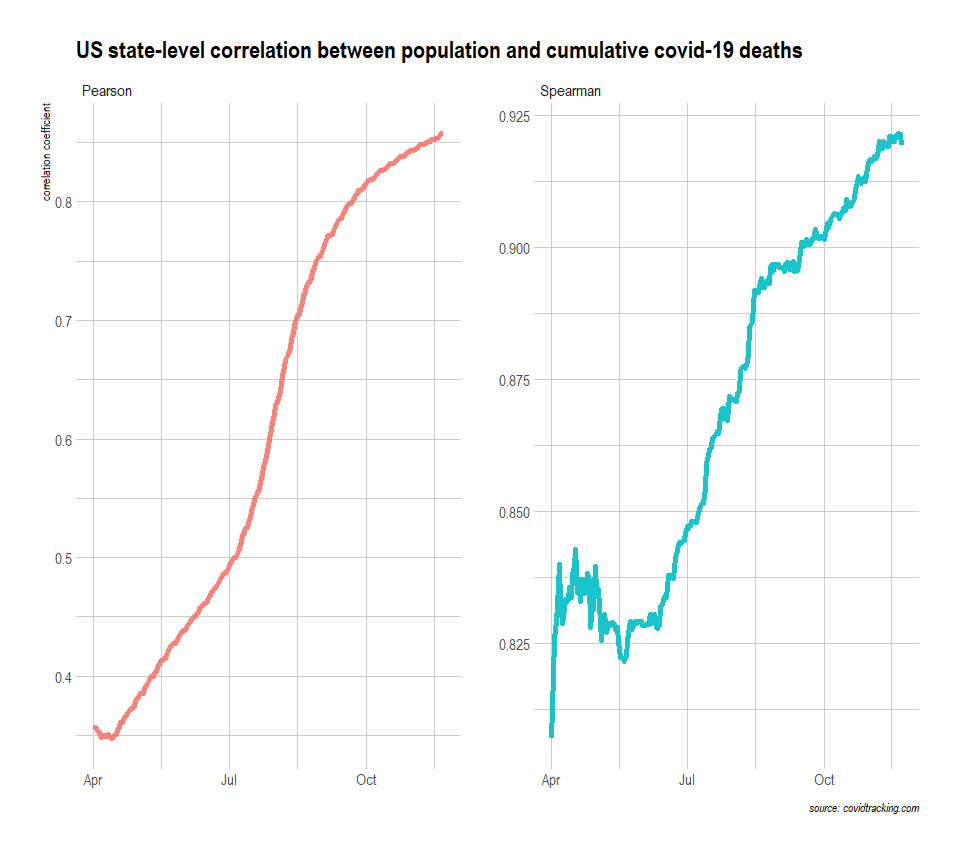
Pearson without log transformation. The initial correlation was negligible since cumulative deaths were very much overdispersed at the outset. Still is, but less and less as time passes. Image
US state-level correlation between cumulative covid-19 deaths and population Image
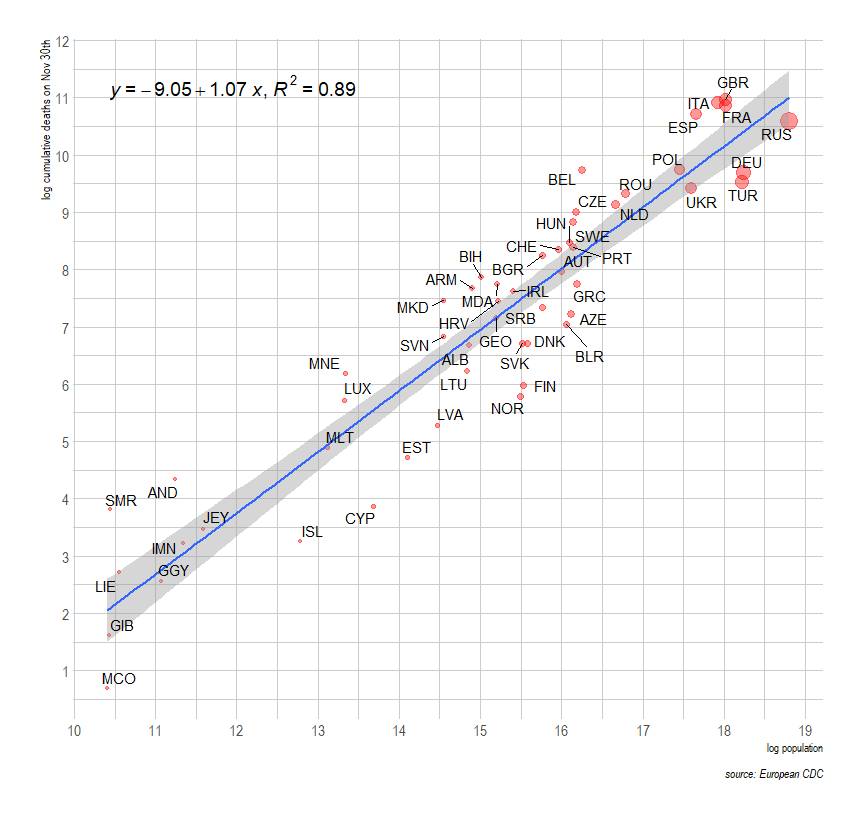
Current cumulative deaths versus population Image
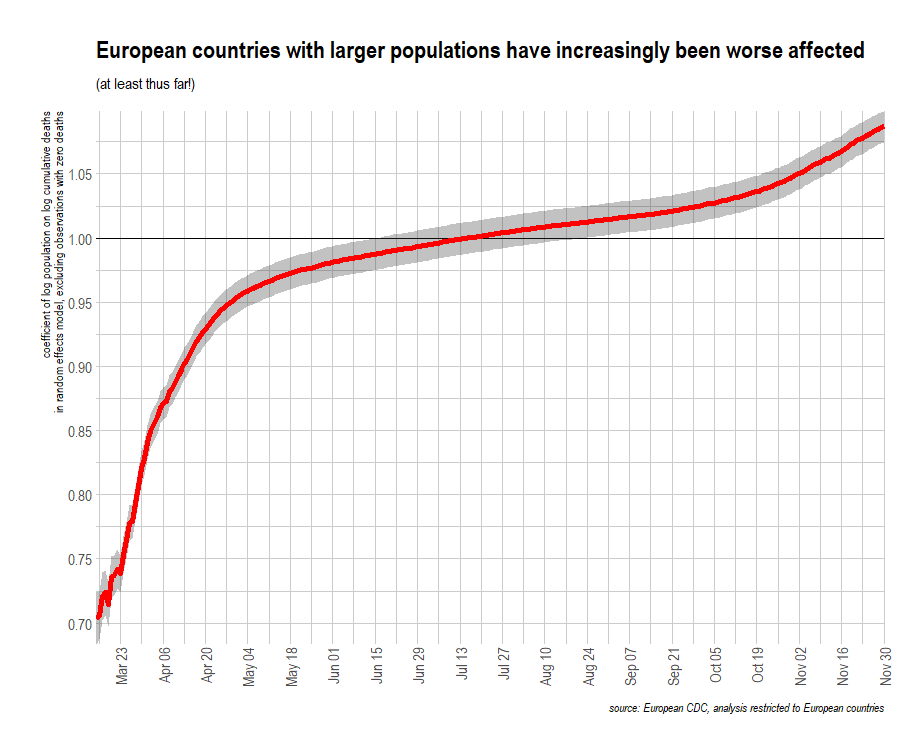
Europe continues to converge vis-a-vis cumulative covid-19 deaths and population. Image
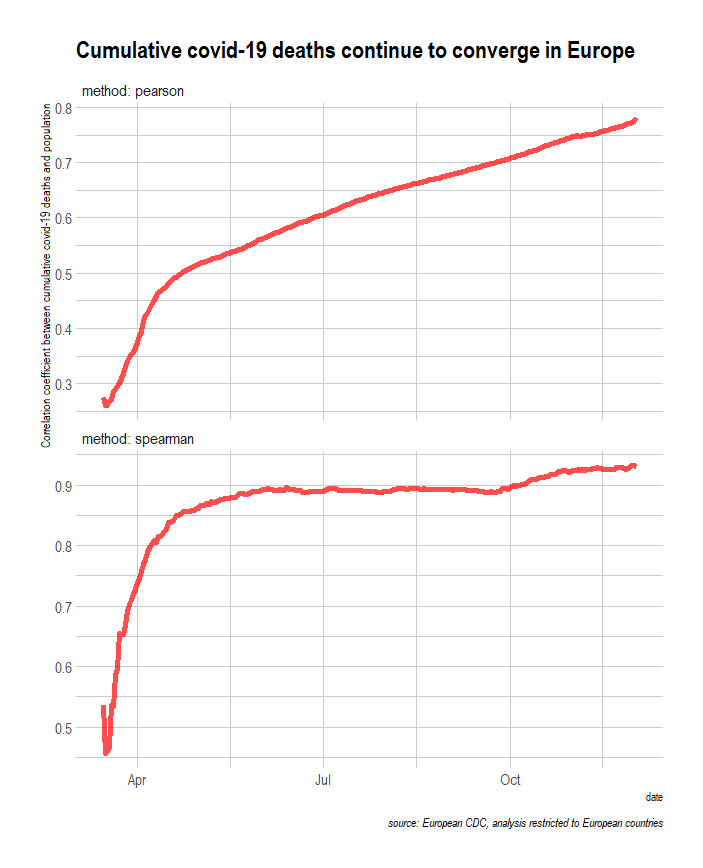
Within Europe, the coefficient of log population on log cumulative deaths crossed unity (>=1) this summer and seems to be trending somewhat higher still. ImageImage
Most metro areas in the US have converged substantially closer to New York City's cumulative covid-19 deaths on a per capita basis. Image
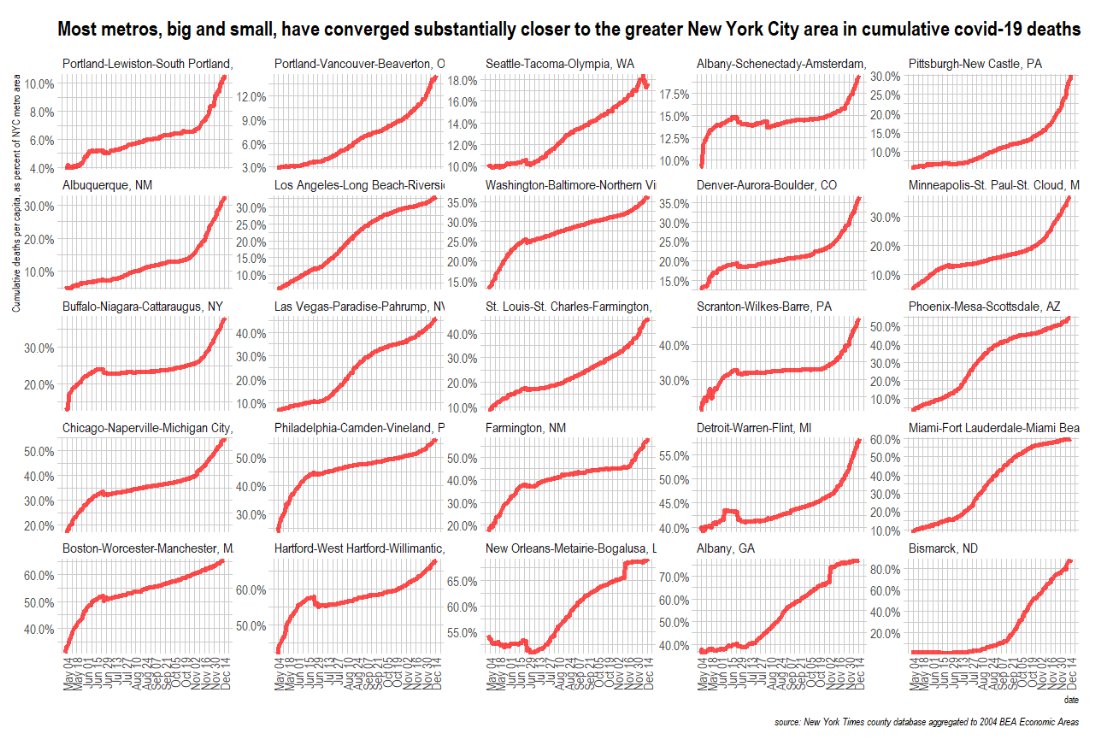
Animated (smaller, more economically peripheral places in the US have substantially converged on the outcomes of larger economies that were generally hit earlier and harder)
Larger populations and economies within the United States and European Union (plus affiliated) affected systematically earlier. Still, there has been substantial subsequent convergence at multiple levels.
Updated and on an entirely per capita basis....
Likewise, but with total GDP (b/c gravity model, tho the coefficient on per capita income clearly significant)
Between May 1st of last year and today, pretty much all countries saw large increases in cumulative covid-19 mortality, with initially less affected countries experiencing more growth (esp. within Europe and the Americas) Image
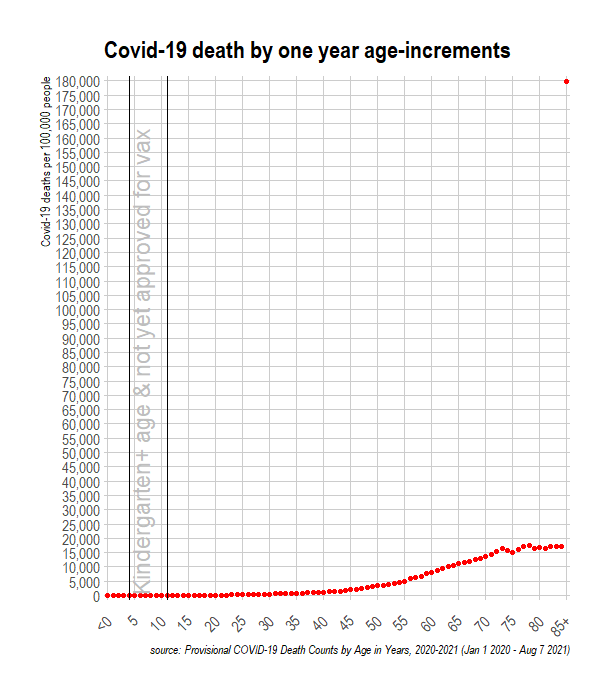
The convergence process is surely more pronounced in age-conditional terms, as it hit larger, higher-income economies first, which skew quite a bit older.
(Never mind the issues with accurately detecting and reporting covid deaths as covid deaths and other factors like climate....)
Same plot, but just for the Americas and Europe Image

• • •

Missing some Tweet in this thread? You can try to force a refresh
 

Keep Current with Random Critical Analysis

Random Critical Analysis Profile picture

Stay in touch and get notified when new unrolls are available from this author!

Read all threads

This Thread may be Removed Anytime!

PDF

Twitter may remove this content at anytime! Save it as PDF for later use!

Try unrolling a thread yourself!

how to unroll video
  1. Follow @ThreadReaderApp to mention us!

  2. From a Twitter thread mention us with a keyword "unroll"
@threadreaderapp unroll

Practice here first or read more on our help page!

More from @rcafdm

May 6, 2022
I am not the least bit interested in litigating Roe v. Wade or its implications, but two quick points here.
1) When traditional methods used in US & UK missed >50% maternal mort. & UK is *still* reporting low num to OECD, we should be even more cautious about making direct comparisons to countries w/ worse capacity & investment here
cdc.gov/nchs/data/nvsr…

npeu.ox.ac.uk/assets/downloa…
(2)The black-white maternal mortality rate ratios in UK are actually higher than US (~4x vs ~2.5x). I wouldn't be so quick to assume structural racism explains much or that the US disparities along this line are actually worse.
Read 4 tweets
Aug 30, 2021
The idea that the obesity epidemic started in 1980 is poorly evidenced and runs contrary to a lot of evidence.
The non-linear relationship between body fatness and BMI will tend to make observed obesity rates accelerate even if mean body fat increases at a constant rate and the variance remains constant (BF variance v. likely has increased, but less than BMI would naively suggest) Image
As the BMI distribution shifts right due to very real increases in % body fat across the distribution, the mean & variance increase faster than body fatness does thanks in large part to this artifact of BMIs construction. These effects are particularly evident at the thresholds. Image
Read 23 tweets
Aug 17, 2021
US covid-19 death rate in one-year age-increments Image
On a linear scale, since some people asked. The rates amongst the elderly make differences amongst those ~<40 basically invisible. Image
Counts Image
Read 14 tweets
Jul 6, 2021
The case fatality rate in the UK continues to decline. Image
Still falling Image
Still Image
Read 31 tweets
Apr 18, 2020
Some early and somewhat unintuitive results from something I've been working on. the distribution of people in gridded population cells by country (~1 km^2)
I think I estimated this correctly (if the data is basically correct), but Germany is somewhat surprising
Read 4 tweets
Jan 31, 2020
I just created a primer to summarize my research on health care (the many ways in which conventional wisdom is wrong). Much of this content was previously spread across several posts, and some of it is new.

randomcriticalanalysis.com/why-convention…
Health care is a national 'necessity' they say....
Biomedical engineer density increases as well (WHO's choice of indicator, not mine)

who.int/data/gho/indic…
Read 10 tweets

Did Thread Reader help you today?

Support us! We are indie developers!


This site is made by just two indie developers on a laptop doing marketing, support and development! Read more about the story.

Become a Premium Member ($3/month or $30/year) and get exclusive features!

Become Premium

Don't want to be a Premium member but still want to support us?

Make a small donation by buying us coffee ($5) or help with server cost ($10)

Donate via Paypal

Or Donate anonymously using crypto!

Ethereum

0xfe58350B80634f60Fa6Dc149a72b4DFbc17D341E copy

Bitcoin

3ATGMxNzCUFzxpMCHL5sWSt4DVtS8UqXpi copy

Thank you for your support!

Follow Us!

:(