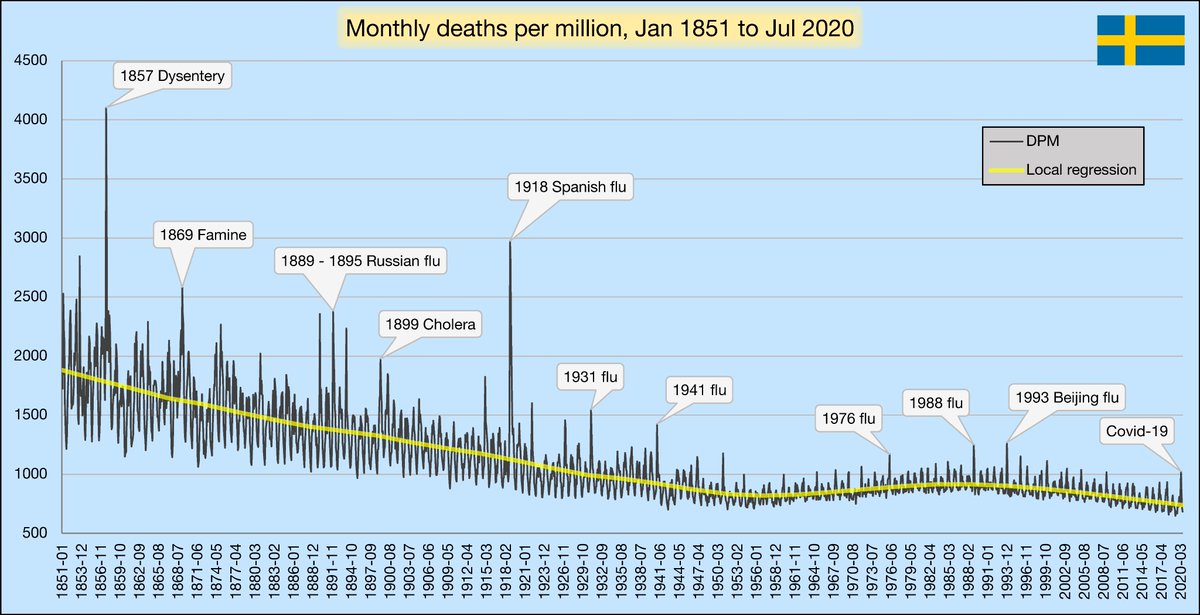
We can't understand the present if we don't understand the past.
In this thread, you'll see what the past 120 years looked like for the USA. The source data is all available on the CDC website, though it was a real pain to aggregate. This chart shows monthly DPM since 1900:
In this thread, you'll see what the past 120 years looked like for the USA. The source data is all available on the CDC website, though it was a real pain to aggregate. This chart shows monthly DPM since 1900:

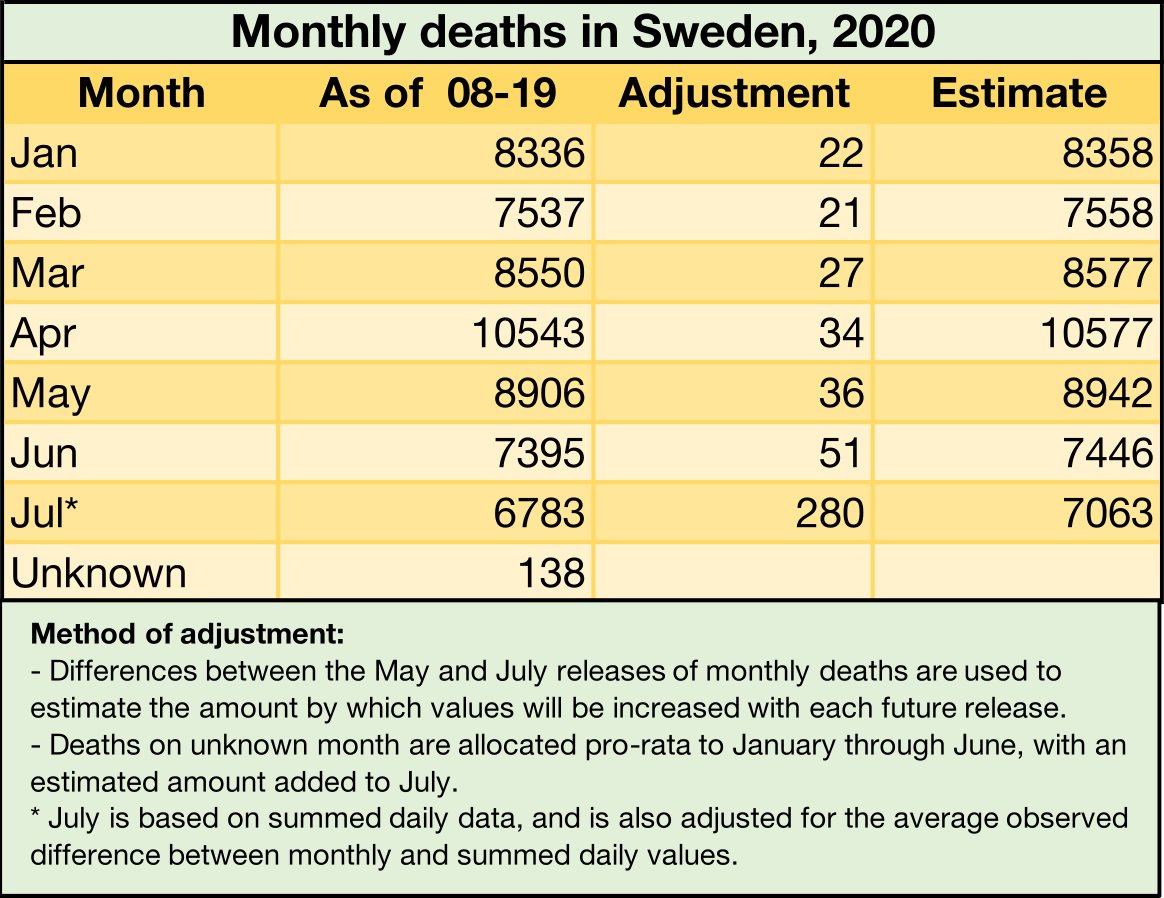
These are the values I used for 2020. They were implied from weekly counts retrieved on Oct 3, so the vast majority of deaths should be registered for Jan-Aug. Future adjustments shouldn't impact the overall picture.

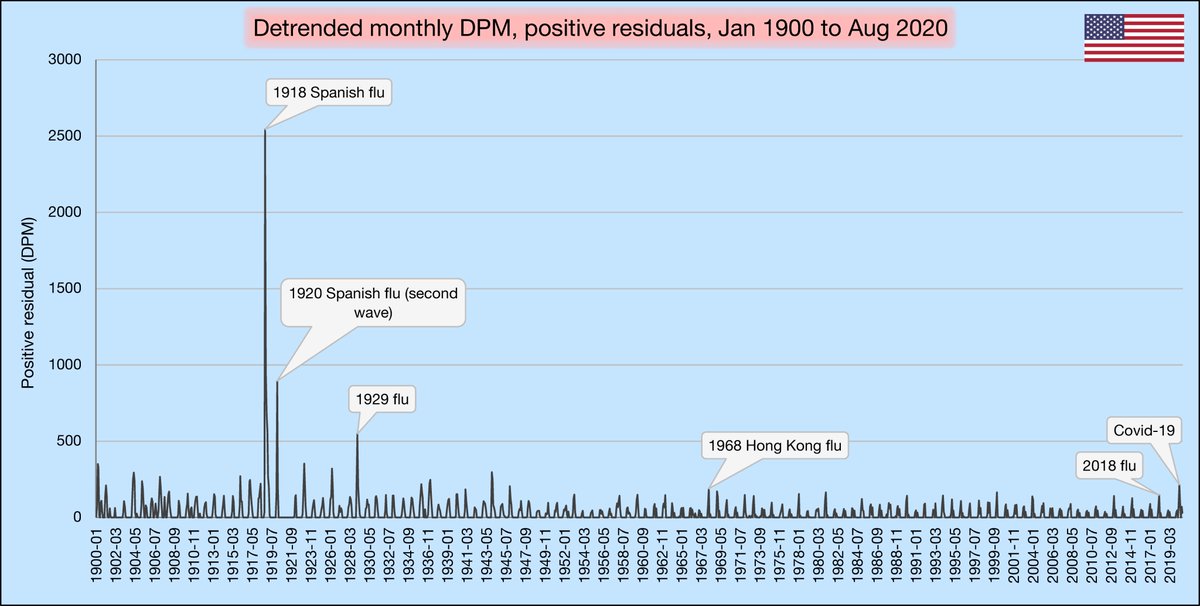
The red line you saw is called a LOESS regression. It's like a moving average, but more robust and tracks better with the center. It measures our changing expectation of mortality. Here we see only the positive differences (residuals) between the DPM and the red line:
This chart shows the residuals from the previous chart, but summed for each year from Aug till next July (12 months). Most bad months happen in the winter, so these values reflect how severe a season has been.

Here we see deaths/million for each Aug-Jul period. Roughly, this reflects the chance of the average American dying during the period. Note the alarming climb since the 2008 financial crisis - it's the only time there's been an upwards trend for at least 120 years.

These are the positive residuals from the previous chart after removing the overall trend. We can see by how much a period has exceeded the trend. The meaning is very similar to that of the chart in tweet 4.

Adjusting for population doesn't give a full picture. Age adjustment shows what each year would have looked like if it happened to a population with the same age profile. I use the population of 2000. We see a very different picture to that of the crude death rates.

Monthly figures aren't available by age group that far back, so I made an estimate by weighting by the proportion of all deaths in each month, per year. It's not perfect, but it should be close. Conditions have improved dramatically since 1900.

Finally, I'll sum the values from the previous chart for each Aug-Jul period so we can see what the known half of 2020 looks like relative to the past.

I hope this information gives you some perspective on what we're dealing with today. The conditions our ancestors dealt with daily were much harsher than even the worst of Covid-19.
We need to confront hardship with their strength and make sure we don't create horrible unintended consequences. I fear it may be too late for that, but it's not too late to change course and adapt to changing circumstances.
• • •
Missing some Tweet in this thread? You can try to
force a refresh