"Measure twice, cut once" is bullshit.
A brief thread rant on woodworking and causal inference (yeah, you read that right).
From table legs to descriptive stats tables, from picture frames to the framing the big picture for studies. It's gonna get weird, but stick with me.
A brief thread rant on woodworking and causal inference (yeah, you read that right).
From table legs to descriptive stats tables, from picture frames to the framing the big picture for studies. It's gonna get weird, but stick with me.
Let's say you want to make a very simple table. Easy! 4 legs cut to the same length and flat top. Step 1: cut those legs.
So, you take your leg material, and you carefully measure (twice) 26," mark it, and make your cut.
And no matter how careful you were, they don't match.
So, you take your leg material, and you carefully measure (twice) 26," mark it, and make your cut.
And no matter how careful you were, they don't match.
You might think that you didn't measure carefully enough, or cut straight enough. I promise that's not the problem.
The problem is that you were thinking about the problem the wrong way. Because unless you are a pro, measure twice cut once will NEVER get them to match.
The problem is that you were thinking about the problem the wrong way. Because unless you are a pro, measure twice cut once will NEVER get them to match.
Measure twice cut once (MTCO) is the solution if you want all 4 legs to be as close to 26" as you can. But that's not actually what you want.
What you want is that all 4 legs are exactly EQUAL to each other somewhere around 26." You have the wrong objective.
What you want is that all 4 legs are exactly EQUAL to each other somewhere around 26." You have the wrong objective.
In woodwork, the general solution to this is to make a quick "jig" (something to help you make a cut). Put a block ~26" from saw blade, put leg #1 against the stop block, make your cut, and repeat, without moving the stop block.
Boom, 4 legs, exactly equal.
Boom, 4 legs, exactly equal.
In causal inference, we are dealing with a very similar problem. We have a TON of variables we have to deal with, where any one particular thing throws off our results.
One solution is to very, very carefully examine the problem and map (measure) it out.
One solution is to very, very carefully examine the problem and map (measure) it out.
You think about all the variables and how they all fit together and how to control for them. Can often be done with the right skills and tools, but it's really hard.
I prefer to think about things a bit differently, and set things up so that I never have to measure.
I prefer to think about things a bit differently, and set things up so that I never have to measure.
That's the general idea behind a lot of the methods in what I like to call the avoidance by design strategy for causal inference.
The biggest of these strategies is the RCT. But back to wood for a second.
Time for picture frames.
The biggest of these strategies is the RCT. But back to wood for a second.
Time for picture frames.
Picture frames are usually 4 pieces of wood, where the ends are cut to 45 degrees. When you put it together, it's a rectangle.
You can try and measure out and trace 45 degrees, but again, you failed before you started. Wrong goal, wrong method.
You can try and measure out and trace 45 degrees, but again, you failed before you started. Wrong goal, wrong method.

Instead, one way to "fix" things is cutting against a jig that you know is 90 degrees, turned so it's ~45 degrees from your cat. Cut one side of the joint on one side of that jig, and the other side on the other.
Even if your jig isn't exactly 45, the two errors cancel out.
Even if your jig isn't exactly 45, the two errors cancel out.
That's the miracle of the randomized controlled trial: you expect the all of those issues to cancel each other out and become statistical error. Statistical error is WAY better than the more common use of the term error.
You might think, well, maybe I should check?
You might think, well, maybe I should check?
Let's see if the sides (trial arms) are equally 45 degrees (or demograhics or whatever), and test it in table 1 (see what I did there) with a p-value.
But that's the wrong objective, because you don't actually care about that; it doesn't really matter if they're off.
But that's the wrong objective, because you don't actually care about that; it doesn't really matter if they're off.
You've set the system up (randomization) so that you can get the right answer even if things look wonky when you measure them.
Measuring closer to 45 (analogous to carefully controlling for baseline vars) gets you some extra precision, but that's just bonus points.
Measuring closer to 45 (analogous to carefully controlling for baseline vars) gets you some extra precision, but that's just bonus points.
Sometimes, you have to measure and there is no clever way around it through an RCT, instrument, or whatever, and you just have to measure. And sometimes jigs don't work like you think they should.
That can be fine, depending on what you're building.
That can be fine, depending on what you're building.
Personally, I avoid measuring always, just like I avoid controlling for stuff. I really really don't like it when tables are all wobbly,, and I'd rather set myself up for success.
Sometimes that means I can't always build the thing I want to. That's ok too.
Sometimes that means I can't always build the thing I want to. That's ok too.
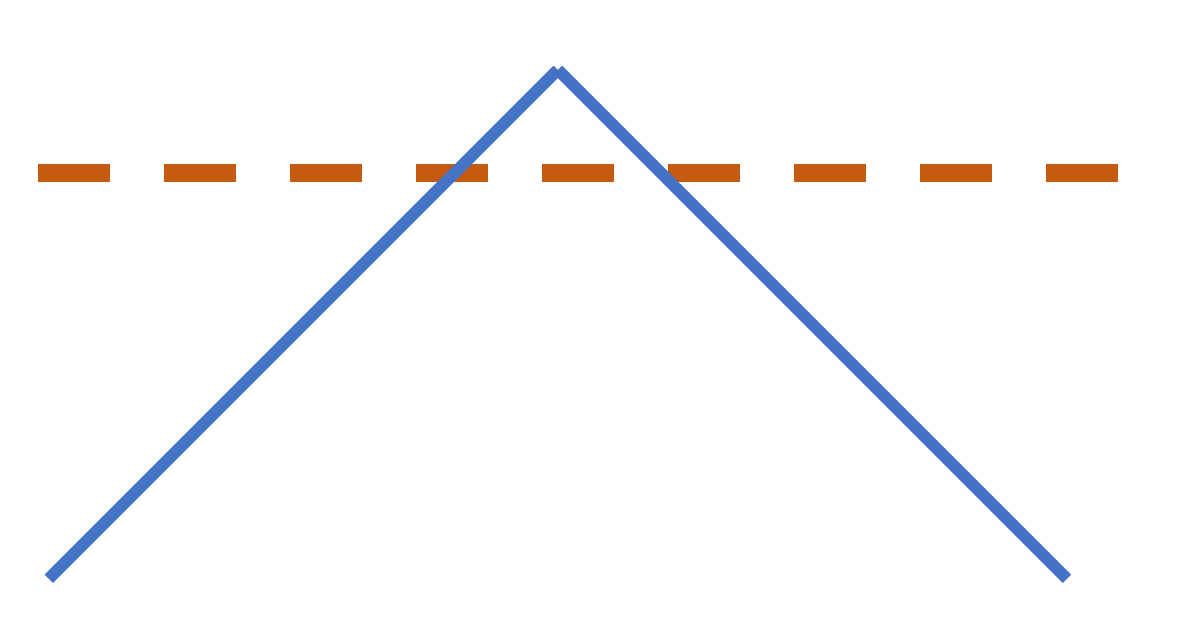
Maybe don't use a cat as a reference, but an illustration of what I mean here. Put piece along horiz line. Cut half of the joint along the left part of the 90 degrees, the other half on the other. It'll end up 90 even if the box isn't 45 to the line.
https://twitter.com/NoahHaber/status/1315310871640506368
Now why is this important? Well, COVID treatments for one.
This is the idea behind why we REALLY need to get good, solid RCT evidence for treatments and vaccines. In those cases, measuring/controlling just ain't gonna cut it, and is one of the reasons HCQ is/was such a debacle.
This is the idea behind why we REALLY need to get good, solid RCT evidence for treatments and vaccines. In those cases, measuring/controlling just ain't gonna cut it, and is one of the reasons HCQ is/was such a debacle.
• • •
Missing some Tweet in this thread? You can try to
force a refresh