Today I decided to do a county bellwether analysis of the 2020 elections based on data from 2000-2016 (5 elections). This data can be downloaded from dataverse.harvard.edu/dataset.xhtml?… This thread (will keep it short) describes my findings so that others can sanity-check. (1/N)
The first step was to filter the county wise data to the Democrat and Republican candidates. This meant excluding Ralph Nader (2000) and Others.
(2/N)
(2/N)
There were 3153 counties in the data, most of them sparsely populated. Of these I filtered out those counties with less than 100,000 votes across Dem and Rep candidates across the 5 cycles. This reduced the number of counties to 968, about a third of the original list.
(3/N)
(3/N)
The winners of 2000/2004/2008/2012/2016 were Bush/Bush/Obama/Obama/Trump. If a candidate got over 50% of the Democrat + Republican votes, then they "win" the county. The next step was to whittle this list of 968 counties further.
(4/N)
(4/N)
Of these 968 counties, 24 counties had consistently picked the winner across the last 5 election cycles. That is, if a candidate won the county, they also won the electoral college.
(5/N)
(5/N)
These counties are sometimes called "bellwethers" by political scientists (I am not one). My selection of bellwethers was constrained by data from the 5 most recent elections (limitation of data source) but that could be a blessing in disguise (recent data more relevant)
(6/N)
(6/N)
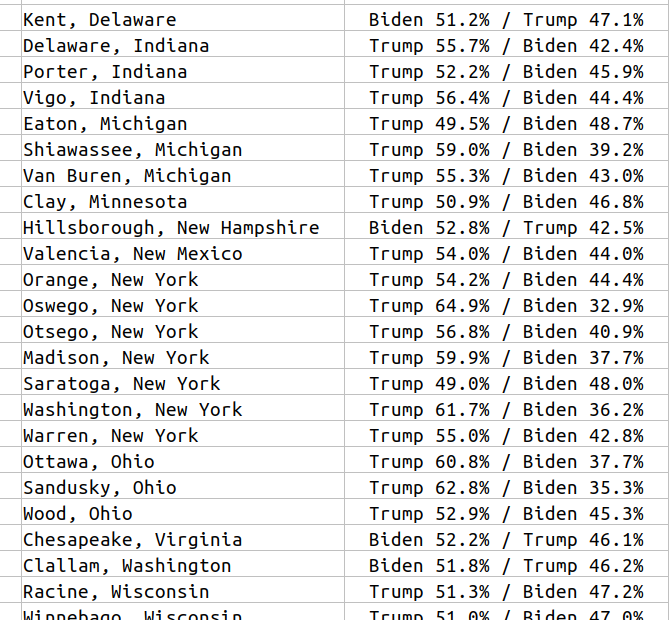
The logical next step was to inspect data from the current 2020 elections for these 24 bellwether counties. Data are available conveniently from the USA Today site and the URLs are identical across states (only the 2 character code changes). For example:
usatoday.com/elections/resu…
usatoday.com/elections/resu…
I copied the percentages for the Winner and the Loser for each the 24 counties manually (these don't add to 100). If there are any transcription errors, I'd like to correct them. 

20/24 of bellwethers predict Trump as the electoral college winner. Very strange anomaly. I did not cherry pick or data snoop. I will post the code once people verify (1) these counties were perfect in 2000-16 and (2) transcription of 2020 results are accurate.
(9/N)
(9/N)
Public Release of code and data and documentation on Nov 8, 2020. You can run the code on your computer even if you are not a developer (just need to install Scala and be familiar with using command line)
github.com/nsram/bellweth…
github.com/nsram/bellweth…
• • •
Missing some Tweet in this thread? You can try to
force a refresh


