1/
Sweden mortality in the last two “flu years”:
Oct 2018 – Sep 2019
Oct 2019 – Sep 2020
Inference from trend over 2 decades.
Sweden mortality in the last two “flu years”:
Oct 2018 – Sep 2019
Oct 2019 – Sep 2020
Inference from trend over 2 decades.
2/
Preliminaries:
Annual statistics usually computed by Gregorian calendar.
Why? Does it make sense to split winter (flu) mortality between two years? Winter deaths are not divided uniformly on December 31.
Preliminaries:
Annual statistics usually computed by Gregorian calendar.
Why? Does it make sense to split winter (flu) mortality between two years? Winter deaths are not divided uniformly on December 31.
https://twitter.com/prof_shahar/status/1336322793122643980
3/
More sensible to include a full winter season in one “mortality year”: Week 40 (October) to Week 39.
Let’s call it “flu year”.
Elaborated here.
More sensible to include a full winter season in one “mortality year”: Week 40 (October) to Week 39.
Let’s call it “flu year”.
Elaborated here.
https://twitter.com/EffectsFacts/status/1332053327681564672
4/
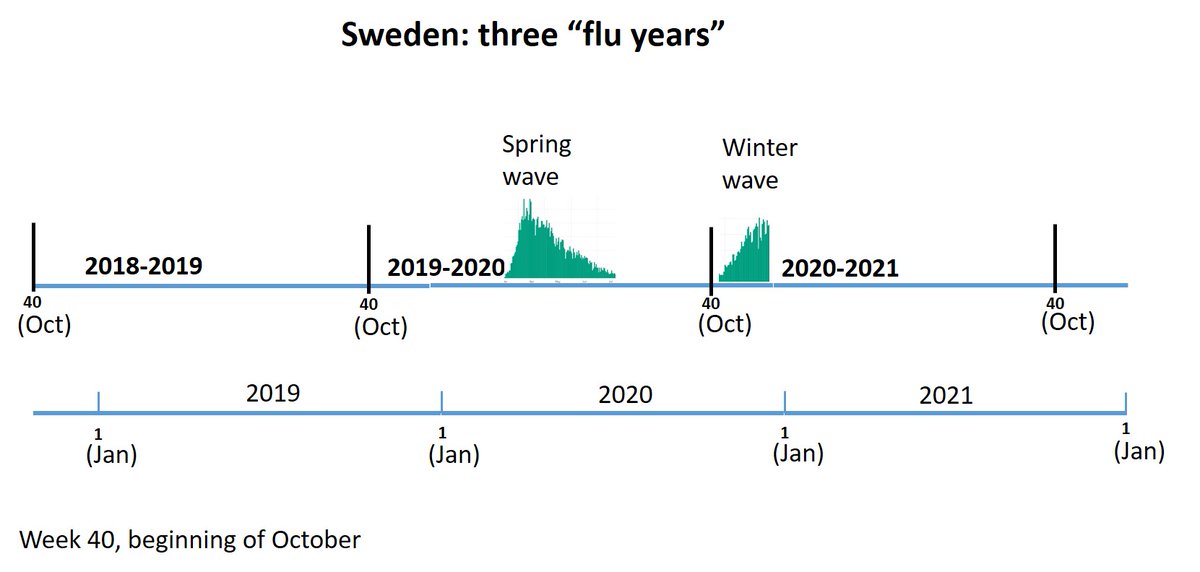
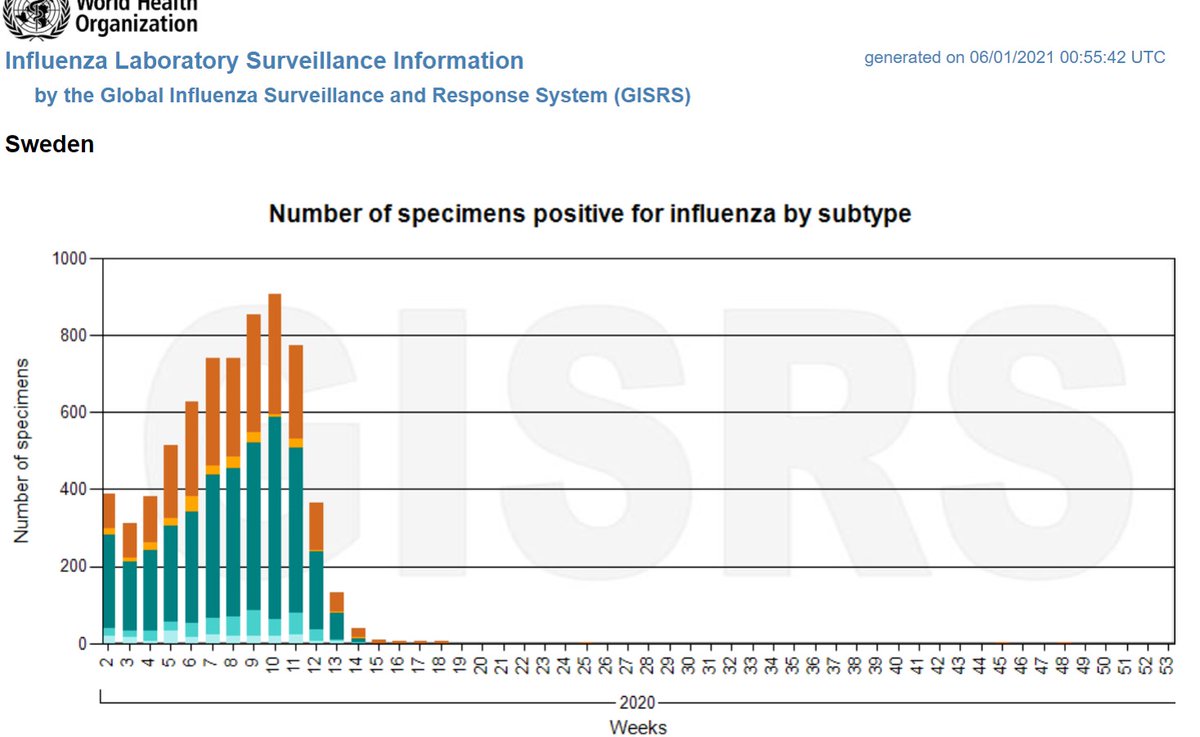
Here is illustration of three “flu years” in Sweden.
Oct 2019 – Sep 2020 contains the spring wave
The current winter wave belongs to the subsequent “flu year”. As explained above, there is no scientific reason to count it in 2020 (Gregorian year).
Here is illustration of three “flu years” in Sweden.
Oct 2019 – Sep 2020 contains the spring wave
The current winter wave belongs to the subsequent “flu year”. As explained above, there is no scientific reason to count it in 2020 (Gregorian year).
5/
Notation:
A “flu year” will be labeled according to the Gregorian year in which it ends (contains 9 of 12 months)
For example:
2019 will denote Oct 2018 – Sep 2019
2020 will denote Oct 2019 – Sep 2020
Used thereafter
Notation:
A “flu year” will be labeled according to the Gregorian year in which it ends (contains 9 of 12 months)
For example:
2019 will denote Oct 2018 – Sep 2019
2020 will denote Oct 2019 – Sep 2020
Used thereafter
6/
Mortality measure: deaths per million
Account for changes in population size (but not directly for changes in age distribution)
Model: linear regression
Mortality measure: deaths per million
Account for changes in population size (but not directly for changes in age distribution)
Model: linear regression
7/
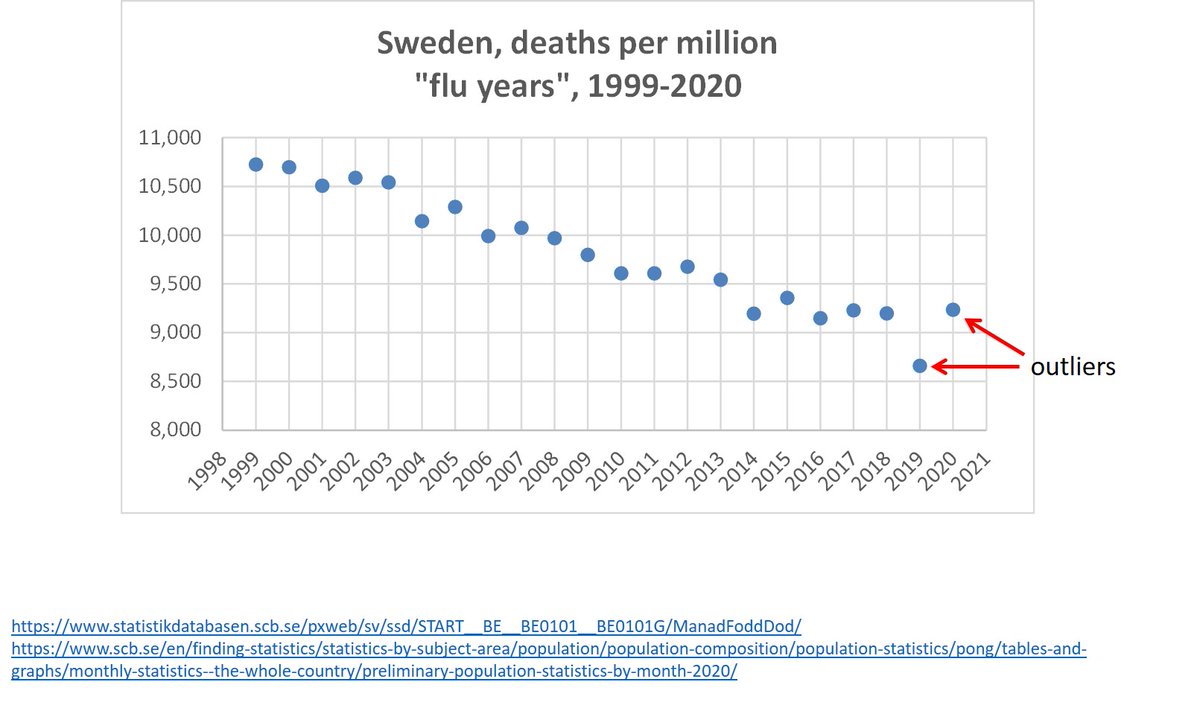
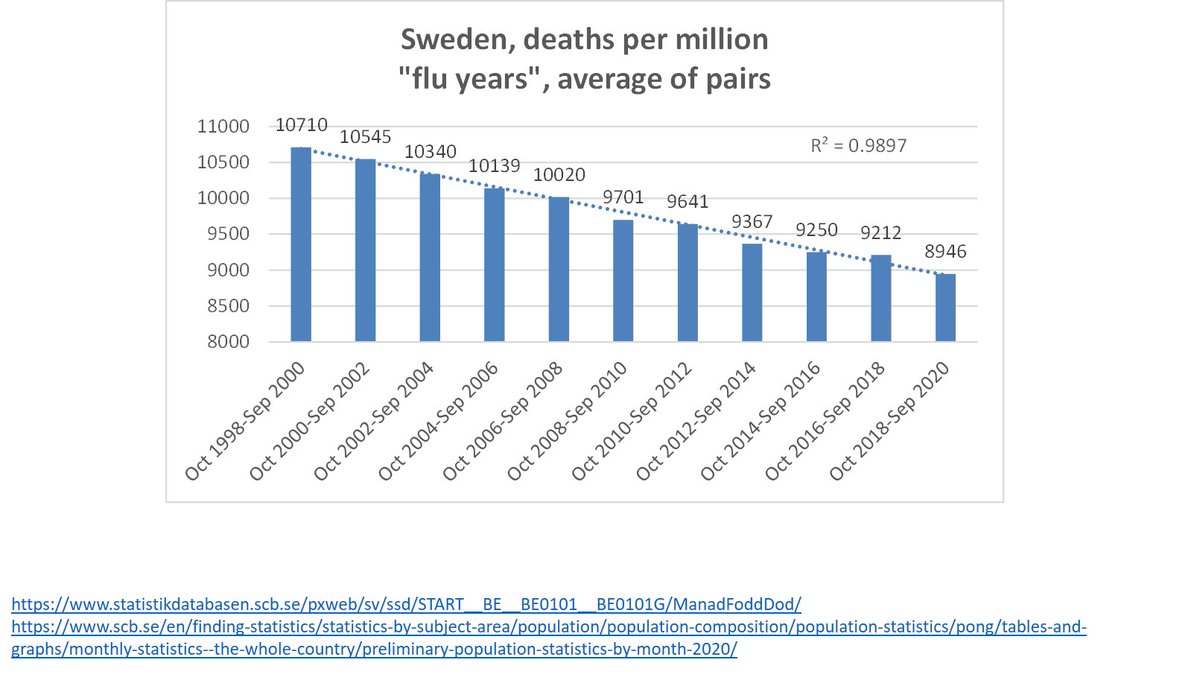
Graph shows a clear pattern of decline over the years.
BUT: 2019 and 2020 are outliers! Both deviate from the trend, as will be seen.
Therefore, using 2019 to infer on excess mortality in 2020 is questionable practice (e.g. comparing 2020 to average of 2015-2019)
Graph shows a clear pattern of decline over the years.
BUT: 2019 and 2020 are outliers! Both deviate from the trend, as will be seen.
Therefore, using 2019 to infer on excess mortality in 2020 is questionable practice (e.g. comparing 2020 to average of 2015-2019)
8/
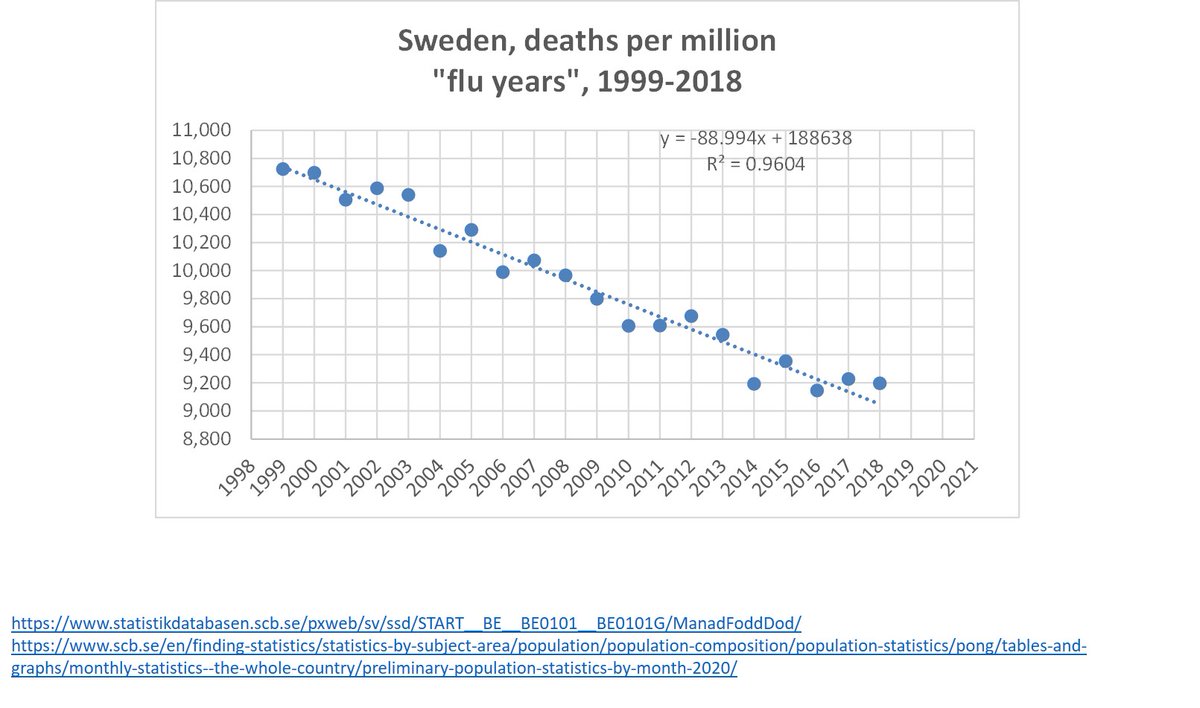
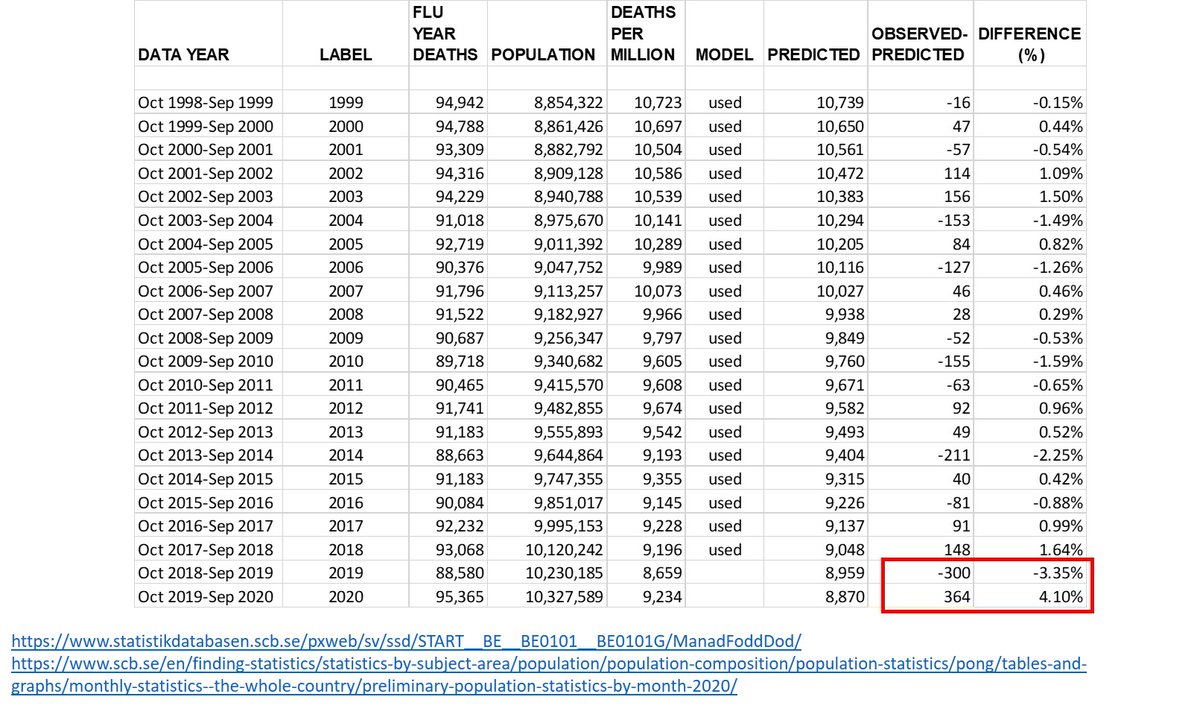
We can fit a line (linear regression model) to flu years 1999-2018.
R^2=0.96
And get an equation by which we estimate the following:
Predicted deaths for 2019, 2020 (and other years)
Deviation of observed deaths from predicted
We can fit a line (linear regression model) to flu years 1999-2018.
R^2=0.96
And get an equation by which we estimate the following:
Predicted deaths for 2019, 2020 (and other years)
Deviation of observed deaths from predicted
9/
Table shows data & results.
2019: mortality deficit of 300 per million (-3.35%)
2020: excess mortality of 364 per million (+4.1%)
2020 essentially “balanced the deficit” of 2019.
True excess mortality did not exceed 1%.
Table shows data & results.
2019: mortality deficit of 300 per million (-3.35%)
2020: excess mortality of 364 per million (+4.1%)
2020 essentially “balanced the deficit” of 2019.
True excess mortality did not exceed 1%.
10/
To see that deaths were balanced over two “flu years”, we may take the average of pairs:
Oct 1998 – Sep 2000
Oct 2000 – Sep 2002
.
.
Oct 2018 – Sep 2020
Nothing unusual is seen in Sweden
Similar conclusion here
To see that deaths were balanced over two “flu years”, we may take the average of pairs:
Oct 1998 – Sep 2000
Oct 2000 – Sep 2002
.
.
Oct 2018 – Sep 2020
Nothing unusual is seen in Sweden
Similar conclusion here
https://twitter.com/TLennhamn/status/1327240141778407429
11/
The effect of the current winter wave?
To be determined by Sep 2021 (“flu year” of Oct 2020-Sep 2021).
So far, Covid replaced the flu in Sweden and elsewhere.
@HaraldofW
@TLennhamn
@EffectsFacts
@DaFeid
@covidtweets
@sdbaral
The effect of the current winter wave?
To be determined by Sep 2021 (“flu year” of Oct 2020-Sep 2021).
So far, Covid replaced the flu in Sweden and elsewhere.
@HaraldofW
@TLennhamn
@EffectsFacts
@DaFeid
@covidtweets
@sdbaral
• • •
Missing some Tweet in this thread? You can try to
force a refresh