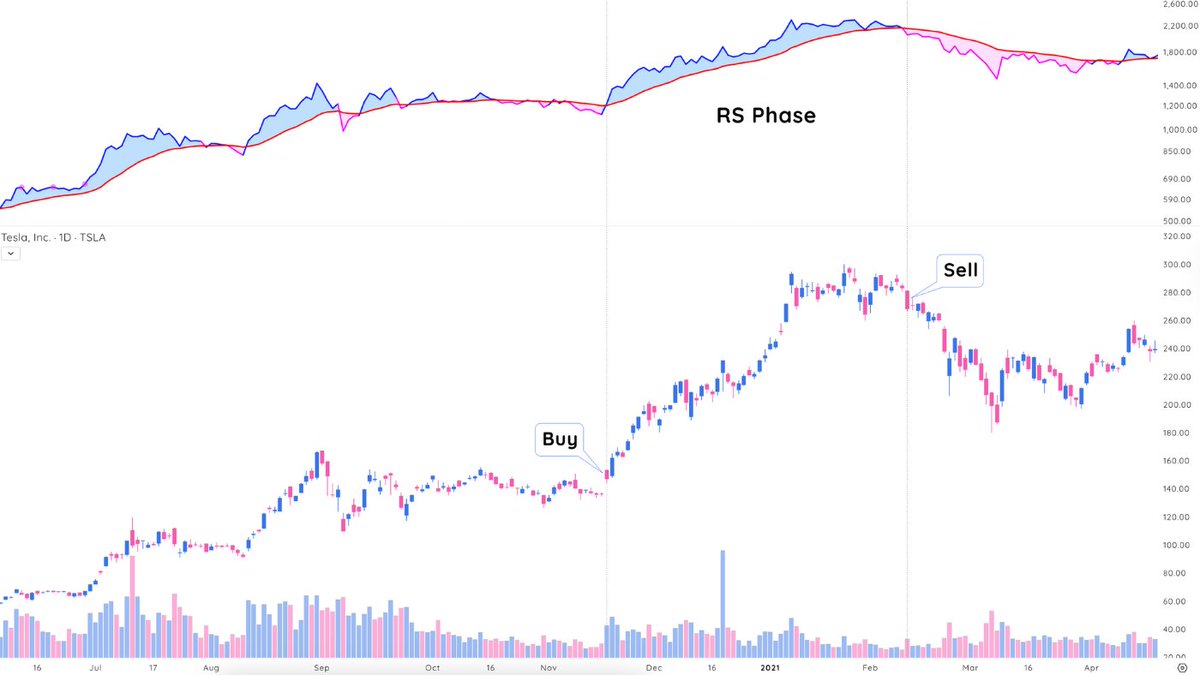
Why do we track institutional footprints? 🐘 (Thread)
Large institutions like mutual funds, hedge funds, banks, insurance companies, trusts, etc. amount for over 75% of all volume. These institutions move the market, not you and I.
It makes sense that if these guys are moving the markets, we would ideally want to buy the same stocks they are buying, but before they buy them? Right?
So, let’s get a clear understanding of how and why this is so important and what this might look like behind the scenes.
So, let’s get a clear understanding of how and why this is so important and what this might look like behind the scenes.
For starters, let’s discuss what we mean by a large institution. In this case, we are referring to the many funds, pensions, trusts, etc. that are responsible for managing tens, if not hundreds of billions of dollars.
Hence, they easily attract and can afford to retain the planet’s top talent, not to mention, their research budgets are enormous.
They have access to information and resources that the retail crowd simply does not, and if they did, it would likely be extremely unaffordable.
They have access to information and resources that the retail crowd simply does not, and if they did, it would likely be extremely unaffordable.
What might this look like? Let’s assume we are discussing one of the large, successful mutual fund houses, with hundreds of billions of dollars to manage and they just hired a new portfolio manager with a well-established track record and phenomenal reputation.
Guys like this often cost a small fortune to retain, who then, go out and assemble a team of the brightest and best research analysts they can find to cover all the sectors and industry groups relevant to their fund.
In turn, these analysts have access to top tier, super expensive resources, services, and experts, which allows them to drill down on the underlying fundamentals of the companies they cover for the fund in fine detail.
Now, remember, because many of these institutions are so large, it can take weeks or even months for them to accumulate a full position. Therefore, it becomes almost impossible for them to hide their tracks.
Fortunately, this makes it possible to identify what they are buying, well before they are finished accumulating a position.
Adding to this, there are still all of the other fund managers out there with enormous portfolios to invest, whom also decide to take positions in the same stock, which takes a similarly long time to accumulate adding volume and buying pressure to the stock.
On a bright note, as retail traders and investors, we do have access to affordable services that provide institutional sponsorship information in great detail.
In most cases, you are able to see which institutions are buying or selling a particular stock and whether they have been increasing, or decreasing the size of their position going back a couple of years, on a quarterly basis.
It’s important to keep in mind that not all institutional sponsorship is created equally. This means it’s a big plus when you see the funds with the best long-term track records accumulating a stock.
Another benefit to riding the coattails of the largest, most successful institutions on the street is the fact that they tend to accumulate shares on weakness.
This means that when the general market starts to drop like a rock and high flying growth stocks roll over and sell-off with it, the stocks being accumulated by the biggest and best money managers on the street, will be the first ones to get saved at logical areas of support.
Logical areas of support for example could be prior highs in a stock’s uptrend or its major moving averages.
As time goes by, they learn how to hide their buying better and better but due to their sheer size, they can’t eliminate their footprints completely. So, now you can see that if you understand and know what to look for, this can be a huge advantage!
At the end of the day, you want to buy stocks that the institutions are buying, since they are the ones moving the market. It doesn’t matter how much you believe in a stock’s story, or how strongly you may think it is going to go up.
The bottom line is, it’s likely not going to move in a healthy, sustainable manner if the big institutions aren’t ultimately behind the buying and there to support it on weakness.
The good news is we don’t need to know what they are going to buy before they buy it. Like we mentioned above, it takes a very long time for them to accumulate a full position and we know that we can identify this on the charts.
In summary:
• Institutions have better resources.
• Institutions move the market.
• Institutions are so large they take weeks to months to accumulate a full position and it is impossible to hide their tracks completely.
• Our job is to spot these tracks.
• Institutions have better resources.
• Institutions move the market.
• Institutions are so large they take weeks to months to accumulate a full position and it is impossible to hide their tracks completely.
• Our job is to spot these tracks.
• • •
Missing some Tweet in this thread? You can try to
force a refresh


