Or, how does a biased world rid itself of the best example of a non-lockdown control for its horrible lockdown experiment?
Simple! CHANGE THE DATA.
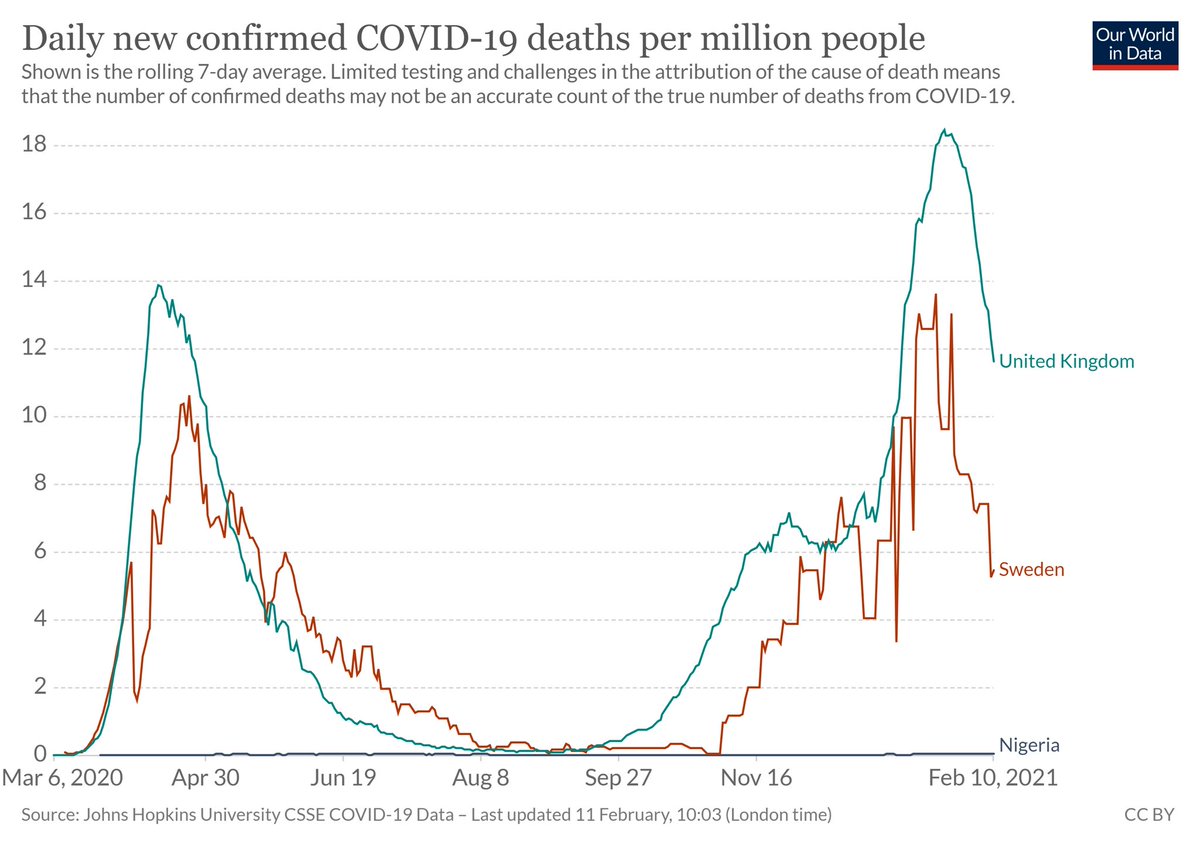
Of course we all know Sweden has been a battleground regarding its mild voluntary lockdown strategy versus the heavy lockdowns of most of the EU. Inconvenient graphs like this one are quite a thorn in Team Lockdown’s side. Sweden fewer deaths/M, much better quality of life.
When I did some analysis in the Spring and Fall, I looked at Oxford’s stringency index as a proxy for lockdown severity. And sure enough Sweden was significantly lower stringency than all other EU countries.
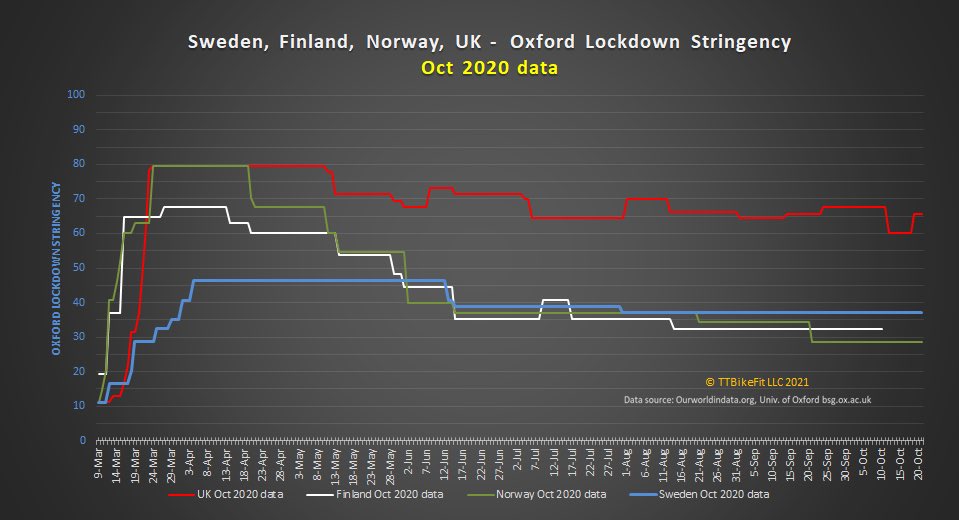
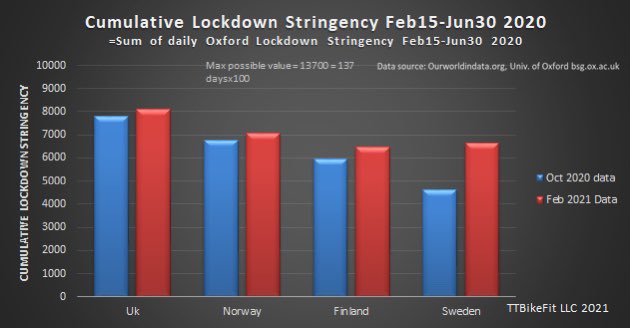
Here is a plot tracking stringency for the UK, Finland Norway and Sweden. I added Norway and Finland because Team Lockdown loves to reply to Sweden threads with “but Norway but Finland”! When I plotted this in October we see Sweden’s Spring stringency was comparatively low.
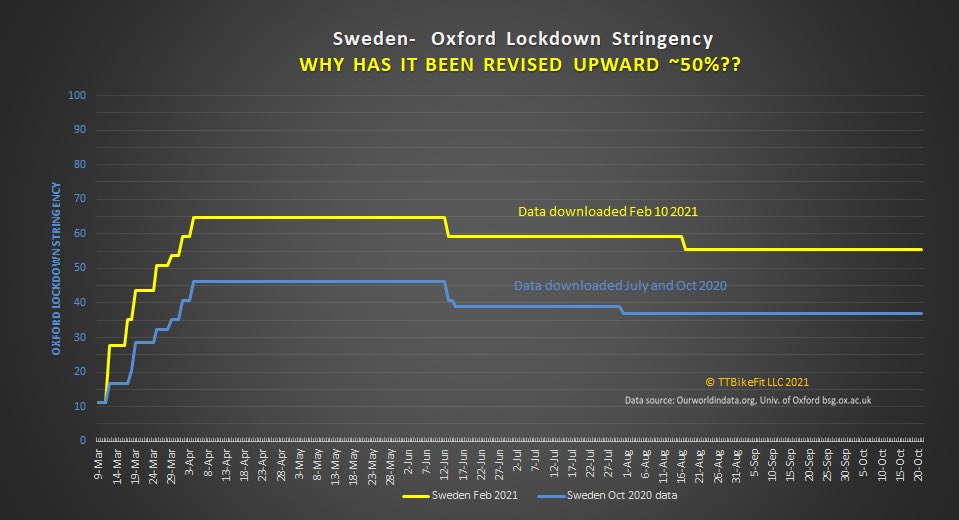
But then I just happened to plot this again yesterday. What the heck? Sweden is no longer a mild-response country! It is only slightly less stringent than the UK! And the “but Norway Finland” argument is now moot! Look how much less stringent they’ve been!
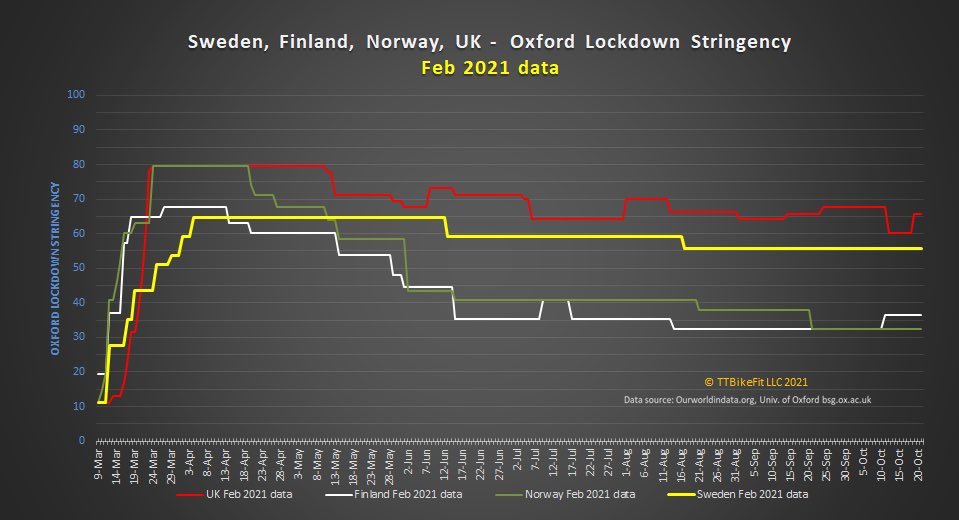
So apparently the whole “Sweden didn’t lockdown” thing is just a myth? Here is the comparison between Oxford’s assessment of Sweden’s lockdown in October vs Now. Almost a 50% increase in stringency?! I am certain Swedes would be baffled by this.
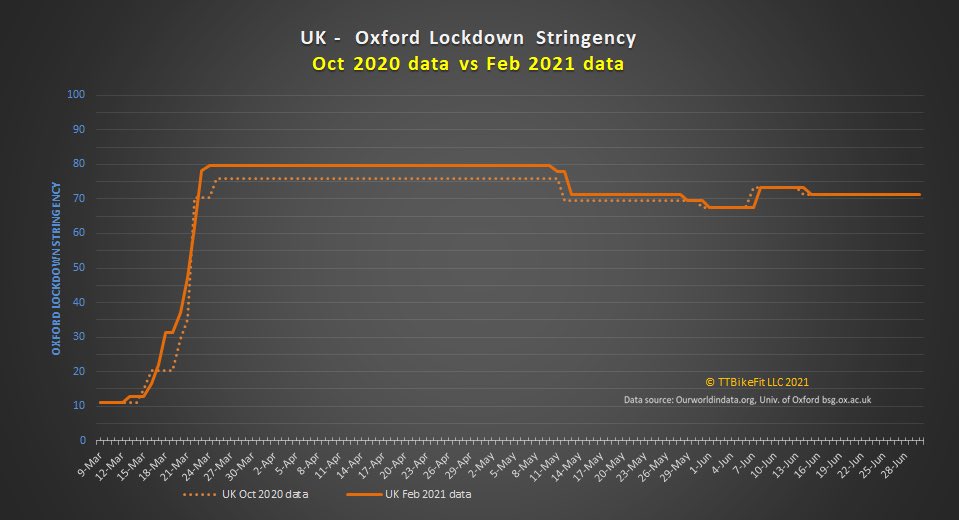
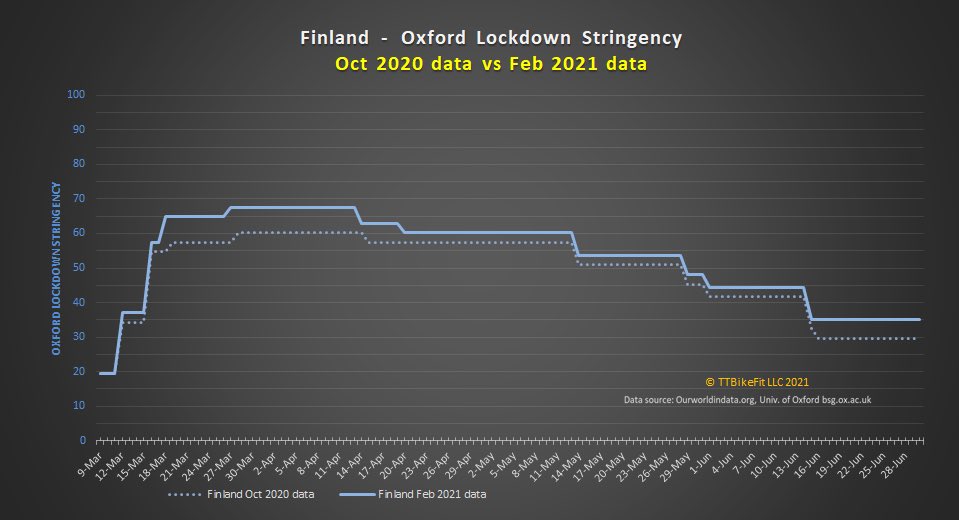
So then I thought I should look at other countries. Was their data revised significantly between Fall and Feb? Nope. Small revisions yes. Not huge revisions that change the entire thesis. 🤔
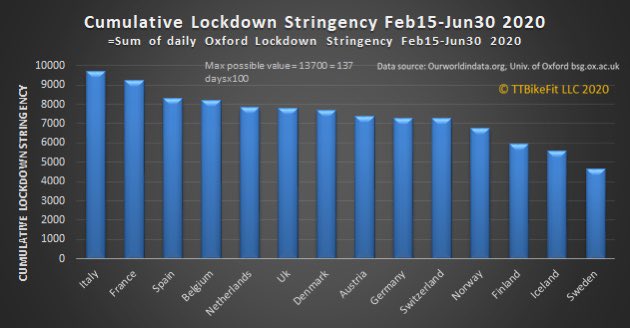
What about the cumulative stringency compare- how does it change? Well now Sweden is above a few countries and on par with several more.
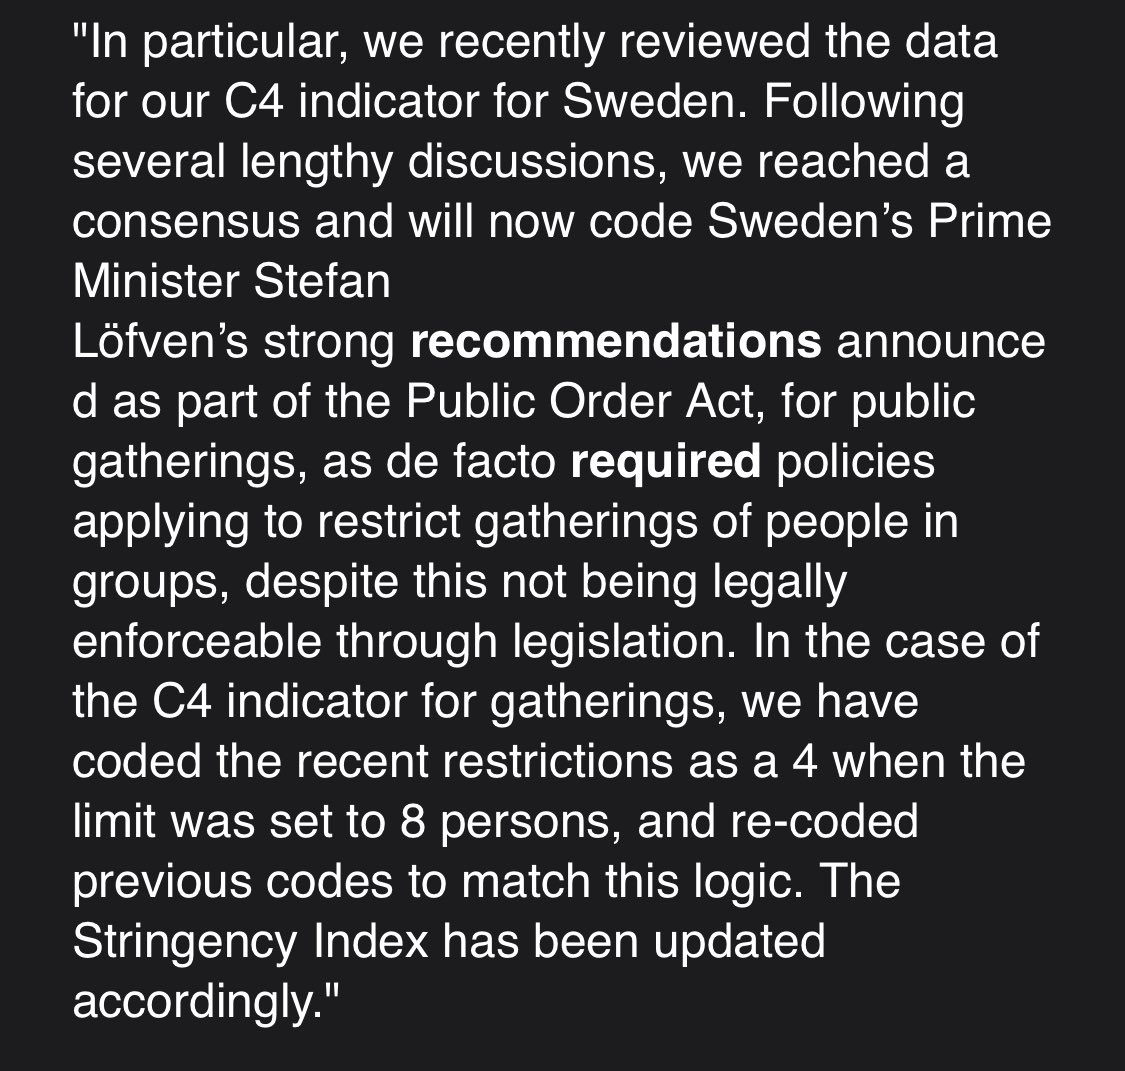
So I of course had to contact Oxford OxCGRT Data Team and ask if this was all just a big mistake. Nope.
They had “several lengthy discussions” and decided to “update”the data. How do recent unenforceable decrees by the PM affect data from last Spring I replied?
So there you have it. Down the memory hole goes Sweden’s non-lockdown control experiment. Now it was much like all other EU countries.
Makes their similar results much easier to explain for Team Lockdown! “See, Sweden really did lockdown! Oxford says so! Ignore the Swedes!”
Inconveniently however, Team Lockdown’s favorite compares “but Norway and but Finland” now show similar/milder lockdowns than Sweden with far better results. Which would point out that lockdowns had little influence over deaths/M. Hence why lock down?
So yes folks the fix is in. Don’t like what the control is telling you about your terrible experiment? Fudge the control data. If there is no control it’s much easier to make unverifiable assertions. This is all most convenient for the UK. Where is Oxford located again?
PCR test issues, summarized from our Twitter Spaces yesterday:🧵
👉PCR was never designed to diagnose a disease - it’s a lab test to find tiny amounts of rna for research purposes, and without clinical observations it is useless for diagnosis.
From the ThermoFisher manual:
👉 PCR test results drive all the other pandemic statistics: Cases, hospitalizations, fatalities, vax “efficacy.” They are also used to force quarantine, restrict travel, and shut down schools. Yet they were never meant to be used for broad surveillance.
👉 High CT PCR positives detect as little as a single copy of RNA - far higher amounts are required for a culturable or replication-competent infection. Presence of a tiny amount of RNA implies nothing about infection or infectiveness. “Asymptomatic infection” = oxymoron 🤡🌎
My colleagues @ClareCraigPath and Dr Andrew Bostom (banned from Twitter) warned about the concerning heart damage signals a year ago. Key points apply to the recent Nature study too -> dailysceptic.org/archive/raisin…
“A 4x increase above baseline was evident in the seven days after the first dose for under-24 yo rising to over 27x for the 7days after the 2nd dose. The rate/M in males 12-17 was 17x higher than in men >50, 7days after the 1st dose, rising to 74x 7days after the second dose.”->
“For young and old it is not a clinically obvious diagnosis and it is likely that milder cases will have gone undiagnosed. Even for these mild cases, the long term outcome is unknown...Currently, more than half of the reports in VAERS are from patients under the age of 30. ->
Do not arouse the wrath of the great and powerful FAUCI!
Terrifying!
But what is behind that green curtain?
Wait - who could it be?
Holy flying monkeys - it's NIH Head of Clinical "Bioethics" - Fauci's WIFE Christine Grady - in place for 12 years. Hmm, who knew? And why didn't we? It's not like there is any conflict there, right?
💥State (RI) pediatric hospitalization data analyzed:
👉Only 1/3 of 0-18yrs Covid19 hospitalizations could possibly have been DUE TO C19.
@andrewbostom@ifihadastick and I have been looking at this ICD code data and there will be much more analysis to come. 1/6
Pop of RI 0-18 is ~220k. We also looked at flu hosps with primary dx of flu vs C19 hosps w primary dx U071 (=+C19 test). 100% of flu hosps had codes consistent w flu while only 56% of C19 primary dx were even possibly hosp DUE TO C19. 2/6
Looking at the ICD codes of these supposed pediatric C19 hospitalizations is shocking. There are children there w primary dx for attempted suicide, abuse, severe trauma, poisoning, cancer etc with a U071 Covid code thrown in.
💥folks these kids are not hospitalized for Covid 3/6
These are the kinds of clowns that want to shut up anyone who dares question their approved narrative. Fact: a free society is built on open debate and free speech - never in history have the censors been the good guys. Censorship has never been for anyone’s good but the censors.
Gavin Yamey (Prof MD MPH!) is the poster boy for zero Covid nut jobs who have spent the last 2 years grifting for funds at your expense. He blocks anyone who disagrees rather than debating. He lies incessantly and moves to the next lie. No accountability in his echo chamber.
2 lies in that single tweet. Characterizing PANDA as “anti v” because we are are critical of the data and the unsupported assertions. 2nd, the GBD authors are not scientific advisors. Par for the course for these folk. Which is exactly why they love censorship. But looky here ->
Fun math exercise via El Gato Malo, prompted by the @CDCgov 's "adjustment" of it's C19 mortality data.
If the avg person gets 2x colds per year, even just mild feeling crappy stuff, if we were mass PCR testing >35Ct for "colds", How many "cases" do you think we would get? ->
Well now what if we counted any death for a month after your "+ cold PCR" as a "Cold death?"
That means for every person, there are 2 months out of 12 where they will flag as a "cold death." 17% of the year.
Since 2.9M die in the US annually, x17% equals 490k "cold deaths" ->
Now those are just 490,000 deaths, WITH a "positive cold test" in the past month. How many actually died FROM a cold? Some, but nowhere near all. This leaves out skewed risk in older folks, seasonality etc, but you get the point. ->