1/
Get a cup of coffee.
In this thread, I'll walk you through the importance of understanding *correlations* between bets.
For example, a portfolio of *correlated* stocks can have very different performance characteristics compared to a portfolio of *uncorrelated* stocks.
Get a cup of coffee.
In this thread, I'll walk you through the importance of understanding *correlations* between bets.
For example, a portfolio of *correlated* stocks can have very different performance characteristics compared to a portfolio of *uncorrelated* stocks.
2/
Imagine we put $100K into a stock.
In the next 1 year, the stock could go down 30% (our worst case scenario).
Or it could go up 50% (our best case scenario).
Or it could give us a return somewhere between these extremes.
Say all such returns are equally likely.
Imagine we put $100K into a stock.
In the next 1 year, the stock could go down 30% (our worst case scenario).
Or it could go up 50% (our best case scenario).
Or it could give us a return somewhere between these extremes.
Say all such returns are equally likely.
3/
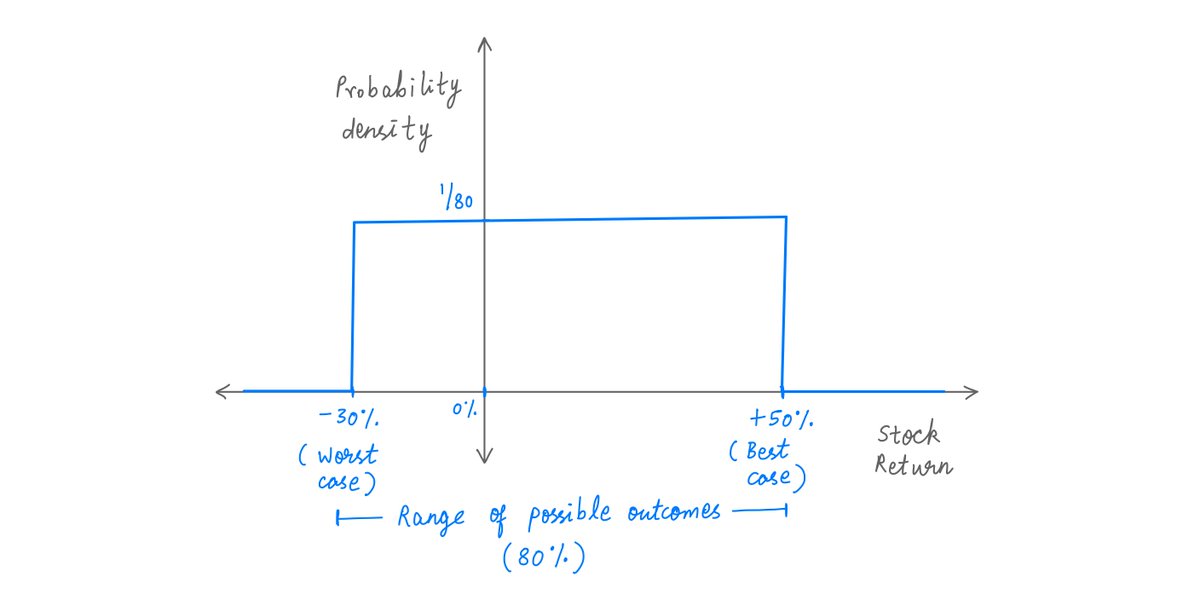
A "probability density diagram" can be used to visualize such scenarios.
On the X axis, we take all possible outcomes (in this case, -30% to +50%).
And on the Y axis, we plot the likelihoods of these outcomes.
Like so:
A "probability density diagram" can be used to visualize such scenarios.
On the X axis, we take all possible outcomes (in this case, -30% to +50%).
And on the Y axis, we plot the likelihoods of these outcomes.
Like so:
4/
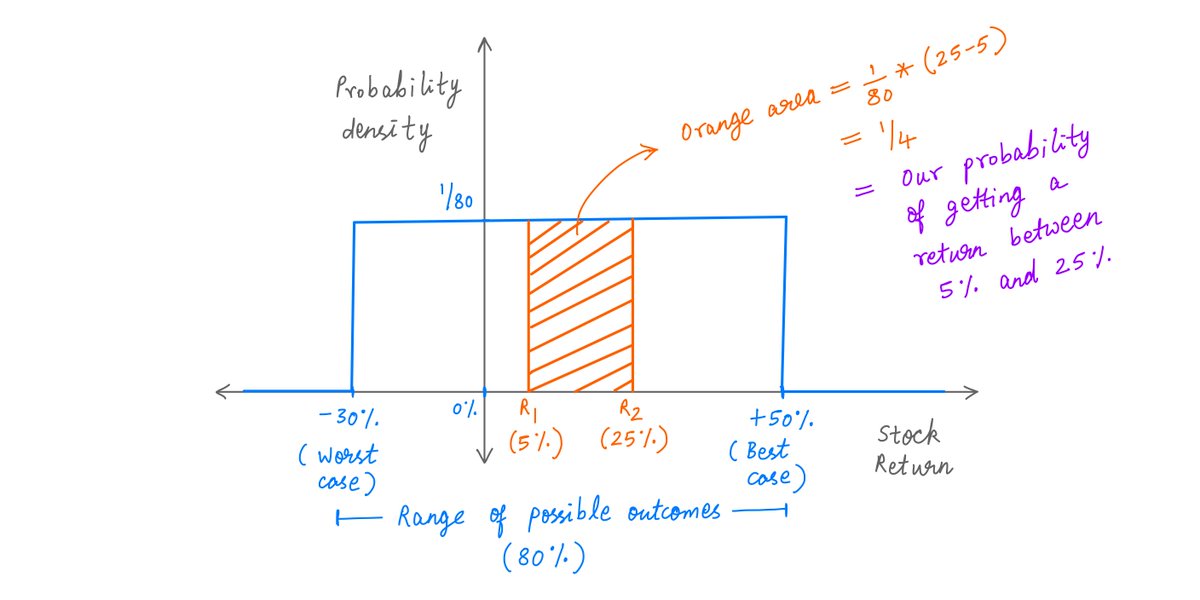
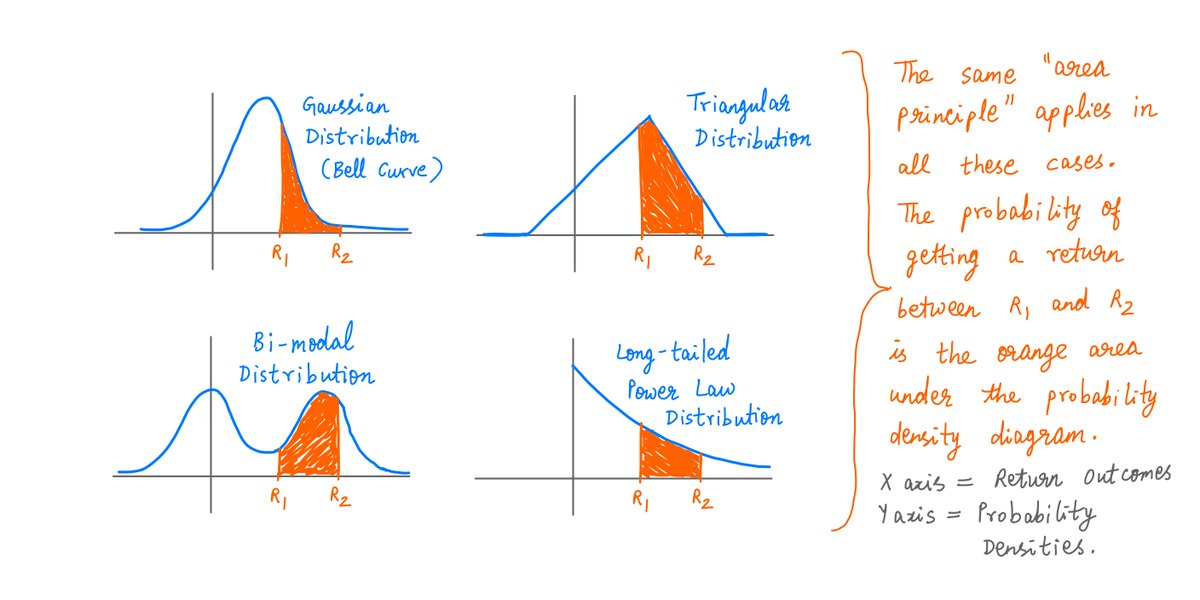
Take any 2 outcomes on the X axis -- say, R1 and R2.
Now, calculate the area under the probability density diagram between R1 and R2.
Our probability of getting a return *between* R1 and R2 is exactly this area.
Like so:
Take any 2 outcomes on the X axis -- say, R1 and R2.
Now, calculate the area under the probability density diagram between R1 and R2.
Our probability of getting a return *between* R1 and R2 is exactly this area.
Like so:
5/
This is called a "uniform" distribution -- *all* returns between -30% and +50% are *equally* likely.
But we can also imagine other "non-uniform" scenarios, where *some* returns are more likely than others.
Here too, probability density diagrams can help us.
A few examples:
This is called a "uniform" distribution -- *all* returns between -30% and +50% are *equally* likely.
But we can also imagine other "non-uniform" scenarios, where *some* returns are more likely than others.
Here too, probability density diagrams can help us.
A few examples:
6/
Now imagine investing the same $100K, but splitting it across 2 stocks. Each stock gets $50K.
As before, each stock can give us a return between -30% and +50%. And all such returns are equally likely.
Now imagine investing the same $100K, but splitting it across 2 stocks. Each stock gets $50K.
As before, each stock can give us a return between -30% and +50%. And all such returns are equally likely.
7/
If our stocks are completely *uncorrelated*, our return from each would be *independent* of the other.
This means: if Stock 1 does well, that doesn't increase (or decrease) the chances of Stock 2 doing well.
And if Stock 1 does badly -- again, no effect on Stock 2.
If our stocks are completely *uncorrelated*, our return from each would be *independent* of the other.
This means: if Stock 1 does well, that doesn't increase (or decrease) the chances of Stock 2 doing well.
And if Stock 1 does badly -- again, no effect on Stock 2.
8/
Here's a simulation of 1000 such "sample returns".
Each blue dot is 1 random sample -- a return from Stock 1, and an *uncorrelated* return from Stock 2.
As we may expect, our samples pretty much evenly cover an entire square region: [-30%, +50%] x [-30%, +50%].
Here's a simulation of 1000 such "sample returns".
Each blue dot is 1 random sample -- a return from Stock 1, and an *uncorrelated* return from Stock 2.
As we may expect, our samples pretty much evenly cover an entire square region: [-30%, +50%] x [-30%, +50%].
9/
But what if our stocks are *correlated*?
For example, what if both stocks depend on the US economy?
In a good economy, both tend to do well.
And in a bad economy, both tend to fare poorly.
This common denominator -- the US economy -- makes our stocks *correlated*.
But what if our stocks are *correlated*?
For example, what if both stocks depend on the US economy?
In a good economy, both tend to do well.
And in a bad economy, both tend to fare poorly.
This common denominator -- the US economy -- makes our stocks *correlated*.
10/
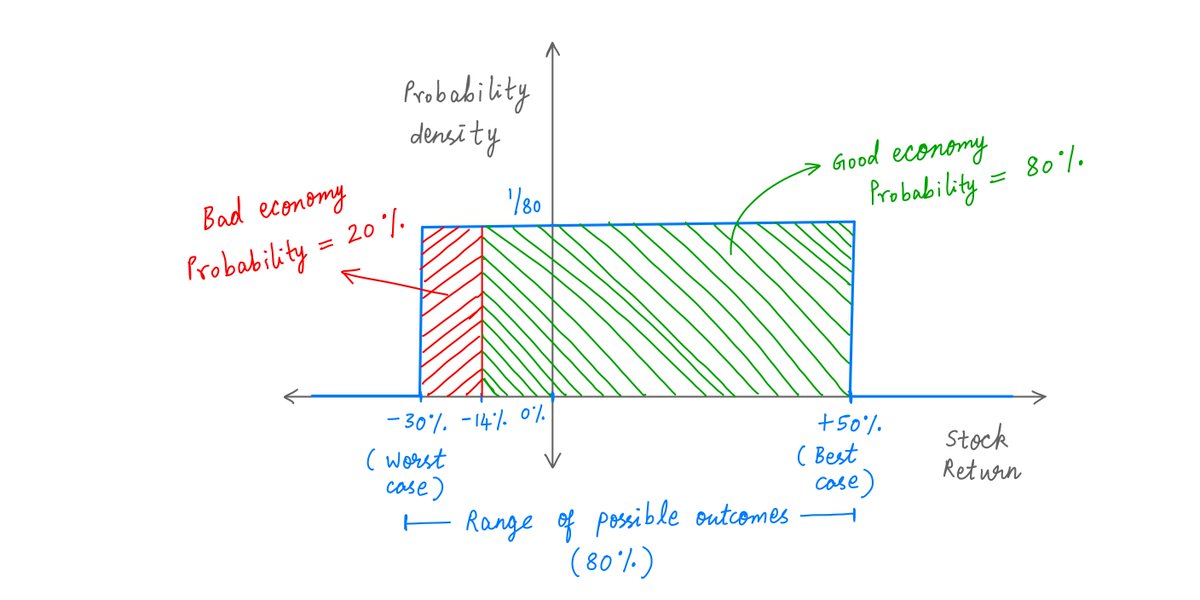
To be more precise, let's break our [-30%, +50%] return from each stock into two parts:
a) The "low range": the bottom quintile [-30%, -14%), and
b) The "high range": the rest [-14%, +50%].
To be more precise, let's break our [-30%, +50%] return from each stock into two parts:
a) The "low range": the bottom quintile [-30%, -14%), and
b) The "high range": the rest [-14%, +50%].

11/
In a bad economy, we'll assume stocks will give us returns from the "low range". And in a good economy, from the "high range".
Within each range, all returns are equally likely.
And except for this "range setting", our stocks are otherwise uncorrelated.
In a bad economy, we'll assume stocks will give us returns from the "low range". And in a good economy, from the "high range".
Within each range, all returns are equally likely.
And except for this "range setting", our stocks are otherwise uncorrelated.
12/
Suppose the economy has an 80% chance of doing well and a 20% chance of doing badly.
In this scenario, each *individual* stock still has the exact same return distribution as before: uniformly drawn from [-30%, +50%].
Here's the probability density diagram to prove it:
Suppose the economy has an 80% chance of doing well and a 20% chance of doing badly.
In this scenario, each *individual* stock still has the exact same return distribution as before: uniformly drawn from [-30%, +50%].
Here's the probability density diagram to prove it:
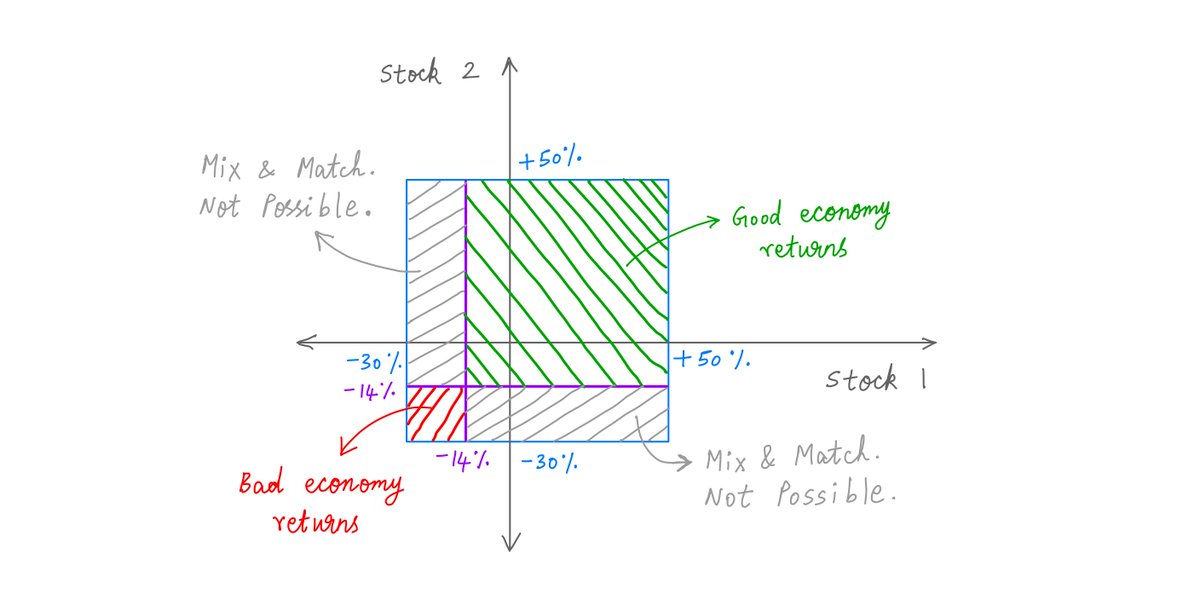
13/
Yes, each *individual* stock is still the same.
But when we take *2 or more* stocks together, correlation strikes.
Because, depending on the economy, our stocks either give us *all* low range, or *all* high range returns. No mix and match.
Yes, each *individual* stock is still the same.
But when we take *2 or more* stocks together, correlation strikes.
Because, depending on the economy, our stocks either give us *all* low range, or *all* high range returns. No mix and match.
14/
This "no mix and match" feature completely changes the portfolio's statistics.
For example, here's a side-by-side simulation of 2 uncorrelated and 2 correlated stocks.
The *individual* stocks on either side are the same. But the *portfolios* are starkly different.
This "no mix and match" feature completely changes the portfolio's statistics.
For example, here's a side-by-side simulation of 2 uncorrelated and 2 correlated stocks.
The *individual* stocks on either side are the same. But the *portfolios* are starkly different.
15/
Why stop at 2 stocks?
Let's do N stocks!
Let's do *uncorrelated* stocks first. It's much simpler.
Suppose we split our money equally between N uncorrelated stocks.
Each individual stock can have a wide range of outcomes -- in our case, [-30%, +50%].
Why stop at 2 stocks?
Let's do N stocks!
Let's do *uncorrelated* stocks first. It's much simpler.
Suppose we split our money equally between N uncorrelated stocks.
Each individual stock can have a wide range of outcomes -- in our case, [-30%, +50%].
16/
But as N (the number of stocks in our portfolio) increases, we become more and more likely to get an *average* outcome rather than an extreme one.
In our case, the *average* outcome is (-30% + 50%)/2 = 10%.
So, as we increase N, our return is likely to be close to 10%.
But as N (the number of stocks in our portfolio) increases, we become more and more likely to get an *average* outcome rather than an extreme one.
In our case, the *average* outcome is (-30% + 50%)/2 = 10%.
So, as we increase N, our return is likely to be close to 10%.
17/
Here are the probability density diagrams for N=1 through N=20.
As we can see, even though each individual stock has a wide range of possible outcomes, our N-stock portfolio tends to have a much narrower spread around our average 10%.
Here are the probability density diagrams for N=1 through N=20.
As we can see, even though each individual stock has a wide range of possible outcomes, our N-stock portfolio tends to have a much narrower spread around our average 10%.
18/
In probability parlance, we say that as N increases, the "standard deviation" of our portfolio decreases.
In fact, we know that an uncorrelated N-stock portfolio's standard deviation is proportional to 1/sqrt(N).
For more:
In probability parlance, we say that as N increases, the "standard deviation" of our portfolio decreases.
In fact, we know that an uncorrelated N-stock portfolio's standard deviation is proportional to 1/sqrt(N).
For more:
https://twitter.com/10kdiver/status/1281968727089573889
19/
To better understand the benefits provided by this kind of diversification, we can set a "bad" outcome and a "good" outcome for the portfolio as a whole.
Then we explore what happens to the probabilities of these outcomes as the number of stocks in the portfolio increases.
To better understand the benefits provided by this kind of diversification, we can set a "bad" outcome and a "good" outcome for the portfolio as a whole.
Then we explore what happens to the probabilities of these outcomes as the number of stocks in the portfolio increases.
20/
For example, suppose our "bad" outcome is a portfolio-level loss, ie, any negative return.
And our "good" outcome is any return above 8%.
For our uncorrelated N-stock portfolio, the probability of our bad outcome goes to 0% as N increases.
Great!
For example, suppose our "bad" outcome is a portfolio-level loss, ie, any negative return.
And our "good" outcome is any return above 8%.
For our uncorrelated N-stock portfolio, the probability of our bad outcome goes to 0% as N increases.
Great!
21/
And the probability of our good outcome goes to 100% as N increases. Even better!
Here are the probability density diagrams, plus the relevant area calculations, for N=1 through N=20:
(I recently discovered @matplotlib's animated plots. And I love them! Oh, you noticed?)
And the probability of our good outcome goes to 100% as N increases. Even better!
Here are the probability density diagrams, plus the relevant area calculations, for N=1 through N=20:
(I recently discovered @matplotlib's animated plots. And I love them! Oh, you noticed?)
22/
Now let's do a *correlated* N-stock portfolio -- with the US economy being the common denominator as described above.
With these correlations, our portfolio's statistics are *much* less pleasing.
Now let's do a *correlated* N-stock portfolio -- with the US economy being the common denominator as described above.
With these correlations, our portfolio's statistics are *much* less pleasing.
23/
For starters, as N increases, our portfolio's return distribution becomes more and more "bi-modal".
If the economy does well, we're likely to get a result close to the "high range" average (+18%). Otherwise, the "low range" average (-22%).
For starters, as N increases, our portfolio's return distribution becomes more and more "bi-modal".
If the economy does well, we're likely to get a result close to the "high range" average (+18%). Otherwise, the "low range" average (-22%).
24/
The overall average is still 10% -- same as the uncorrelated case.
But there are big differences!
In the uncorrelated case, the *average* outcome was also the *most likely* one.
And with increasing N, the probability of getting a "close to average" return went to 100%.
The overall average is still 10% -- same as the uncorrelated case.
But there are big differences!
In the uncorrelated case, the *average* outcome was also the *most likely* one.
And with increasing N, the probability of getting a "close to average" return went to 100%.
25/
In the *correlated* case, there are 2 *most likely* outcomes: the "low range" average and the "high range" average.
The overall average (10%) is NOT the most likely outcome.
In fact, as N increases, the probability of getting a "close to average" return goes to 0%!
In the *correlated* case, there are 2 *most likely* outcomes: the "low range" average and the "high range" average.
The overall average (10%) is NOT the most likely outcome.
In fact, as N increases, the probability of getting a "close to average" return goes to 0%!
26/
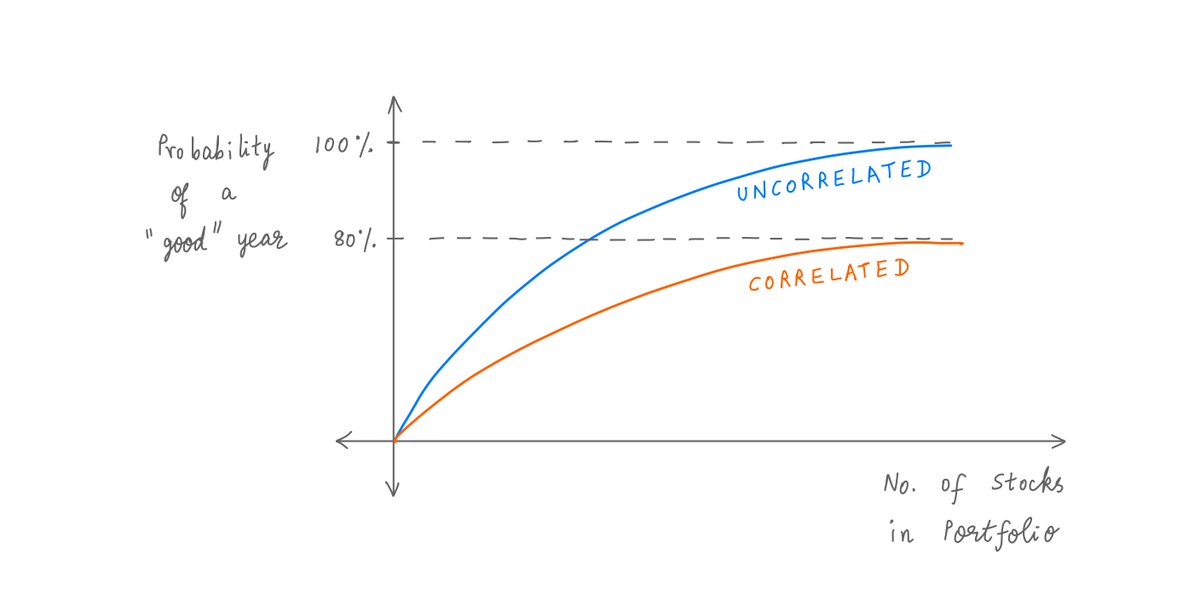
Also, with correlated stocks, there's a hard cap on the benefits of diversification.
As N increases, the probability of a good outcome (a return of at least 8%) does NOT go to 100%.
It's capped at 80% -- no matter how much we increase N.
Also, with correlated stocks, there's a hard cap on the benefits of diversification.
As N increases, the probability of a good outcome (a return of at least 8%) does NOT go to 100%.
It's capped at 80% -- no matter how much we increase N.
27/
Similarly, the probability of a loss does NOT go to 0% as N increases. There's a hard floor at 20%.
That's because, if the economy does badly (and there's a 20% chance of that), our portfolio *will* lose money -- no matter how many stocks we have in it!
Similarly, the probability of a loss does NOT go to 0% as N increases. There's a hard floor at 20%.
That's because, if the economy does badly (and there's a 20% chance of that), our portfolio *will* lose money -- no matter how many stocks we have in it!
28/
Key lesson 1: The presence of correlations can *dramatically* change the statistics of a portfolio -- including its probability density diagram (eg, uni-modal vs bi-modal), its most likely return, its probabilities of yielding good and bad outcomes, etc.
Key lesson 1: The presence of correlations can *dramatically* change the statistics of a portfolio -- including its probability density diagram (eg, uni-modal vs bi-modal), its most likely return, its probabilities of yielding good and bad outcomes, etc.
29/
Key lesson 2: Diversification can only reduce *some* kinds of risk -- the *uncorrelated* kind.
Against other kinds of risk -- like the "common denominator" risk of the whole economy doing badly -- diversification is powerless.
Key lesson 2: Diversification can only reduce *some* kinds of risk -- the *uncorrelated* kind.
Against other kinds of risk -- like the "common denominator" risk of the whole economy doing badly -- diversification is powerless.
30/
Usually, when there's a "common denominator" risk that makes all the bets in a portfolio correlated, it means the portfolio is under-diversified.
This applies to a portfolio of stocks all exposed to the same economy, the same currency, or the same interest rate direction.
Usually, when there's a "common denominator" risk that makes all the bets in a portfolio correlated, it means the portfolio is under-diversified.
This applies to a portfolio of stocks all exposed to the same economy, the same currency, or the same interest rate direction.
31/
It also applies to securitized loan portfolios.
As we saw in 2008-09, common denominator risks and widespread correlations between loans in such mortgage pools dramatically increased the likelihood that the loans would all default together. No mix and match. Boom.
It also applies to securitized loan portfolios.
As we saw in 2008-09, common denominator risks and widespread correlations between loans in such mortgage pools dramatically increased the likelihood that the loans would all default together. No mix and match. Boom.
32/
Also, correlations can dramatically increase tail risks in insurance policy portfolios.
For more:
Also, correlations can dramatically increase tail risks in insurance policy portfolios.
For more:
https://twitter.com/10kdiver/status/1325129752663924737
33/
It's often hard to estimate correlations within a portfolio of bets.
All too often, "common denominator" risks only become visible in hindsight.
Still, our best best is to search proactively for sources of correlation, and plan conservatively in case they come to pass.
It's often hard to estimate correlations within a portfolio of bets.
All too often, "common denominator" risks only become visible in hindsight.
Still, our best best is to search proactively for sources of correlation, and plan conservatively in case they come to pass.
34/
Also, the damage caused by a correlated set of failures can be so high that only governments have the resources to fight it.
For example, a pandemic that shuts down the world economy may be a source of correlated risk. But many individuals may be powerless here.
Also, the damage caused by a correlated set of failures can be so high that only governments have the resources to fight it.
For example, a pandemic that shuts down the world economy may be a source of correlated risk. But many individuals may be powerless here.
35/
Similarly, we may be powerless against a large scale cyber attack.
And even governments may be out of their depths in some situations -- for example, a meteor striking the planet or something like that.
We can't eliminate all risk. Sometimes, we just gotta live with it.
Similarly, we may be powerless against a large scale cyber attack.
And even governments may be out of their depths in some situations -- for example, a meteor striking the planet or something like that.
We can't eliminate all risk. Sometimes, we just gotta live with it.
36/
Thanks for taking the time to read another one of my long threads.
In my experience, a lot of people don't understand the impact of correlations on a portfolio of bets. I hope this thread was able to shed some light on it.
Please stay safe. Enjoy your weekend!
/End
Thanks for taking the time to read another one of my long threads.
In my experience, a lot of people don't understand the impact of correlations on a portfolio of bets. I hope this thread was able to shed some light on it.
Please stay safe. Enjoy your weekend!
/End
PS: Here's the solution to the problem I posted in last week's thread.
https://twitter.com/10kdiver/status/1358181445865332736?s=20

• • •
Missing some Tweet in this thread? You can try to
force a refresh