Here is a list of all of the tutorials I have created so far to make it easier to find and access them:
How to scrape understat:
How to create a pitch:
How to create pass maps:
How to create heatmaps:
How to create shot maps:
How to create pass networks:
How to create xG flow charts:
Linear Regression:
How to create convex hulls:
How to create beeswarm plots:
How to create waffle plots:
Voronoi Diagrams
KMeans clustering
https://twitter.com/mckayjohns/status/1371863528307449856
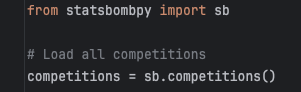
Getting Statsbomb Data with their API
https://twitter.com/mckayjohns/status/1375807989173559300?s=20
@FC_Python python event tagging tool
https://twitter.com/mckayjohns/status/1380162876887855104
Moving Averages
https://twitter.com/mckayjohns/status/1388129850938986502
Create Custom Colormaps
https://twitter.com/mckayjohns/status/1395380317163122692?s=20
Player dashboards pt 1 - intro to grid spec
https://twitter.com/mckayjohns/status/1398235099552829442
Dashboards pt 2
https://twitter.com/mckayjohns/status/1399338621052805121?s=20
How to Get Data From FBREF
Ultimate Guide to Pandas for Data Science/Analytics
Calculate Progressive Passes
https://twitter.com/mckayjohns/status/1412418809286119424
Methods for cleaning data in Python
https://twitter.com/mckayjohns/status/1418212988469792770
List Comprehension
https://twitter.com/mckayjohns/status/1420395564408074242
Updated pitch creation with mplsoccer
• • •
Missing some Tweet in this thread? You can try to
force a refresh