Anna Coulling- A Complete Guide To Volume Price Analysis
A small thread below on important points after reading the book.
#VPA
#nitishvanaparthi
(RT & Additional points for learning purpose)
@PAlearner
@chartmojo
A small thread below on important points after reading the book.
#VPA
#nitishvanaparthi
(RT & Additional points for learning purpose)
@PAlearner
@chartmojo

1. The financial markets are manipulated in one or the other way, the only way to know whether the price is genuine or false is by using volume
(1/n)
(1/n)
2. Book suggested by Anna Coulling's teach, Albert was Reminiscences of a stock operator by Edwin Lefevre. This book is the autobiography of Jesse Livermore
(2/n)
(2/n)
3. Three basic laws of Wyckoff
*The law of supply & demand
*The law of cause & effect
*Theaw of effort Vs result
(3/n)
*The law of supply & demand
*The law of cause & effect
*Theaw of effort Vs result
(3/n)
4. Insiders/ Manipulators will have special information and will be profitable for all sort of transactions. But only thing they cannot hide is volume. Volume reveals activity. Volume reveals the truth behind price action. Volume validates price.
(4/n)
(4/n)
5. An investor must learn to think as a merchant who want to sell an inventory at retail price levels. Why they clear the inventory then the profits will be used to buy more merchandise at wholesale price levels.
(5/n)
(5/n)
6. Volume Price Analysis (VPA) focuses on linear relationship between volume and price once the candle has closed. Volume at Price(VAP) focuses on volume profile during creation of price bar.
(6/n)
(6/n)
7. Reading volume is an art not science. No software will work for this VPA since most of the analysis is subjective. Here we compare price behavior with associated volume and take decision
(7/n)
(7/n)
8. Do not worry about the minor imperfections or discrepancies in the data feed. It's fine if volume feed it 70-80% accurate. Our main focus should be on consistency
(8/n)
(8/n)
9. What we are searching in VPA is that whether price has been validated by volume or it is an anomaly with the price.
If validated by price then confirms continuation of price behavior. If it is just anomaly then there is a sign of potential change.
(9/n)
If validated by price then confirms continuation of price behavior. If it is just anomaly then there is a sign of potential change.
(9/n)
10. Key things to check while looking at a chart..
I. Micro Level
Analyze each candle and look for validation of volume whether it is validating correctly with the volume or an abnormal one.
(10/n)
I. Micro Level
Analyze each candle and look for validation of volume whether it is validating correctly with the volume or an abnormal one.
(10/n)
II. Macro Level
Analyze each price candle with last few previous candles and look for minor trends or reversals
III. Global Level
Analyze complete chart in terms of price action and check whether it is at top or bottom or at middle in a long-term trend
(11/n)
Analyze each price candle with last few previous candles and look for minor trends or reversals
III. Global Level
Analyze complete chart in terms of price action and check whether it is at top or bottom or at middle in a long-term trend
(11/n)
11. Wyckoffs 2nd Law: Law of cause and effect
The longer the time taken( the cause ), the greater the change( the effect).
(12/n)
The longer the time taken( the cause ), the greater the change( the effect).
(12/n)
12. One important point which insiders do is that they create enough greed that people will buy and create enough fear that people will sell.
(13/n)
(13/n)
The five concepts which are considered as the heart of the VPA.
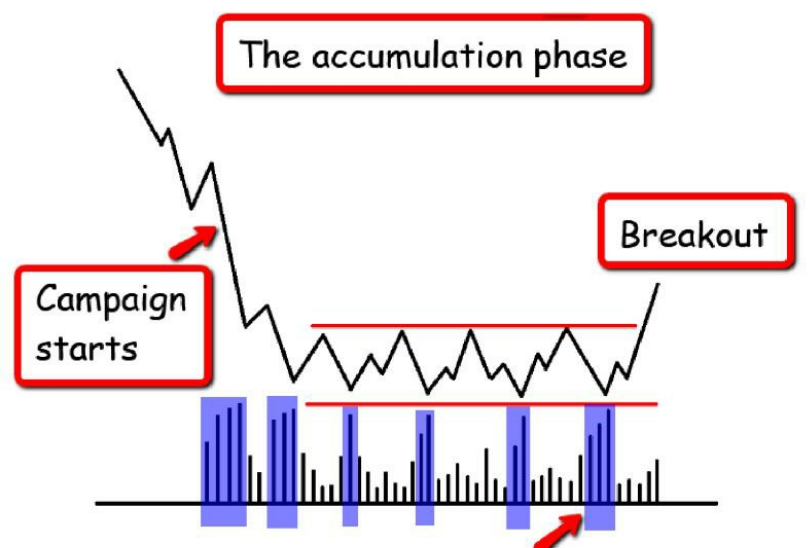
a. Accumulation
b. Distribution
c. Testing
d. Selling Climax
e. Buying Climax
(14/n)
a. Accumulation
b. Distribution
c. Testing
d. Selling Climax
e. Buying Climax
(14/n)
a. Accumulation Concept:
It is the phase of period that insiders go through to fill up their stocks at wholesale prices. It can go through for days/weeks/months
(15/n)
It is the phase of period that insiders go through to fill up their stocks at wholesale prices. It can go through for days/weeks/months
(15/n)

b. Distribution Concept
It can be considered as the exact opposite of the accumulation phase. Here the markets will breakout from the accumulation phase moving higher steady with an average volume.
(16/n)
It can be considered as the exact opposite of the accumulation phase. Here the markets will breakout from the accumulation phase moving higher steady with an average volume.
(16/n)
Now to maximize profits they build bullish momentum slowly.
Markets continue to rise slowly at first with small pullbacks and gradually picks up the price until the target price is reached and then distribution phase starts to clear their entries
(17/n)
Markets continue to rise slowly at first with small pullbacks and gradually picks up the price until the target price is reached and then distribution phase starts to clear their entries
(17/n)

c. Testing Supply
Now to make sure that all the selling has been absorbed, insiders will take the market to lower price and check whether the sellers are out of the market.
This can be defined in 2 ways.
Low Volume Test - Good News
High Volume Test - Bad News
(18/n)
Now to make sure that all the selling has been absorbed, insiders will take the market to lower price and check whether the sellers are out of the market.
This can be defined in 2 ways.
Low Volume Test - Good News
High Volume Test - Bad News
(18/n)
Low Volume Test Good News
Now when they have moved the price to lower price and if the sellers were still in the market then candle would have closed lower on above average volumes. If the volume is low then the insiders move the candle back near to the opening price.
(19/n)
Now when they have moved the price to lower price and if the sellers were still in the market then candle would have closed lower on above average volumes. If the volume is low then the insiders move the candle back near to the opening price.
(19/n)
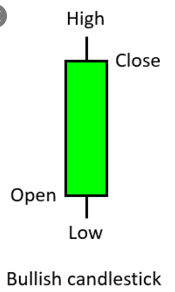
The result in the candle with a deep lower wick. The color of body can be neither bullish or bearish
High Volume Test - Bad News
In this case the sellers returning would be in larger number and forcing the price to move lower
(20/n)
High Volume Test - Bad News
In this case the sellers returning would be in larger number and forcing the price to move lower
(20/n)
Testing Demand :
After the distribution phase ends then the insiders will make sure that there is no demand left. They make the price higher and check if there is a demand. If there is no demand then closed back near to the open proce with a very low volume
(21/n)
After the distribution phase ends then the insiders will make sure that there is no demand left. They make the price higher and check if there is a demand. If there is no demand then closed back near to the open proce with a very low volume
(21/n)
This will result in the candle with a long upper wick
If there is any demand left then the price will move up and try to close at the higher levels.
In this case also they cross check like
Low Volume Test - Good News
High Volume Test - Bad News
(22/n)
If there is any demand left then the price will move up and try to close at the higher levels.
In this case also they cross check like
Low Volume Test - Good News
High Volume Test - Bad News
(22/n)
All these r my understandings from the book. If you feel I have missed any points then you can add it.
If any mistakes are there then you can comment
If you feel that by reading this one can at least get some basic idea of what is VPA, then retweet so that maximum can benefit
n/n
If any mistakes are there then you can comment
If you feel that by reading this one can at least get some basic idea of what is VPA, then retweet so that maximum can benefit
n/n
• • •
Missing some Tweet in this thread? You can try to
force a refresh


