Anyone fancy an #Earthday data thread?
One of my frustrations with this topic is that all too often it’s portrayed in enormously over-simplistic terms: We need to stop flying! Cutting down forests is killing the planet!
So here’s some charts that show you the numbers that matter
One of my frustrations with this topic is that all too often it’s portrayed in enormously over-simplistic terms: We need to stop flying! Cutting down forests is killing the planet!
So here’s some charts that show you the numbers that matter
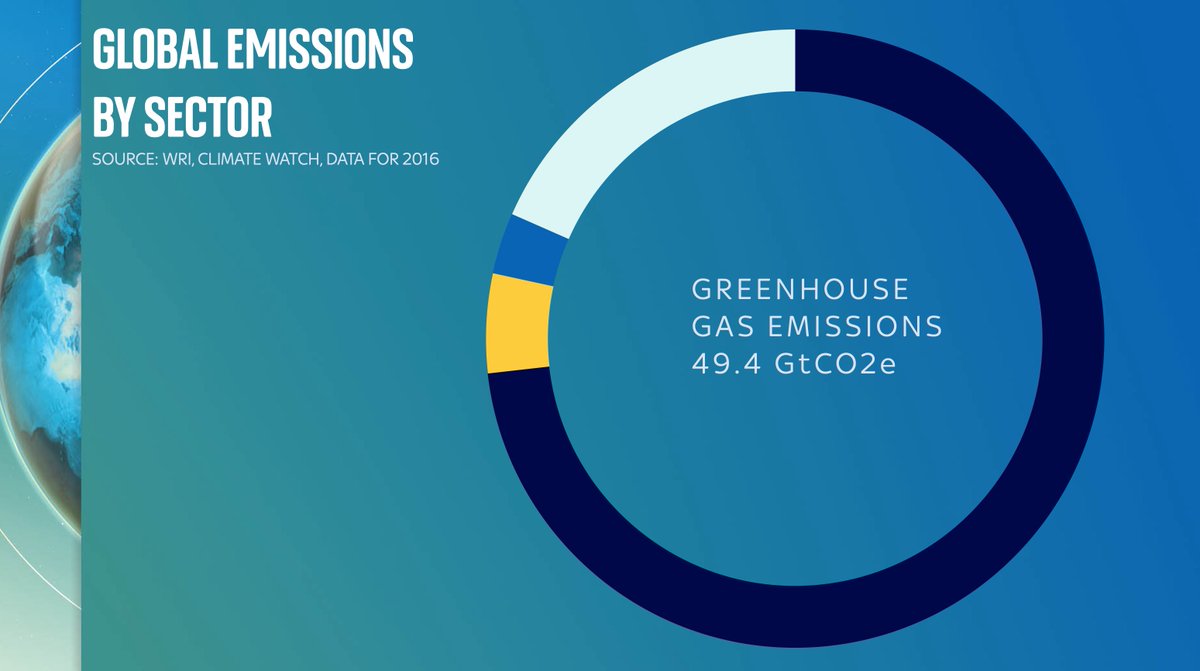
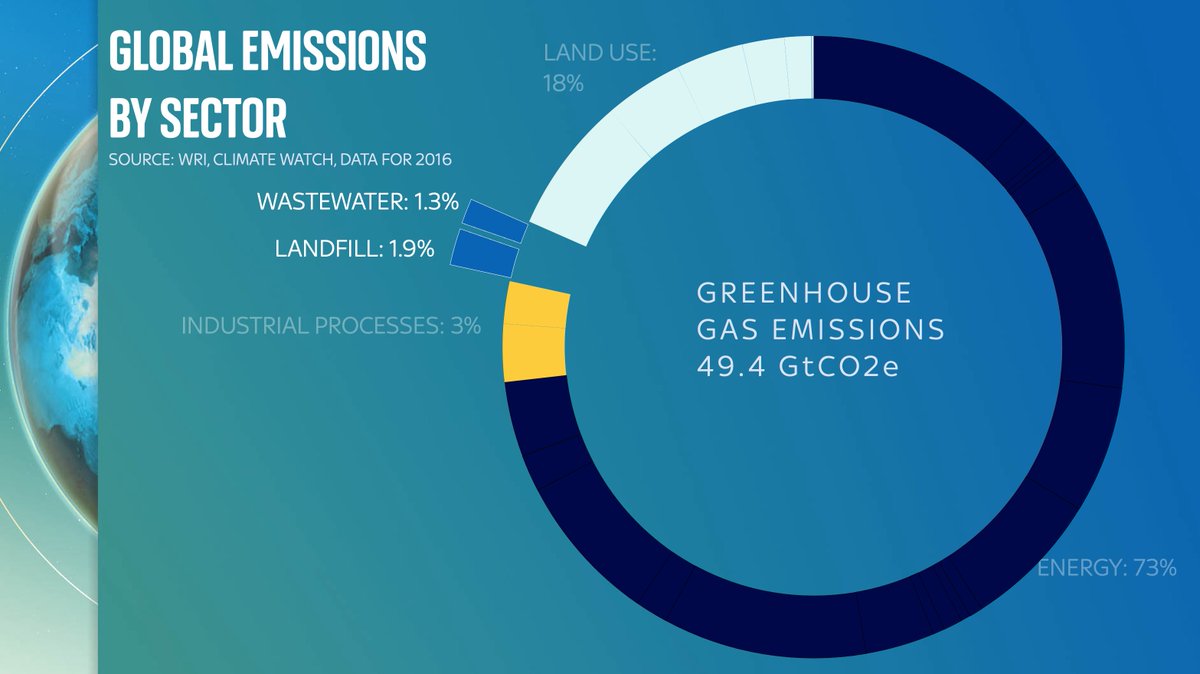
Let’s start with this: this doughnut shows you total global emissions. About 50 gigatonnes of CO2 or equivalent. The numbers are from @WorldResources based on @IEA data which you and I can’t afford to see because they’re stuck behind a mammoth paywall. 
First let’s break the doughnut into some primary categories: the vast majority is emissions from energy: everything from power stations to gas boilers to industrial processes. But also note a big chunk is emissions directly coming from the land/farming, and industry/waste
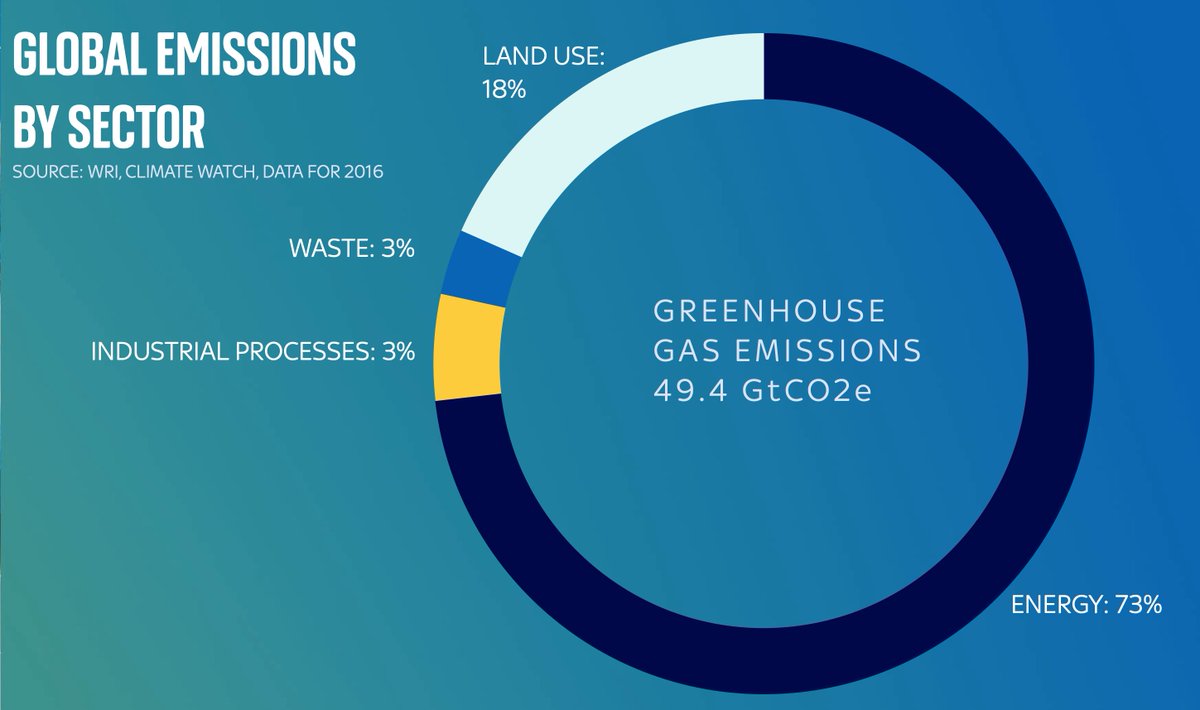
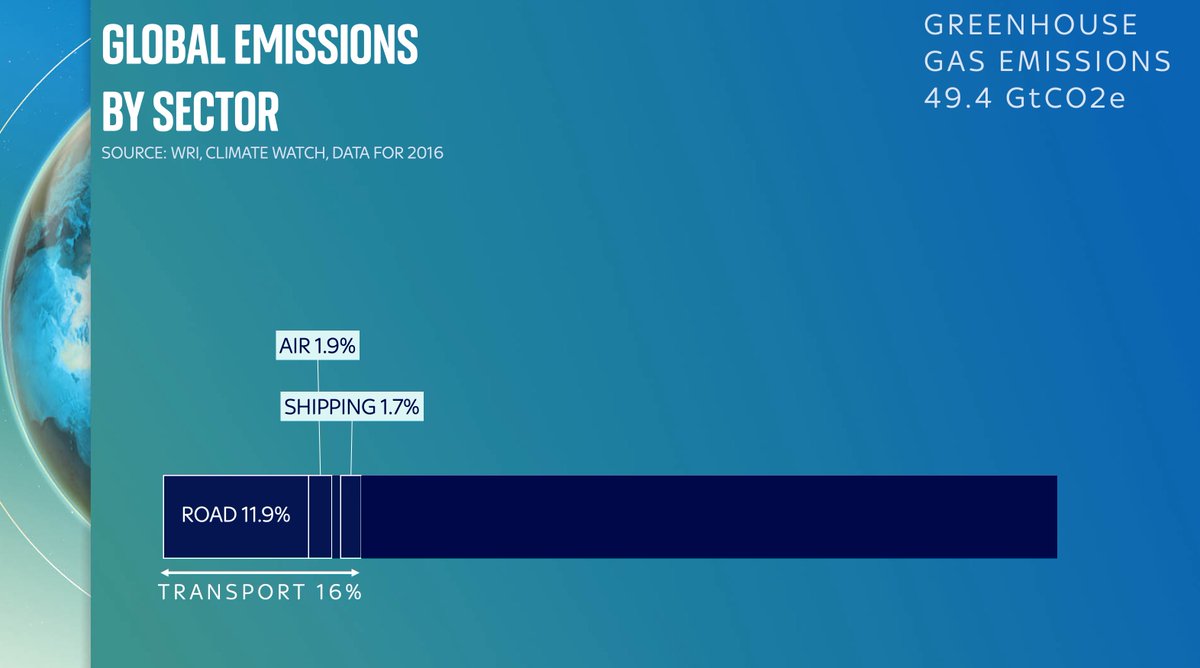
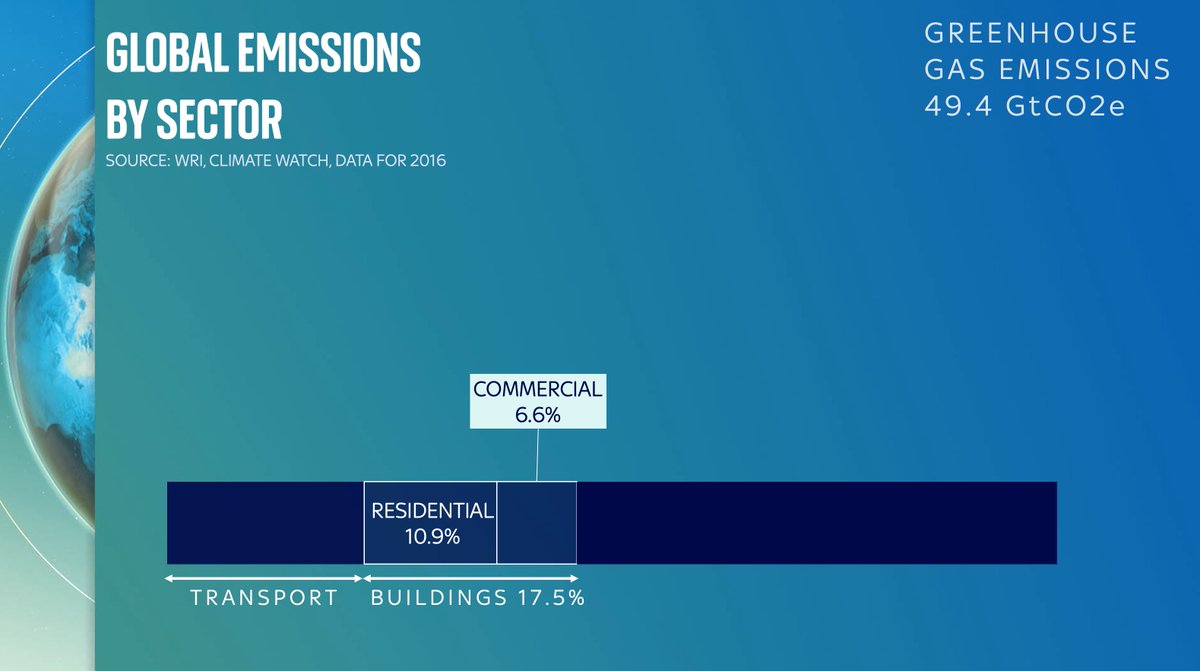
Let’s start with the bits that are probably pretty familiar. First, energy. It’s the vast majority of our emissions. And if you break it down further you can see the main parts. You’ve got transport (car exhausts, planes etc). Emissions from buildings (electricity, heating/AC).
What’s really striking (to me at least) is that the biggest component part of the biggest slice of emissions is not how we get around or how we live, but industrial processes: primarily iron/steel. This is a really, really big deal. Steel is not a sideshow. It’s a massive emitter

In fact, emissions from steel and the chemicals industry are about the same as the total emissions the nearly eight billion people on this planet create in our homes - from electricity, heating etc. A few thousand companies vs eight billion people!

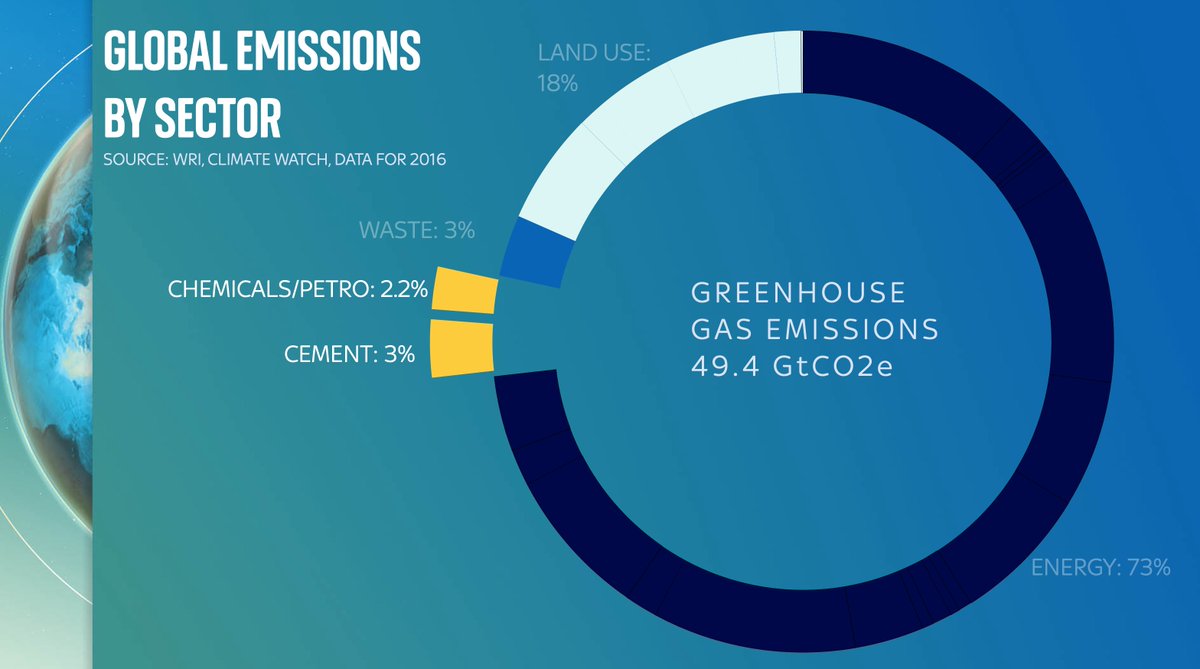
Of course, energy isn’t the only source of emissions. CO2 is also puffed out from the chemical process when we make cement. A LOT of CO2. Methane wafts up from landfill. Then there’s land use, which is worth breaking down because it’s a very big deal…
So much is said abt reducing fossil fuel use, but far less about this slice of the emissions pie:
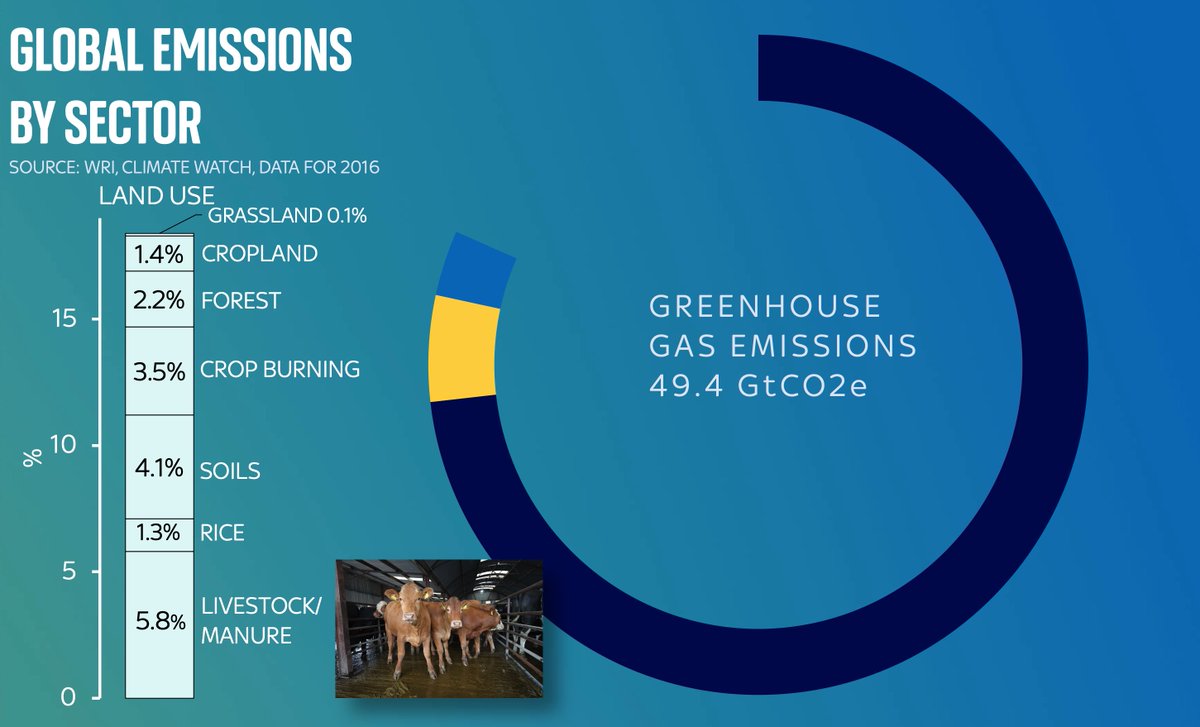
Land use
Lots comes from livestock & manure.
A striking amount is methane emissions from rice paddy fields - more than for every other crop!
Why aren’t we talking more about RICE?!
Land use
Lots comes from livestock & manure.
A striking amount is methane emissions from rice paddy fields - more than for every other crop!
Why aren’t we talking more about RICE?!
Dig into the data and it’s also clear that the mainstream narrative about carbon is somewhat divorced from the data. We talk a LOT about aviation emissions, and about deforestation. We talk far less about cement production. Yet it accounts for more emissions than either of those.
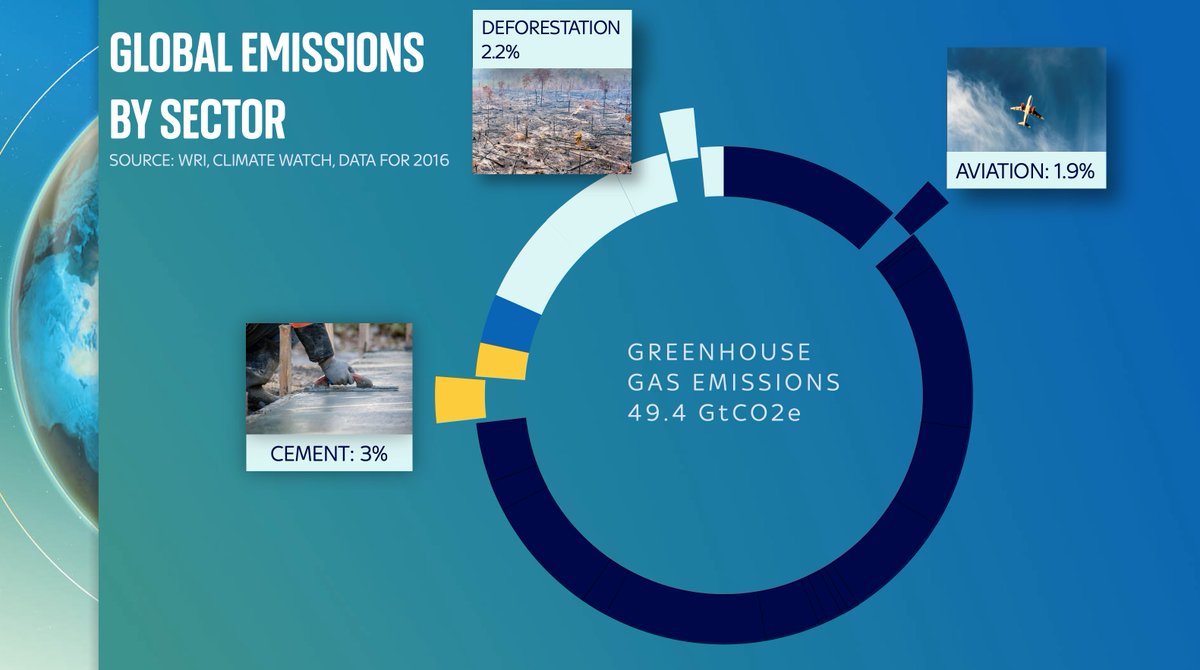
Actually that 3% number for cement production is an understatement since that’s purely the CO2 released from the chemical reaction in turning limestone into lime. We should really add on another 3-4% for the emissions from the ENERGY used to power the cement kilns.

There’s a great @WorldResources sankey diagram of all of this, which neatly shows you which sector is producing carbon and which methane etc here. My data is from there. Worth playing around with yourself wri.org/data/world-gre…

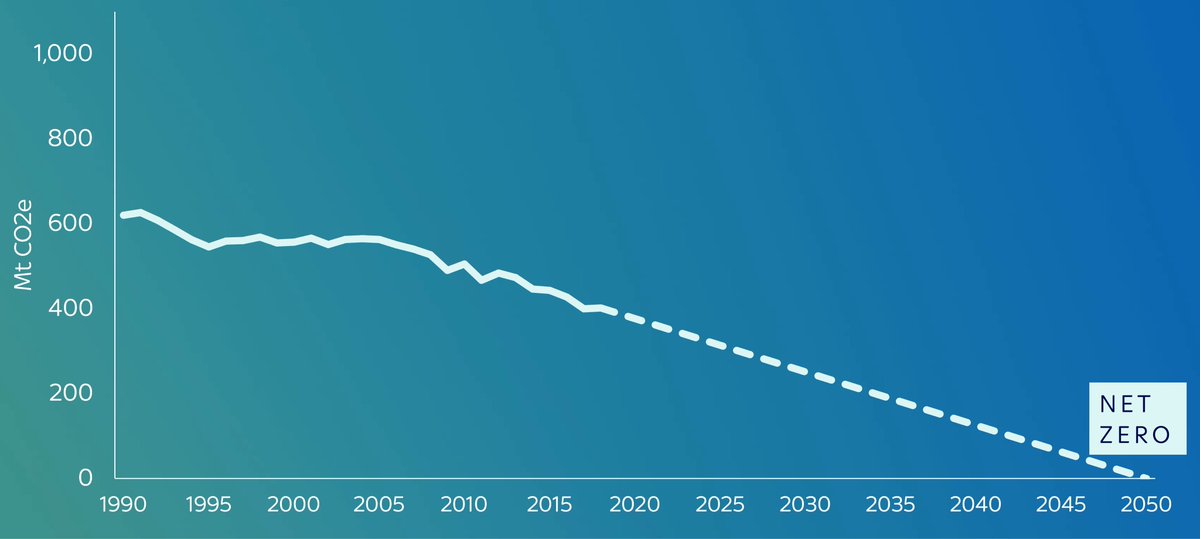
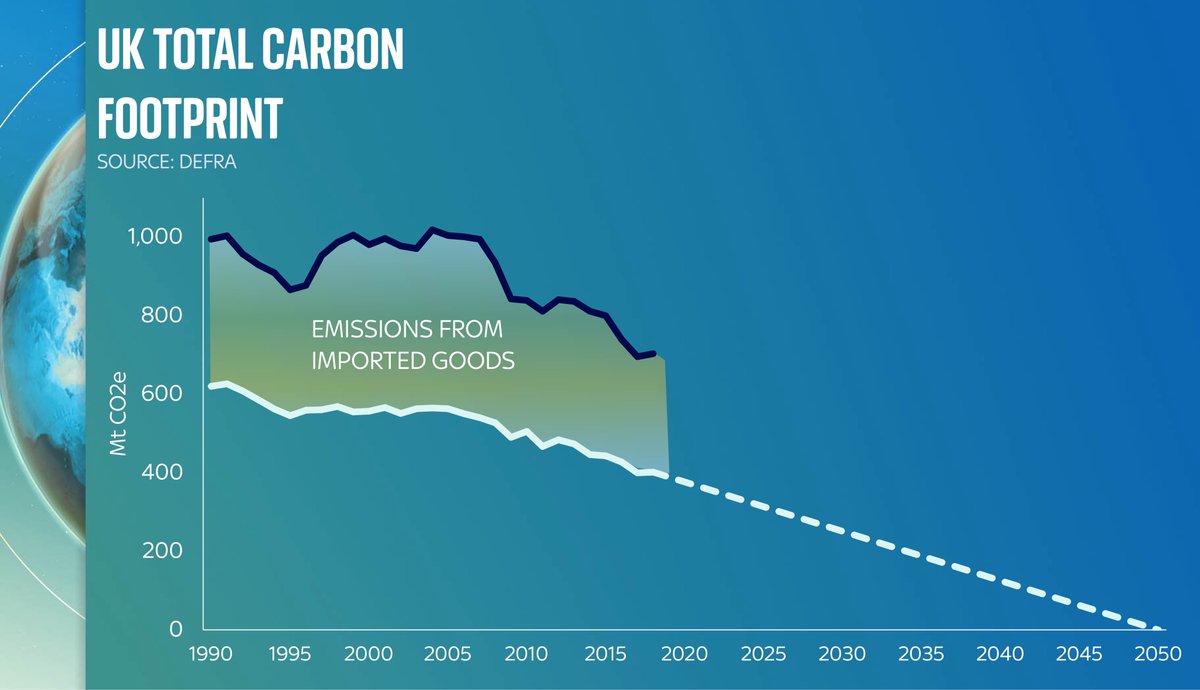
It’s worth saying at this stage: the UK’s specific pie chart is different: less carbon coming from industrial processes, for one thing. One of the upshots is that our domestic carbon emissions are actually pretty low. And falling quite fast. Hurrah!
But now include the carbon embedded in all those products we’re buying from overseas. Steel from Poland, aluminium, cement etc, and you can see our carbon FOOTPRINT - eg the emissions from the products we produce and consume, are far, far higher

It’s worth keeping this chart in the back of your mind as politicians go on about net zero in the coming months. What they’re invariably talking about is the white line. That’s fair enough. That’s what they control. But the black line also really matters.
Overarching lesson: if we’re really serious abt getting to net zero, we shouldn’t just be talking about forests. We should be talking about cement.
We shouldn’t just be talking about coal. We should be talking about rice…
Video here:
We shouldn’t just be talking about coal. We should be talking about rice…
Video here:
Before you say anything, yes there is another way to break down global carbon emissions: not by sector but by COUNTRY.
If you’re interested in that breakdown, you’ll find it in this video. You can probably guess the biggest polluter…
If you’re interested in that breakdown, you’ll find it in this video. You can probably guess the biggest polluter…
• • •
Missing some Tweet in this thread? You can try to
force a refresh