Prashant Profile picture
Apr 29, 2021 8 tweets 4 min read Read on X
PCA is one of the most famous algorithms for dimensionality reduction and you are very likely to have heard about it in Machine Learning.

But have you ever seen it in action on a dataset?

If not, check this thread 🧵↓ for a quick depiction:
If you are not sure how PCA works, check this wonderful thread by @TivadarDanka

Let us consider a very simple Image Dataset, the Fashion MNIST dataset, which has thousands of images of fashion apparel.

Using PCA we can reduce the amount of information that we want, we can choose up to a certain amount that seems necessary for our particular task.
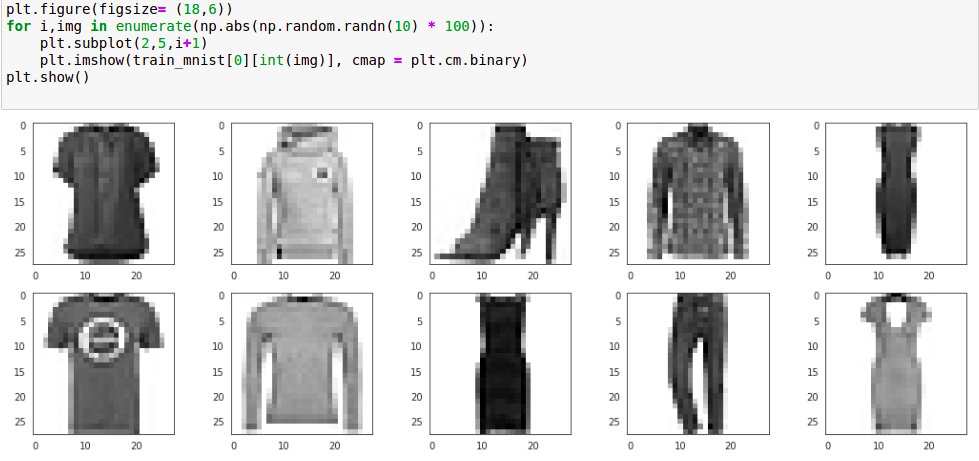
It still would have a lot of the information of the entire dataset.

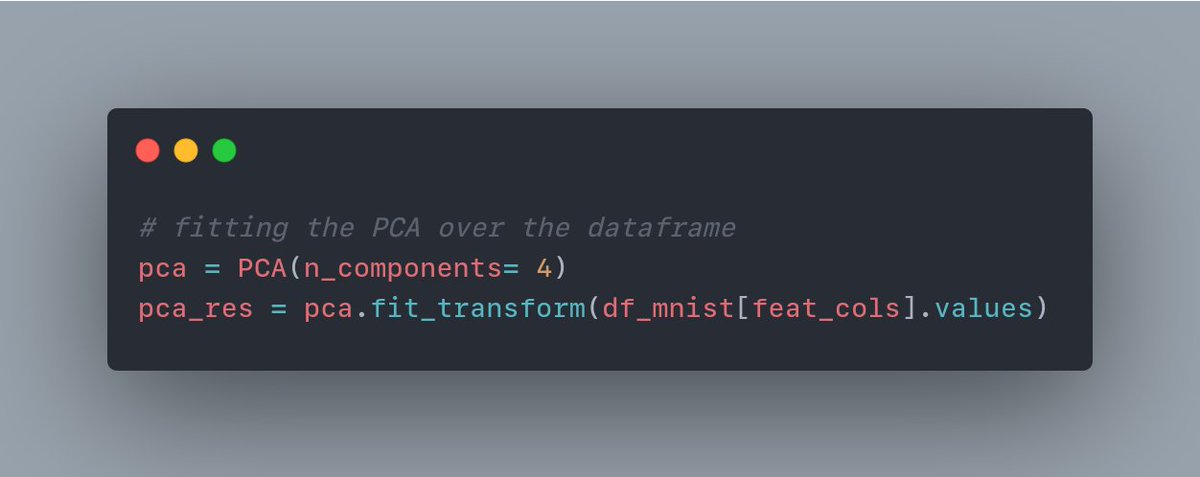
We fit the PCA, and it breaks down the image information in terms of several components. We can try with 4 components here.

We can try different numbers of components and see how many are enough for our case.
Here we can think of the variance explained by each component in the images as the measure of information.

We can see for each component how much information it is capturing in multiple ways.

Here's a bar chart with the y-axis showing the variance for each component.
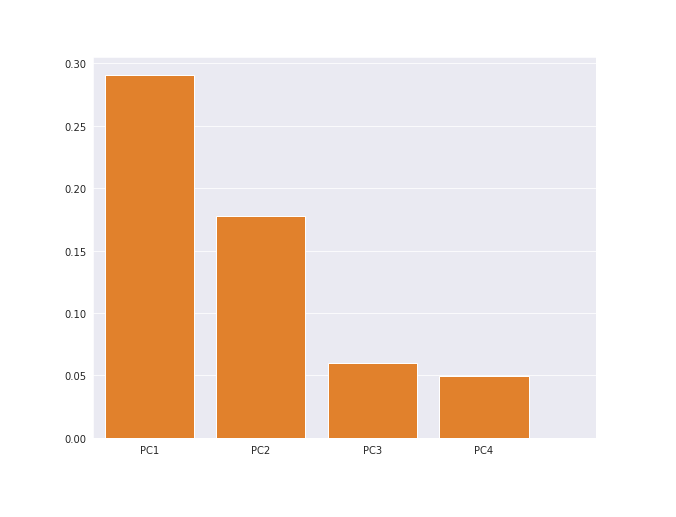
In above bar chart the components show around 29, 18, 6, and 5 explained variance

Cumulative Sum can be used to show that if we combine them then how much of the variance in total we would be able to explain.

Here's a line plot with individual and cumsum variance explained.
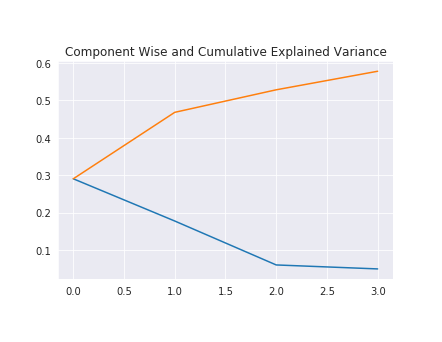
Now we can see in total we are able to explain about 58% of the variance by just 4 components

We can visualize each of them in terms of the images as well.

This would give us a better idea of the features from the images that are being captured by those components.
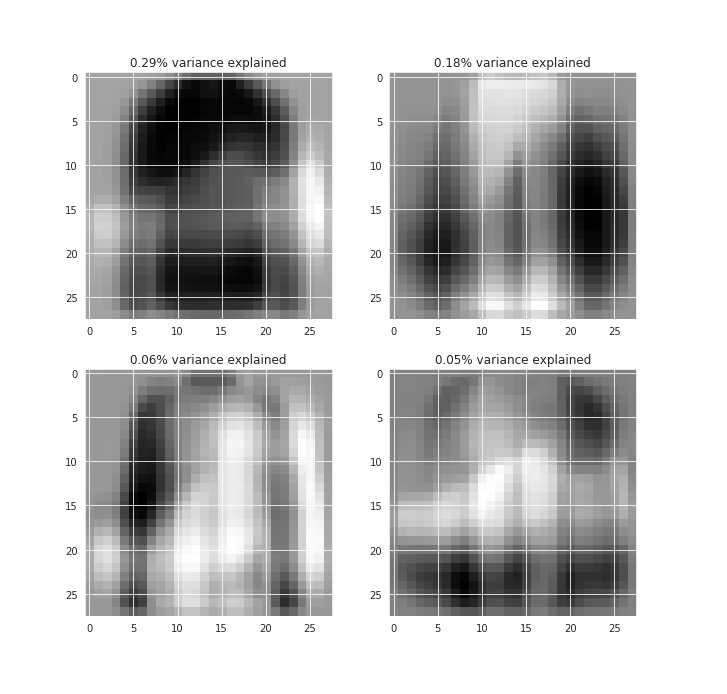
In the first component, we can see the shirt-like feature captured which is so common in the data.
And a very transparent shape for the shoe, hinting at some of the footwear variances captured.

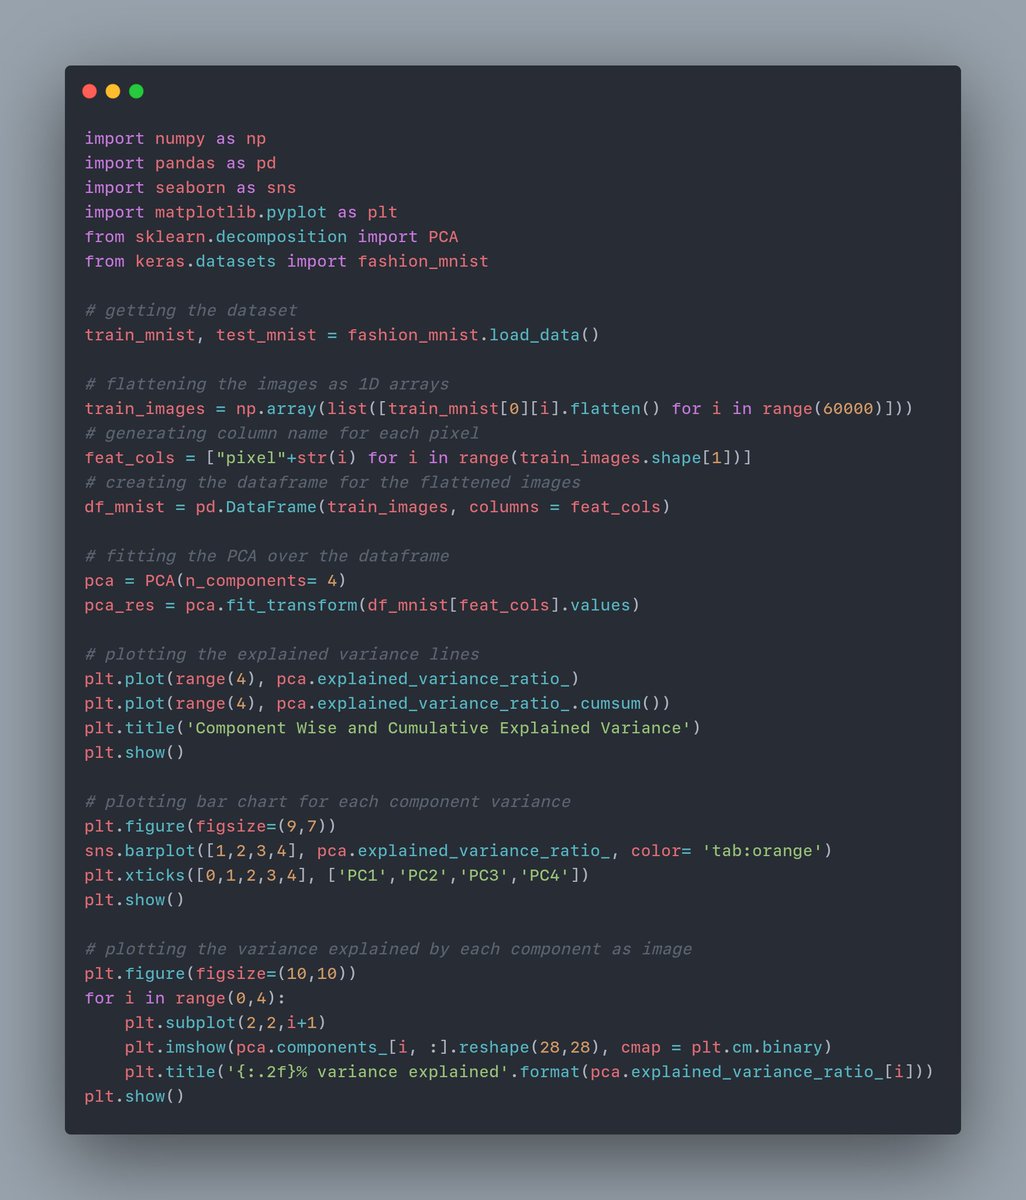
Here's the entire code snippet for PCA and the plots.

Hope this helps!👍

• • •

Missing some Tweet in this thread? You can try to force a refresh
 

Keep Current with Prashant

Prashant Profile picture

Stay in touch and get notified when new unrolls are available from this author!

Read all threads

This Thread may be Removed Anytime!

PDF

Twitter may remove this content at anytime! Save it as PDF for later use!

Try unrolling a thread yourself!

how to unroll video
  1. Follow @ThreadReaderApp to mention us!

  2. From a Twitter thread mention us with a keyword "unroll"
@threadreaderapp unroll

Practice here first or read more on our help page!

More from @capeandcode

Feb 24, 2023
How ChatGPT Works?

• Everyone knows about ChatGPT but not everyone is aware of how it works.

Here is an attempt at explanation ↓

[ In 10 Steps ]
• It is a large language model based which uses a technique called "transformer" to understand and generate human-like responses to text-based input.

• Transformer is a neural network architecture that excels at processing sequential data, such as text.
• The model is trained on a massive amount of text data from a wide range of sources, such as books, articles, and websites.

• These resources allow the model to learn patterns and relationships in language.
Read 12 tweets
Sep 22, 2022
"Learn SQL"

Great advice no doubt.

• But what topics to cover?
• Which SQL database to use?
• What resources to learn from?

Here's is a track you can follow ↓

1/22
Let's start with choosing the SQL database to learn.

• There are several of databases like Postgres, MS SQL server, MS Access, Oracle.

• But for learning purposes I'd suggest going with MySQL.

• For reasons that it is secure, free & open source and the support is great.
• Later on we can switch to other databases easily.

• Now what topic should we know in SQL? I knew the basics like select, where and joins but I couldn't get past them.

• So here are some topics and terms everyone should learn, starting with...
Read 23 tweets
Sep 14, 2022
Interview Question:

• What is Covariance?
• What is Correlation?

• What are the differences between them?

Explain briefly ↓

0/9
COVARIANCE

• Covariance tells us the systematic relationship between two random variables, in which a change in one reflects the change in other.

• It measures the joint variability of two random variables.

• The formula for covariance is:

1/9
• It has a range of [-∞, +∞].

• The greater the covariance, the more reliant the relationship.

• The covariance value isn't very easy to interpret and depends on the context.

2/9
Read 11 tweets
Sep 12, 2022
Interview Questions

• How does k-means work?
• What are its stopping criteria?
• What are its pros and cons?
• How do you choose its number of clusters?

Explain briefly ↓

0/4 Image
1. Working

• k-means is an unsupervised algorithm.

• We want to create groups of similar data points using this algorithm.
• In k-means we begin with a set of random points as clusters.

• We measure the distance of each point from the clusters using some distance metric like euclidean or cosine.

• We assign points to the cluster that is closest to it.
Read 11 tweets
Sep 2, 2022
Another common interview question

• What are the assumptions of Linear Regression?
• How do we check them?
• How can we fix them?

Here's the answer ↓

0/5
1. Linear Relationship

It is assumed that the relationship between the dependent and independent variables is linear.
!How to check:

• Observe the Residuals vs Fitted Value plots, there shouldn't be any evident pattern.
Read 17 tweets
Aug 31, 2022
Random Forests is a favorite for interviews!

By far the most common questions that I have been asked are one way or other related to Random Forests

It's important to know it inside out.

Here's are some of those questions:

0/8
Q: What ensemble principle is used in Random Forests?

A: Random Forest works on the principle of the bagging ensemble technique.

Bagging stands for Bootstrap Aggregation.
In Bagging, random data samples in a training set are used with replacement.

1/9
Q: Do Random Forests require pruning?

A: Random Forests usually do not require pruning as they don't overfit like a single DT as trees are bootstrapped and multiple random trees use random features so the individual trees are strong predictors without being correlated.

2/9
Read 15 tweets

Did Thread Reader help you today?

Support us! We are indie developers!


This site is made by just two indie developers on a laptop doing marketing, support and development! Read more about the story.

Become a Premium Member ($3/month or $30/year) and get exclusive features!

Become Premium

Don't want to be a Premium member but still want to support us?

Make a small donation by buying us coffee ($5) or help with server cost ($10)

Donate via Paypal

Or Donate anonymously using crypto!

Ethereum

0xfe58350B80634f60Fa6Dc149a72b4DFbc17D341E copy

Bitcoin

3ATGMxNzCUFzxpMCHL5sWSt4DVtS8UqXpi copy

Thank you for your support!

Follow Us!

:(